International Journal of Emerging Technology and Advanced Engineering
Website: www.ijetae.com (ISSN 2250-2459, Volume 2, Issue 4, April 2012)272
Evaluation of Spatial Complexity Metrics of Object Oriented
Software
Jambi Ratna raja kumar
1, Srinu Dharavath
2 1Affiliated to University of Pune & Genba Sopan Rao Moze College of Engineering,Pune
2Affiliated to University of Pune & Genba Sopan Rao Moze College of Engineering,Pune
Abstract: - Spatial complexity plays an important role in developing the maintainable software. One of the important activities of the maintenance phase is to understand the source code first, and if any changes are required in source-code then change it. Understandability of the software gets affected by psychological complexity of the source code and cognitive abilities. The correlation between the orientation and location of various entities with their processing needs to be established by the programmers, which requires spatial abilities. These spatial abilities play an important role in object-oriented software, in which the use of data as well as the methods of the class needs to be understood in combined way. The measures of spatial complexity of object oriented software are categorized based on definition and usage of classes and objects. The values of these measures get affected suitably because of inheritance and polymorphism as well, due to change in the distances. This paper evaluates the significance of object oriented spatial complexity with the help of 16 object oriented projects of varied length. Results have been validated with fault removal time, LOC, number of attributes and number of methods.
Keywords:- Object-oriented software, Software metrics,
Understandability, Spatial complexity, Psychological
complexity, Software comprehension, Maintainability.
I. INTRODUCTION
Software comprehension is one of the largest costs in the software lifecycle. In an attempt to control the cost of comprehension, various complexity metrics have been proposed to characterize the difficulty of understanding a program and thus allow accurate estimation of the cost of a change. Spatial complexity metrics attempt to account for the difficulty of reading the source code of a program for understanding [2].
Since the software comprehension can account for over one third of the lifetime cost of a software system [2], those metrics that directly address the cognitive complexity of a program could be seen as particularly important. Work in this area has addressed control flow paths [13], the volume of operands and operators [14], identifier density [15], and spatial complexity.
The spatial complexity was first introduced by Douce et al. [4] with subsequent additional measures proposed by Chhabra et al. [6].
The definitions of the spatial complexity metrics are given by K .K. Aggarwal, Yogesh Singh [1]. The value of average Class Spatial Complexity gives a hint about the understandability of a class. The higher value of class spatial complexity of a particular class means more cognitive effort needed to understand the purpose and functionality of the class. The object spatial complexity measure can be used to measure the understanding of processing logic through objects and their interaction, which in turn reflects effective utilization of the objects towards final solution. Classes normally are not used directly, but through objects only. Lower value of object spatial complexity indicates that the class has been utilized through objects in close proximity to the class declaration, and, hence, understanding the use of that class towards total software working will be much easier than a class having larger value of object spatial complexity.
Spatial complexity metrics are related to the understandability of the program as discussed in [1]. To remove the fault in the code, the understandability of the source code is important. Software size also affects the understandability of the source code. Hence the evaluation of the spatial complexity measures is carried out in this paper with size measures and fault removal time.
Section 2 describes class spatial complexity. Section 3 describes object spatial complexity. Section 4 describes results of experimentation. Section 5 presents conclusions and future work.
II. CLASS SPATIAL COMPLEXITY
Website: www.ijetae.com (ISSN 2250-2459, Volume 2, Issue 4, March 2012)
273
The understandability of the object oriented software starts with comprehending the concept of classes as an encapsulation of data and methods. The class spatial complexity measures the spatial complexity of both parts of the classes-methods and attributes [1].
2.1.Class Attribute Spatial Complexity
The concept behind the measurement of CASC is to measure the distance between use and definition of the attributes. If an attribute is being used close to its definition, the details about that attribute will be available in the working memory of the programmer, making it possible for him to comprehend the purpose of the attribute. The CASC of an attribute can be defined as the average of distances of various use of that attribute from its definition/previous use.
P
CASC =∑ Distance (I) / P (1)
I=1
Where P represents the count of use of that attribute and Distance (I) is equal to the absolute difference in number of lines of the current use of the attribute from its just previous use within the same method.
If the definition is not present in the current file, the programmer tries to find the details of that class and attribute in other file. In this case, that particular use of the attribute can be computed as
Distance= (distance of first use of the attribute from the top of the current file)+(distance of definition of the attribute from the top of the file containing definition) (2)
Total class attribute spatial complexity of a class (TCASC) is defined as average of CASC of all attributes (variables as well as constants) of that class.
q
TCASC = ∑ CASC (I) / q (3)
I=1
Where „q‟ is the count of attributes in the class. 2.2.ClassMethod Spatial Complexity
The distance between method declaration and definition belong to the same file. But some times source code of software is written in multiple files, and method is declared in one file and defined in some other file. In this case the distance for that particular definition of method is defined as Distance = (distance of definition from the top of file containing definition) + (distance of declaration of the method from the top of the file containing declaration) (4)
Total class method spatial complexity (TCMSC) of a class is defined as average of class method spatial complexity of all methods of the class.
m
TCMSC = ∑ CMSC (I) /m (5)
I=1
Where‟ m‟ is the count of the methods of the class The class is an encapsulation of attributes and methods, the class spatial complexity is an integration of both types of spatial complexities, and hence the class spatial complexity (CS C) of a class is proposed as
CSC = TCASC + TCMSC (6)
III. OBJECT SPATIAL COMPLEXITY
The object spatial complexity is defined of two types: those are object definition spatial complexity and object member usage spatial complexity [1].
3.1. Object definition spatial complexity
The object definition spatial complexity (ODSC) of an object is the distance of the definition of the object from corresponding class declaration.
If the object oriented software is written using multiple source code files and the object is defined in a different file than the file containing class declaration, the effort is dependent on two files. In this case, the distance for that particular object is defined as:
Distance= (distance of object definition from the top of file containing definition) + (distance of declaration of the corresponding class from the top of the file Containing
class) (7)
3.2. Object-Member Usage Spatial Complexity
The object-member usage spatial complexity (OMUSC) of a member through a particular object is defined as the average of distances (in terms of lines of code) between the call of that member through the object and definition of the member in the corresponding class.
n
OMUSC = ∑ Distance (I)/n (8)
I=1
Where n represents count of calls/use of that member through that object, and Distance (i) is equal to the absolute difference in number of lines between the method definition and corresponding call/use through that object.
The object spatial complexity of an object is defined as
International Journal of Emerging Technology and Advanced Engineering
Website: www.ijetae.com (ISSN 2250-2459, Volume 2, Issue 4, March 2012)274
IV. EXPERIMENTATION
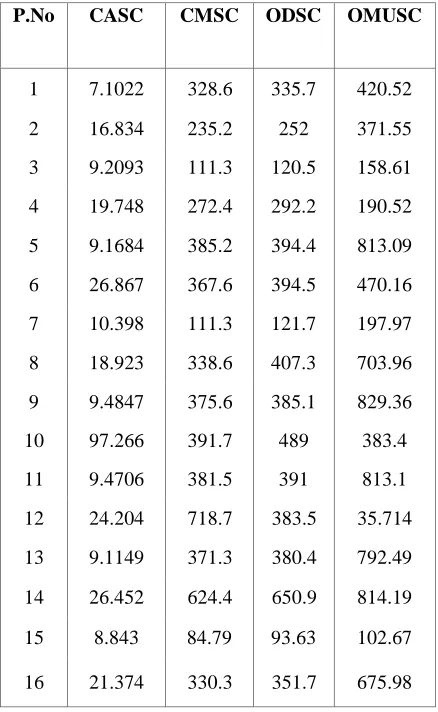
[image:3.612.48.267.347.703.2]In order to evaluate the spatial complexity measures, 16 java projects developed by the Under Graduate students of Department of Computer Science & Engineering, Pondicherry Engineering College has been used. Two or three members involved in developing the projects. The length of the programs varies from 372 non blank-non comment lines to 1465. The numbers of classes found in the programs vary from 10 to 17. The Complexity measures Class Attribute Spatial Complexity (CASC), Class Method Spatial Complexity (CMSC), Object Definition Spatial Complexity (ODSC) and Object Member Usage Spatial Complexity (OMUSC) are computed by an automated tool developed in java. The results are tabulated in Table 1.
Table 1
Spatial complexity metrics of 16 projects considered
P.No CASC CMSC ODSC OMUSC
1 7.1022 328.6 335.7 420.52
2 16.834 235.2 252 371.55
3 9.2093 111.3 120.5 158.61
4 19.748 272.4 292.2 190.52
5 9.1684 385.2 394.4 813.09
6 26.867 367.6 394.5 470.16
7 10.398 111.3 121.7 197.97
8 18.923 338.6 407.3 703.96
9 9.4847 375.6 385.1 829.36
10 97.266 391.7 489 383.4
11 9.4706 381.5 391 813.1
12 24.204 718.7 383.5 35.714
13 9.1149 371.3 380.4 792.49
14 26.452 624.4 650.9 814.19
15 8.843 84.79 93.63 102.67
16 21.374 330.3 351.7 675.98
As the spatial complexity measures are mainly focused for understandability, we want to evaluate (correlate) it with the following factors:
i. Fault Removal Time (FRT):
Fault Removal Time is defined as the time taken to remove the faults (in minutes) in the project. After the development of the projects, they are tested using the test set derived from the requirements of the problem. The number of test cases not satisfied becomes the number of faults in the project. Clear understanding of the system is required to remove faults. Hence time taken to remove the faults may be proportional to the spatial complexity metric values of the respective project.
ii. Size metric I-Lines of Code(LOC)
Lines of code (number of non blank-non comment lines) is one of the common size measures under use. As the size of the project increase/decrease, the spatial complexity measures, in turn the understandability is expected to increase/ decrease.
iii. Size metrics II-Number of Attributes (NA), Number of Methods (NM)
As LOC is much dependent on the developer skills, some of the alternative size measures are sought. Two of such design measures (known at design phase before code completion) are NA, NM (Number of Attributes defined, Number of Methods defined).
The respective hypotheses for the correlation of the spatial complexity measures and the three factors discussed are framed as follows.
Hypothesis 1:Fault Removal Time increases as the spatial complexity measures increase (+ve correlation)
Hypothesis 2:Increase in LOC increases the spatial complexity (+ve correlation)
Hypothesis 3:Increase in Number of Attributes, Number of Methods increases the code, hence increases the spatial complexity.
Website: www.ijetae.com (ISSN 2250-2459, Volume 2, Issue 4, March 2012)
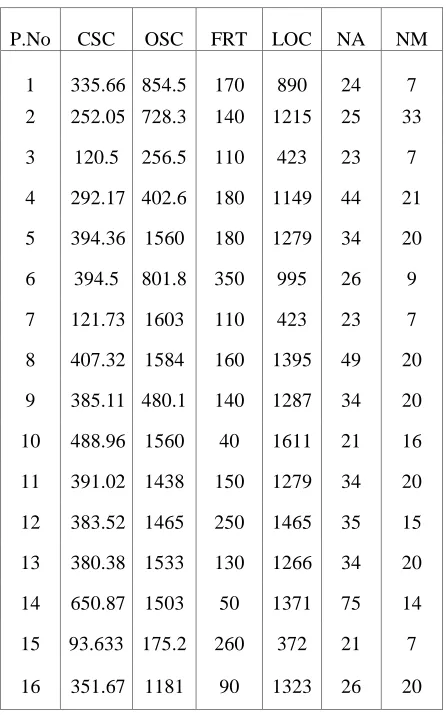
[image:4.612.49.272.164.525.2]275
Table 2
Fault removal time (FRT), LOC of 16 Projects
P.No CSC OSC FRT LOC NA NM
1 335.66 854.5 170 890 24 7
2 252.05 728.3 140 1215 25 33
3 120.5 256.5 110 423 23 7
4 292.17 402.6 180 1149 44 21
5 394.36 1560 180 1279 34 20
6 394.5 801.8 350 995 26 9
7 121.73 1603 110 423 23 7
8 407.32 1584 160 1395 49 20
9 385.11 480.1 140 1287 34 20
10 488.96 1560 40 1611 21 16
11 391.02 1438 150 1279 34 20
12 383.52 1465 250 1465 35 15
13 380.38 1533 130 1266 34 20
14 650.87 1503 50 1371 75 14
15 93.633 175.2 260 372 21 7
16 351.67 1181 90 1323 26 20
The Data set given in Table 2 is used to find the correlation coefficient using SPSS Package version 15.0. The results are presented in Table 3. First column shows the spatial complexity metric considered, second column shows the factors used for evaluation, third column shows the correlation coefficient value obtained and fourth column significance of the result value (<0.05 expected).
The results show that Fault Removal Time is having less correlation. It may be due to the removal of faults by the developer them self. If it was done by a separate testing team, the real impact would have been observed.
The correlation results between the spatial complexity measures and LOC are better with high significance. Similar behavior is also found with Number of Attributes and Number of Methods.
Table3
Correlation between Spatial Complexity metrics and factors used for evaluation
Spatial complexity Metric
Factor
used
For
Correlation
Coefficient
value
P-Value
Evaluation
CSC FRT 0.250 0.350
OSC FRT 0.334 0.206
CSC LOC 0.836 0.000
OSC LOC 0.536 0.035
CSC NA 0.666 0.005
OSC NA 0.309 0.245
CSC NM 0.290 0.275
OSC NM 0.163 0.546
From this experiment we find that spatial complexity measures affect the understandability of the software. This has been observed through the size measures (LOC, NA and NM).
V. CONCLUSIONS
In this paper the spatial complexity measures proposed exclusively for object oriented software are evaluated for their correlation with Fault Removal Time, LOC, Number of Attributes and Number of Methods. The results show that spatial complexity measures are correlated with size measures. This work can be extended for the relation of the spatial complexity measures with quality factors.
REFERENCES
[1] J.K. Chhabra, K.K. Aggarwal, Yogesh Singh,” Measurement of Object Oriented Software Spatial Complexity”, Information and Software Technology, vol.46 (2004) pp.689-699.
[2] Nicolas E. Gold, Andrew M. Mohan, “Spatial complexity metrics: an investigation of utility”, IEEE Transactions on software engineering, March 2005, vol.31, pp.203-21 2. [3] J. Shao and Y. Wang, “A New Measure of Software Complexity
Based on Cognitive Weights”, Proc. Canadian Conf. Electrical and Computer Eng., vol.2, Pp.1333-1338, 2003.
International Journal of Emerging Technology and Advanced Engineering
Website: www.ijetae.com (ISSN 2250-2459, Volume 2, Issue 4, March 2012)276
[4] C.R. Douce, P.J. Layzell, and J. Buckley, “Spatial Measures of Software Complexity”, Proceedings of 11th Meeting of Psychology of Programming Interest Group,
http://www.ppig.org/workshops/11th programme.html, 1999. [5] T. Klemola and J. Rilling, “A Cognitive Complexity Metric Based
on Category Learning”, Proc. Second Int‟l Conf. Cognitive Informatics, pp. 106-112, 2003.
[6] J.K. Chhabra, K.K. Aggarwal, and Y. Singh, “Code and Data Spatial Complexity: Two Important Software Understandability Measures”, Information and Software Technology, vol. 45, no. 8,
pp. 539-546, June 2003
[7] R .Harrison, S.J. Counsell, and R.V. Nithi, “An Investigation into the Applicability and Validity of Object-Oriented Design Metrics”, Empirical Software Eng., vol. 3, no. 3, pp. 255-273, Sept. 1998. [8] J.S. Davis and R.J. LeBlanc, “A Study of the Applicability of
Complexity measures”, IEEE Trans. Software Eng., vol. 14, no. 9, pp. 1366-1372, Sept. 1988.
[9] G.K. Gill, C.F. Kemerer,”Cyclomatic complexity density and software maintenance productivity”, IEEE Transactions on Software Engineering, Vol.17,no.12, pp. 1284-1288,1991. [10] T. Demacro,” controlling software projects”, Yourdon press, Engle
wood Cliffs, NJ, 1982.
[11] G.E. Deyoung, G.R. Kampen, J.M. Topolski,” Analyzer Generated and Human-Judged Predictors of Computer Program‟s Readability”, Proceedings of SIGCHI Conference on Human Factors in Computing Systems ,March 1982,pp. 223-238.
[12] M.P. O‟Brien, J. Buckley, “Inference-Based and Expectation Based Processing in program Comprehension”, Proc. Ninth IEEE Int‟l workshop program comprehension, pp. 71-78, 2001.
[13] T.J. McCabe, “A Complexity Measure”, IEEE Trans. Software Eng., vol.2, no.4, pp.308-320, Dec. 1976.
[14] M.H. Halstead, Elements of Software Science. Elsevier North Holland, 1977.