To Study the Effect of Process Parameters for Minimum
Surface Roughness of Cylindrical Grinded AISI 1045 Steel
Taranveer Singh, Khushdeep Goyal
*, Parlad Kumar
Department of Mechanical Engineering, Punjabi University, Patiala-147002, India *Corresponding Author: [email protected]
Copyright © 2014 Horizon Research Publishing All rights reserved.
Abstract
In this present work, The effect of input parameters viz. work speed, wheel speed, abrasive material, depth of cut, concentration of cutting fluid and number of passes has been found on the surface roughness of cylindrical grinded AISI 1045 steel has been found. Three levels of each variable have been selected except wheel speed. Two levels of wheel speed have been taken. Heat treated AISI 1045 has been taken as work piece material. The result reveals that type of abrasive material is the most significant to influence surface roughness, followed by work speed. The optimum set of input parameters for minimizing the surface roughness has also been found.Keywords
Input Parameters, Grinding, Surface Roughness, Abrasive Material1. Introduction
Grinding is a manufacturing process whose complex characteristic determine the technological output and quality of a product. The surface roughness is one of most critical quality constraint for selection of grinding factors in process planning. In the present study AISI 1045 steel has been selected as the test material because it is an important material used for making axles, bolts, connecting rods, pins spindles, crank shaft, guide rods etc. All these components require good surface finish and cylindrical grinding is the common finishing operation used for these components.
2. Literature Review
.Agarwal et al. [1] developed an analytical model for surface roughness prediction of ground ceramics based on the analysis of grooves left by the grains that interact with the work piece which is characterized by the under formed chip thickness. The authors observed that at higher speed ratio, the surface finish is better. Also the surface roughness increased with an increase in depth of cut and feed. Shih et al. [2] conducted the experiment to investigate the effect of
wheel speed, coolant flow rate and truing on Zirconia and M2 tool steel using a vitreous bond CBN wheel for high speed grinding. The author found that both normal and tangential grinding forces were reduced, but surface finish and roundness of ground parts did not improve. High coolant flow rate eliminate grinding burn on M2 steel layer and layer of Zirconia powder on wheel after grinding Zirconia. Nathan et al. [3] studied on In-process monitoring of grinding burn in the cylindrical grinding of steel. In steels burn is characterized by a visible bluish temper colour on the ground surface. The authors found that spark temperature can be considered to be good representative of grinding zone temperature and hence useful for process-monitoring purposes. Kwak [4] studied on evaluating the grinding parameters effect on geometric error by the taguchi method and developing a mathematical model by the response surface method for predicting geometric error. The author concluded that depth of cut effect more for geometric error and next was grain size. The utilization of response surface model was evaluated to select proper grinding conditions with constraints of the surface roughness and response surface model was very useful for predicting the geometric error. Sahin [5] studied wear resistance of three types of steels a low carbon steel (A1SI 1020), Carbon steel (A1SI 1340) and low alloyed steel (A1SI 5150) on a pin–on-disc type apparatus. The experiments were carried to analyze the influence of testing parameters on weight loss of various steel work pieces. An L9 orthogonal array was used. The orthogonal array, signal-tonoise ratio and analysis of variance were used to investigate the optimal testing Parameters. For AISI 1340 steel, abrasive grain size exerted the most or greatest effect on wear, but in AISI 1020 and AISI 5150 steels sliding distance exerted greatest effect on the weight loss. Kwak et al. [6] developed response surface models to predicate the grinding power and surface roughness in external cylindrical grinding of pardoned SCM 440 steel and also help in selection of grinding conditions. They concluded that due to response surface model, it is possible to predict the grinding power and the surface roughness
the grinding behavior and to achieve optimal operating process parameters. From Pareto analysis, the authors found that feed rate played most important role on surface roughness. George et al. [8] taken random distribution of the grain protrusion heights into account and simulation shows that the root part of surface is smoother than the top part and these results are consistent with experiment. On the basis of the literature following objectives of this experimentation are to determine the effect of input parameters on surface finish and to determine optimum set of input parameters for better surface finish. Singh et al. [9] measured the performance in terms of optimization of material removal rate. After performing the experiment, results of both wires have been compared. It is found that the cryogenically treated zinc coated diffused brass wire gives good material removal rate as compare to cryogenically treated plain brass wire.
On the basis of the literature following objectives of this experimentation are to determine the effect of input parameters on surface finish and to determine optimum set of input parameters for better surface finish.
3. Design of Experiment
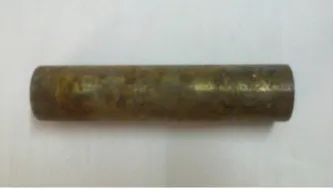
In this study AISI 1045 steel is selected as the work piece material, which is a medium carbon steel, as shown in figure 1. The chemical composition of this steel is shown in table 1. This material offers a very good balance of strength and good ductility. Due to these properties it is generally used for
making shafts and gears. AISI 1045 steel is also used in manufacturing of axles, machine parts, studs, pinions and pins. Three types of grinding wheels used in the experimentation were: White aluminum oxide, Green silicon carbide and Black aluminum oxide.
Figure 1. Photograph of a work piece
Table 1. Chemical Composition of AISI 1045 Steel
Element Percentage
Carbon 0.45%
Silicon 0.25%
Manganese 0.75%
Chromium 0.050%
[image:2.595.349.516.144.239.2]Molybdenum 0.050%
Table 2 shows L18 array with different input parameters and their respective levels.
Table 2. L18 Experimental Design
Des. A B C D E F
Exp.
No. Wheel speed(rpm) Work piece speed(rpm) Abrasive material Depth of cut(µm)
Conc. of cutting fluid
(%)
Number of passes
1 2100 250 A 60B 15 3 2
2 2100 250 A 60W 20 4 3
3 2100 250 SIC 60G 25 5 4
4 2100 500 A 60B 15 4 3
5 2100 500 A 60W 20 5 4
6 2100 500 SIC 60G 25 3 2
7 2100 710 A 60B 20 3 4
8 2100 710 A 60W 25 4 2
9 2100 710 SIC 60G 15 5 3
10 2640 250 A 60B 25 5 3
11 2640 250 A 60W 15 3 4
12 2640 250 SIC 60G 20 4 2
13 2640 500 A 60B 20 5 2
14 2640 500 A 60W 25 3 3
15 2640 500 SIC 60G 15 4 4
16 2640 710 A 60B 25 4 4
17 2640 710 A 60W 15 5 2
18 2640 710 SIC 60G 20 3 3
[image:2.595.312.552.281.381.2] [image:2.595.100.511.439.746.2] [image:2.595.99.511.440.747.2]4. Experimental Results
After conducting all the 18 experiments with different input factor levels, the results were obtained for surface roughness (SR) for the work pieces.In Table 3, the calculated value of S/N ratio is shown in last column for all 18 experiments. In this design situation, surface roughness has been find out with lower is better approach.
Table 3. S/N ratios for surface roughness
A B C D E F
Exp.
No. Wheel speed
(rpm)
Work speed (rpm)
Abrasive material
Depth of cut (µm)
Conc. of cutting fluid
(%)
Number of passes
SR (Ra) (µm)
S/N ratio (dB)
1 2100 250 A 60B 15 3 2 0.40 7.958
2 2100 250 A 60W 20 4 3 0.66 3.609
3 2100 250 SIC 60G 25 5 4 0.37 8.635
4 2100 500 A 60B 15 4 3 0.37 8.635
5 2100 500 A 60W 20 5 4 0.69 3.223
6 2100 500 SIC 60G 25 3 2 0.35 9.118
7 2100 710 A 60B 20 3 4 0.45 6.935
8 2100 710 A 60W 25 4 2 0.55 5.192
9 2100 710 SIC 60G 15 5 3 0.50 6.020
10 2640 250 A 60B 25 5 3 0.76 2.383
11 2640 250 A 60W 15 3 4 0.78 2.158
12 2640 250 SIC 60G 20 4 2 0.54 5.352
13 2640 500 A 60B 20 5 2 0.44 7.130
14 2640 500 A 60W 25 3 3 0.51 5.848
15 2640 500 SIC 60G 15 4 4 0.26 11.700
16 2640 710 A 60B 25 4 4 0.37 8.635
17 2640 710 A 60W 15 5 2 0.57 4.882
18 2640 710 SIC 60G 20 3 3 0.28 11.056
Legends: A 60B= Aluminum 60 (black), A 60W= Aluminum 60 (white), SIC 60G= Silicon carbide 60 (green).
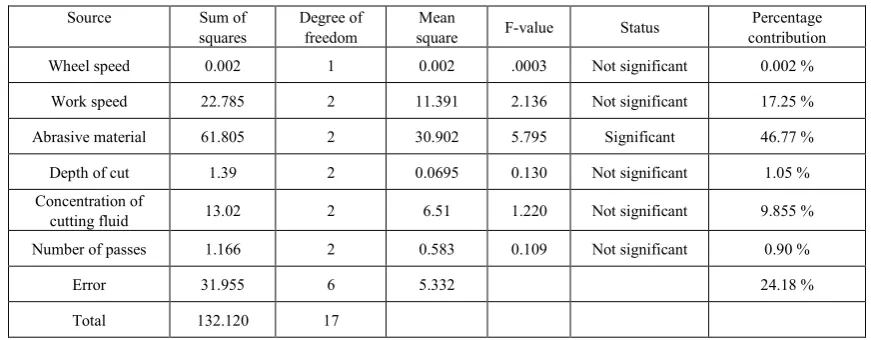
Results obtained from the experiments were analyzed using ANOVA, as shown in table 4, which helps in predicting the significance of input parameters taken for any desired response function.
Table 4. Analysis of variance for S/N ratio for surface roughness (Ra)
Source Sum of
squares Degree of freedom square Mean F-value Status contribution Percentage
Wheel speed 0.002 1 0.002 .0003 Not significant 0.002 %
Work speed 22.785 2 11.391 2.136 Not significant 17.25 %
Abrasive material 61.805 2 30.902 5.795 Significant 46.77 %
Depth of cut 1.39 2 0.0695 0.130 Not significant 1.05 %
Concentration of
cutting fluid 13.02 2 6.51 1.220 Not significant 9.855 %
Number of passes 1.166 2 0.583 0.109 Not significant 0.90 %
Error 31.955 6 5.332 24.18 %
Total 132.120 17
[image:3.595.86.522.534.704.2]Table 5. Response table for mean signal-to-noise ratio for surface roughness
A B C D E F
Level Wheel speed (rpm) Work speed
(rpm)
Abrasive material
Depth of cut (µm)
Concentration of
cutting fluid (%) Number of passes
1 6.591* 5.015 6.946 6.892* 7.718* 6.605
2 6.568 7.609* 4.152 6.217 7.187 6.258
3 --- 7.120 8.646* 6.635 5.378 6.881*
DELTA 0.023 2.594 4.494 0.675 1.809 0.623
RANK 6 2 1 4 3 5
*higher the better
Factors have been ranked according to the higher delta value. Higher is the delta value, higher is the rank. Therefore abrasive material is having the highest rank 1 and is the most significant factor followed by work speed (rank 2) and concentration of cutting fluid (with rank 3). The wheel speed with its lowest rank is the least significant in affecting the surface finish.
5. Results and Discussion
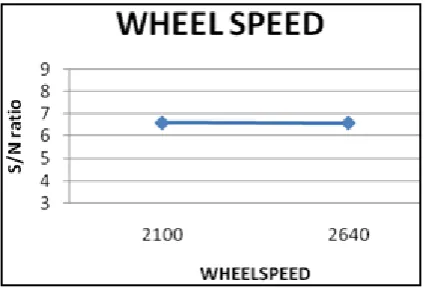
Figures from 2 to show main effect plots and interaction for surface roughness. Main effect plot shows the variation of surface roughness with each of variable i.e. wheel speed, work speed, abrasive material, depth of cut, concentration of cutting fluid and number of passes. From Figure 2, it is observed that wheel speed does not have any effect on surface roughness. Plot for wheel speed shows almost a straight horizontal line, means that there is very less change in response with changing levels of wheel speed.
Figure 2. Main effect plot of means of S/N ratios of SR for grinding wheel
speed
From Figure 3, it is observed that the S/N ratio increases suddenly when the work speed increases from 250 rpm to 500 rpm and then slightly decreases when work speed again increases from 500 rpm to 710 rpm and the S/N ratio is maximum when the value of work speed is 500 rpm and it is optimum value which gives lower surface roughness. [8]. also found that increase in the work piece speed in a wide
range leads to better surface finish with small depth of cut.
Figure 3. Main effect plot of means of S/N ratios of SR for work piece
speed
The S/N value is varying in case of abrasive material as shown in Figure 4. From the main effect plot it is shown that S/N ratio decreases when the abrasive material changes from aluminum 60 (black) to aluminum 60 (white) and then the value increases when abrasive material again changes from aluminum 60 (white) to silicon carbide 60 (green). With SiC 60 (green) abrasive material the surface roughness value is minimum.
Figure 4. Main effect plot of means of S/N ratios of SR for abrasive wheel
type
[image:4.595.110.506.86.239.2] [image:4.595.72.285.490.634.2] [image:4.595.321.545.547.683.2]ratio is higher at depth of cut of 15 µm which means it is optimum level of depth of cut. [2] found that plastic deformation is desirable for low surface roughness and it dominates only when depth of cut is low.
Figure 5. Main effect plot of means of S/N ratios of SR for depth of cut
From Figure 6, it is observed that the S/N ratio remains almost constant when concentration of cutting fluid changes from 3% to 4%. But when concentration of cutting fluid changes from 4% to 5%, the value of S/N ratio decreases. Therefore SR is better with 3% concentration of cutting fluid.
Figure 6. Main effect plot of means of S/N ratios of SR for concentration
of cutting fluid
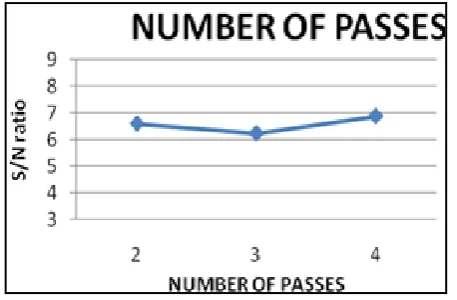
Figure 7. Main effect plot of means of S/N ratios of SR for number of
passes
The main effect plot shown in Figure 7, shows that the S/N ratio slightly decreases when number of passes increases from 2 to 3. When number of passes increases from 3 to 4 the S/N ratio slightly increases. It means more number of passes may contribute to better surface finish.
The optimum values of input parameters for surface roughness are shown in Table 6.
Table 6. Optimal values of parameters for surface roughness
Input parameters Optimum set Optimum value
Wheel speed A1 2100 rpm
Work speed B2 500 rpm
Abrasive wheel C3 Sic 60 (green)
Depth of cut D1 15 µm
Concentration of
cutting fluid E1 3 %
Number of passes F3 4
6. Conclusions
The effect of six independent variables was studied for the surface roughness and following conclusions are found:
Abrasive material, work speed and concentration of cutting fluid were three factors which mainly affects surface roughness.
Abrasive material was found to be most significant factor for surface roughness and wheel speed was found to be least significant factor.
Maximum surface finish was obtained with SIC 60G abrasive materials.
The wheel speeds, depth of cut and number of passes have very less effect on surface roughness.
For optimal results of surface roughness, the set of parameters is wheel speed of 2100 rpm, work speed of 500 rpm, silicon carbide 60 (green) abrasive wheel, depth of cut 15µm, concentration of cutting fluid 3% and number of passes 4.
REFERENCES
[1] Agarwal, S., Rao, P.V.: Modeling and Prediction of Surface Roughness in Ceramic Grinding, International Journal of Machine Tools and Manufacture, 50, 1065-76, 2010. [2] Shih, A.J., Grant, M.B., Yonushonis T.M., Morris, T.O., and
McSpadden, S.B.: Vitreous Bond CBN Wheel for High Speed Grinding of Zirconia and M2 Tool Steel, Transactions of NAMRI/SME, 26, 195-200, 1998.
[image:5.595.64.293.131.283.2] [image:5.595.312.555.182.305.2] [image:5.595.61.293.390.540.2] [image:5.595.64.293.575.725.2][4] Kwak, J.S.: Application of Taguchi and Response Surface Methodologies for Geometric Error in Surface grinding Process, International Journal of Machine Tools and Manufacture, 45, 327-34, 2005.
[5] Sahin, Y.: Optimal Testing Parameters on the Wear Behaviour of Various Steels”, Materials and Design, 27, 455-60, 2005.
[6] Kwak, J.S., Sim, S.B., and Jeong, Y.D.: An Analysis of Grinding Power and Surface Roughness in External Cylindrical Grinding of Hardened SCM 440 Steel using the Response Surface Method, International Journal of Machine Tools and Manufacture, 46, 304-12, 2006.
[7] Janardhan, M., Krishna, A.G.: Determination and optimization of cylindrical grinding process paramerters using taguchi method and regression analysis, International Journal of engineering science and Technology, 3, 7, 5659-65, 2011.
[8] George, L.P., Job, K.V., and Chandran, I.M.: Study on Surface Roughness and its Prediction in Cylindrical Grinding Process based on Taguchi method of Optimization, International Journal of Scientific and Research publications, 3, 5, 2013.
[9] Singh, N., Kumar, P., and Goyal, K.:Effect of Two Different Cryogenic Treated Wires in Wire Electrical Discharge Machining Of Aisi D3 Die Steel, Journal of Mechanical Engineering, 43(2), 54-60, 2014.
[10] Alagumurthi, N., Palaniradja, K., and Soundararajan, V.: Heat Generation and Heat Transfer in Cylindrical Grinding Process – A Numerical Study, International Journal of Advanced Manufacturing Technology, 34, 474-82, 2006. [11] Ptashnikov, V.S.: Inceasing Work piece Peripheral Speed as a