Journal of Chemical and Pharmaceutical Research, 2014, 6(6):2086-2093
Research Article
CODEN(USA) : JCPRC5
ISSN : 0975-7384
Path optimization wireless sensor network based on ant colony algorithm
Zeyu Sun
Department of Computer and Information Engineering, Luoyang Institute of Science and Technology, Luoyang, China
_____________________________________________________________________________________________
ABSTRACT
A new path optimization algorithm based on ant colony——ant colony algorithm has showed great strengths in large scale optimization problem. This paper solved the optimization problem in the area coverage and barrier coverage based on ant colony algorithm. An improved basic ant colony algorithm is proposed. During the process that wireless sensor network try to cover its target area, a lot of redundant nodes are generated, resulting in excessive network energy consumption and incomplete node coverage. Against this problem, an efficient covering algorithm based on point set optimization is proposed. In the algorithm, the Gaussian normal density function and coverage area probability function are utilized during optimization of the point set, so that an optimal point set which meets certain coverage requirements is given through the quantitative relationship between the node sensing radius and number of nodes in the network, and furthermore, the network resource is optimized, the lifetime and Qos of the network are improved, and the network overhead is also reduced. Simulation result shows that: during test results against different coverage area and comparison to PEAS algorithm and GAF algorithm, the effectiveness and stability of the algorithm are verified.
Key words: wireless sensor network; ant algorithm;coverage control; path optimization; network lifetime
_____________________________________________________________________________________________
INTRODUCTION
WSN (Wireless Sensor Network) is a kind of self-organization network system which consists of large number of inexpensive sensor nodes, and its nodes are characterized by a certain sensing ability, computing power and communication capabilities. It is widely used in the fields of defense and military, environmental monitoring, rescue works and etc. WSN works in such a way that following way: large numbers of sensor nodes are distributed in discrete form within the coverage area, and data is sent to or collected from nodes directly or indirectly. Usually the target node is covered in a manner that sensor nodes are high density deployed to monitor the target area, and to improve the quos of network, information is exchanged among sensor nodes to achieve target node coverage and information processing. But there’re some defects, first, deployment of larger number of sensor nodes in target area results in existence of considerable amount of redundant nodes, which consume much network energy and reduce the network Qos[1-3]. Second, due to the excessive consumption of node energy, and non-rechargeable feature of nodes, the network tends to collapse quickly. How to distribute sensor nodes in target area reasonably to determine the minimum point set under certain coverage requirement, and how to limit the power consumption maximally, become key problems which influence the network lifetime directly [4-5]. In summary, the solving of energy issues and coverage problem means monitoring the given area at the minimum nodes number and low energy cost, meanwhile, the quality of coverage should be guaranteed. It is also the study focus of this paper.
focus. Only to determine the monitoring area coverage in sensor networks, to understand the existence of the monitoring area coverage holes, which further adjust the deployment of nodes in the network while minimizing the reduction of redundant nodes, reducing energy consumption, better network lifetime.
In real applications, the sensor nodes in the sensing function, computing power, energy, link, agreements are often differences, which formed heterogeneous wireless sensor networks [6-8]. How to learn has been covering algorithm, combined with the network hardware and software resources to address the heterogeneous wireless sensor network coverage control problem in wireless sensor networks have become important research coverage control the direction of development, is of great scientific significance and wide application value.
BASIC DEFINITION AND THE NETWORK MODEL
In real life, multi-objective optimization problem is widespread; many issues are affected by a number of conflicting and composed of sub-goals. Improvement in a sub-target is likely to cause one or more additional sub-goal performance degradation [9]. What to optimize for multiple sub-goals to coordinate as much as possible to achieve several goals to achieve optimal performance. Maximization and minimization problems can be interchangeable, so only minimize multi-objective optimization problem for the study, which is described as follows:
( )
(
( ) ( )
( )
)
( )
( )
1 , 2 , . 0, 1, 2,3
0, 1, 2,3 T n
i
i
f x f x f x f x
s t x i n
x i n
ϕ x = ≤ = ≤ = (1)
Where, x=(X X X1, 2, 3Xn)is an m-dimensional decision vector; X is decision space,x∈X ,f x( )the target vector
functions, including the n sub-objective function; constraints ϕi( )x ≤0and n inequality constraints includes n equality constraints xi( )x =0. For multi-objective optimization gives look at a few definitions:
Definition 1: (a feasible solution) ∀ ∈x X to satisfy (1) where all the constraints, called X is a feasible solution.
Definition 2: (set of feasible solutions) are composed of a collection of feasible solutionsXf, Xf ⊆X called the set of feasible solutions.
Definition 3: (Pareto dominance) for any two feasible solutions X1 andX2, satisfy the following conditions:
( )
( ) ( )
( )
( )
( ) ( )
( )
1 2 1 2i i i
i i
f x f x f x f x
f x f x f x f x
∀ ∈ ≤
∃ ∈ ≤
(2)
Called feasible solution X1 dominatesX2, denoted byX1X2.
Definition 4:tmoment in the city ant k i jtransition probabilities Select City p t( ) is:
( )
( ) ( )
( ) ( )
0 otherwise
k
ij ij
k k
is is ij s allowed
t t j allowed t t P t a β a β t h t h ∈ ∈ =
∑
(3)Whereinallowed={0,1, 2,… − −n 1} tabuk, aare inspired factor information, which means that the relative importance of
the path. β is the expectation inspiration factor, which means that the relative importance of visibility. dij Is
represents the distance between cities.
Definition 5: the coverage rate of a wireless sensor network W deployed in the target region Ω is represented as follows:
( , ) 0 ( ) ( )
r
C W W =
∫
Wf x dx f W (4)f(x) is the target function of optimal node subset; f(Ω) is the target area. f(x) is defined as follows:
( ) 1 1( ) 2
(
2( ))
f x =w f x +w 1−f x (5)
Defining 6: Gaussian normal density function: 2
2 2
1 ( ) exp
2 2
r f x
pσ σ
= −
(6)
It probability that the node covering radius is r:
( ) 0 ( ) 1 exp( 222) r
s
r p r f x dx
σ
=
∫
= − − (7)Max Min ant system with basic ant colony algorithm also has three different aspects. First, in order to avoid the occurrence of premature convergence behavior, finding the optimal solution, each iteration increases allowed only one ant pheromone update. Update rules are as follows:
(
1)
( )
( )
ij t ij t t
t + =ρt + ∆t (8)
Wherein, ∆t( )t is the path length of the countdown, it is meant that the iteration is the optimal solution or the global
optimal solution, but the main use of iterative optimal solution, so you can make a lot of solutions to get occasional strengthened avoid searching too concentrated [10-11]. Secondly, in order to avoid stagnation, MMAS pheromone ranges were defined, namely[t tmin, max], after each cycle, must ensure compliance with this limit the amount of
pheromone. The final step is the initialization of pheromone, select the larger value of the area defined as the initial value of pheromone, which can start in the algorithm can be performed on a large exploration.
As the amount of information exists evaporation factor ρ, if ρ is large, that have never been searched will reduce the amount of information on the path to close to zero, reducing the global search capability of the algorithm; if the
ρ value is reduced, although they could improved to some extent the global search capability, but makes convergence speed decreases. Therefore, based on the actual situation adaptive changes in the value of its regulation function is:
( )
(
)
(
)
minmin
0.95 1 0.95 1
t if t
t
other
ρ ρ ρ
ρ ρ
− − ≥
=
(9)
a β ρ Parameters of the ant colony algorithm directly affect the value of the global convergence and solution
[image:3.595.244.370.584.716.2]efficiency. Optimal combination of parameters ant colony algorithm is an extremely complex problem optimization problem, there is currently no comprehensive theory. Most papers have not discussed are usually selected according to a set of values of experience , these experiences are derived from test results , from a purely theoretical analysis of the results is still very small. There are some papers on the ant colony algorithm convergence is analyzed, but the current results of these analyzes are used to guide the parameter selection is difficult. Some colony algorithm in earlier papers , the values of various parameters on the test verification conducted , however, to be taken by the artificial means of different combinations of parameters to verify that it is very difficult , so far no parameter group discussions on cooperation too . Many scholars have studied the genetic algorithm and ant colony algorithm fusion, many of these studies is to use genetic algorithms to optimize various parameters ant colony algorithm. But for different problems , the optimal parameter values may be different . Therefore, the ant colony algorithm parameter combinations problem remains to be done further research.
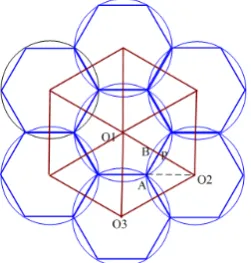
Generally speaking, the coverage rate directly reflects the degree of concern of target; nodes with high concern degree are usually accompanied by high coverage rate. In order to study such a problem, now network model of the relation between the sensor node and the destination node is given. This is shown in figure 1:
Sensor networks using sensors small size cost cheap, generally a lot of running for detection. Since node density is high, a point or an area often covered simultaneously by multiple nodes, called "coverage redundancy." If all nodes are to keep working condition, when an event occurs, the event is all monitored nodes Tried to data collection node (sink node) or base station (base station) to send data. On the one hand, a large number of Nodes simultaneously transmit data can cause radio transmission interference and medium expropriation conflict, causing additional node energy consumption; On the other hand, these data contain a large amount of redundant information, wireless sensor networks using multi-hop communication, Redundant data will result in an additional intermediate forwarding node energy consumption. Therefore, redundant data will greatly shorten the overall Lifetime of the network. To minimize redundant data resulting from energy consumption and prolong network lifetime, the need for random deployment of network topology optimization control, while maintaining coverage performance under the premise of reducing the work Nodes.
Figure 1 shows the optimal placement of sensor nodes, the entire monitor area can be covered by a minimum of nodes. Minimal node can be calculated by the following formula:
2 2 3 3 area P n r p
p = (10)
area
P is the area of the entire monitoring area, nis the zone with the minimum number of nodes, ris the radius of
the node detection (detection radius smaller than the size of the monitoring area). The figure shows the connection between any three nodes form a regular triangle with side length 3r. If the target area is a square area of 50m × 50m, node detection radius isRs=10, placed in a manner as shown in Figure 1 the node need only nodes 14 may completely cover the target area.
Theorem 1: In the monitoring area, any three sensor nodes twenty-two intersect seamless maximum coverage area
is: 2 3 3 2
2 2
S= pr + r , expected value: EA=82.73%
Proof: In the monitoring area, the first three sensor nodes twenty-two intersect is the most basic form of any sensor node within the node over the other two sensors shown in Figure 1, First case: If the three circles twenty-two circumscribed, three circle circumscribed place shall stand up a hole, the hole can not be effectively covered with seamless coverage contradictory meaning of the questions, the first case is not established. Second situation: Figure 1 shows, multiple wireless sensor network is covering model, which is K=2 weight shaded cover that if three circle covered area of maximum, i.e.
0
lim sh 0
s→ S = , when Ssh=0, shown in Figure 1, because twenty-two three circles
intersect and intersect at one point A, so any two Euler equal distance between the center, connecting AO2, O O1 2 cross-connect pointO2on B, O O1 2done in vertical cross-O O1 2in ppoints, ∠ =θ p6, set bow area ofSAPB, SAPB
arch area of the triangle is equal to the SAO B2 and the fan-shaped area of the difference between SAO P2 , speaking for the whole figure 1, a total of 12 bow area, the bow area of the total area is:
( ) 2
2 2
2 2
3 2 3 3
12 12 12
12 8 2
APB AO B AO P
r
S = S −S = p − r = p− r
(11)
For the entire coverage area, the maximum value of:
2 2 2 3 3 2 2 3 3 2
3 12 3 2
2 2
APB
S= pr − S = pr −pr + r = pr + r (12)
EA Desired value for the entire network is equivalent to the ratio of S∆APO2and sectorSABO2, namely:
2 2
2 2 2
3 3 3 3
1 1 1 82.73%
2 2
APO ABO ABP ABP
ABO ABO ABO
S S S S
EA
S S S p p
∆ −
= = = − = − − = =
(13)
IMPROVED ANT COLONY ALGORITHM COVERING ALGORITHM
After analysis, we can know that when the number of ants’ increases, the number of collections and the number of elements contained in the collection is large, the algorithm complexity becomes high, and the search for a long time problem is particularly prominent. These wireless sensor network nodes will cause heavy computational burden, resulting in network bottlenecks [12-13]. Is mainly due to defects caused by : basic ant colony algorithm would choose over all subsets are updated at each cycle, which can only be fixed to select a subset of , and with the increase of the solution space , different sub- set close to each other the possibility of transition probabilities greater , which reduces the efficiency of the search results optimization , making the search behavior of ants can quickly focus on the optimal solution of the field , the corresponding increase of search time . To this end, we have made improvements on the ant colony algorithm: The initial time in a limited subset of randomly selected place ants, after each cycle, the optimal solution is only a subset of the selected ant pheromone increases, so the ants tend to choose to constitute a minimal set covering subset, thus improving the ants search capabilities. Repeated cycle of implementation what is the above process, when the number of cycles to meet the conditions, then the output of the minimum number of collections.
Algorithm is as follows:
Step 1 Initialization parameters such asa β ρ.
Step 2 NC=0(for the number of cycles), ∆t( )t and t( )t are initialized, the ants were randomly placed on a limited subset.
Step 3 ants transferred to the next according to the probability pijsubset of j, and j on the current solution set,
and add taboo table. When the solution set to meet a subset of elements containedS=SiSj, the end of this cycle.
Step 4 all the ants have completed a cycle, ants choose the optimal solution for a subset of pheromone increases. Then∆t( )j =0, NC=NC+1empty tabuklist.
Step 5 NC>NCmax,NCmax is the maximum number of cycles), exit the loop; otherwise go to Step 2.
In reality, the nodes are randomly thrown in the monitoring area. Because of the large number of nodes, each node with positioning system (GPS) is impossible. Usually only 5% -10% of the node with a positioning system can determine its own location, called the reference node. Common nodes to exchange data with the reference node estimates its own Position (the algorithm assumes that each node position information is known), thereby determining sampling points covered by the information itself, we call this stage pre-processing stage using distributed computing. Then the node itself covered sample point information is sent to the central node. Central node using the above algorithm derived approximate minimum working set of nodes to determine which nodes in
What is part by a description of the problem shows that the mesh size small enough to cover the entire area can be approximated as point coverage, but also to guarantee coverage performance. It proved that when the sensor node communication radius of Rcis greater than or equal to twice the detection radius Rs, the algorithm constructs a
cover set is able to guarantee the network connectivity; contrary can not be guaranteed. To this end, forRc<2Rs, this
paper designed a low time complexity algorithm to maintain network connectivity, as shown in Figure 2:
Fig.2 (a) non-connected Fig.2 (b) connected graph
nearest node from the Node B. For example the node C is awakened, if the Node B is still in the communication range of the node C, the node C will wake it up and away from the communication range of the node B nearest node until the node A and B can constitute a communicating. , The network connectivity of a further judgment. If there is not a set of nodes connected work, we then calculated above, until the entire network to maintain communications.
EVALUATION SYSTEM
The wireless communication models for Sensor node transmitting data and receiving data are respectively the following:
2 0 4
0 ( , ) ( , )
Tr T elec amp
T elec fs
T elec amp
E k d E k E k d
E k d k d d E k d k d d
e e −
−
−
= +
+ <
= + ≥
(14)
In the above formula, ET-elec and ER-elec denote the energy consumption of wireless transmitting module and wireless
receiving module; εfs and εamp stand for the energy consumption parameters of spatial model and multiple attenuation
models; d0 is a constant.
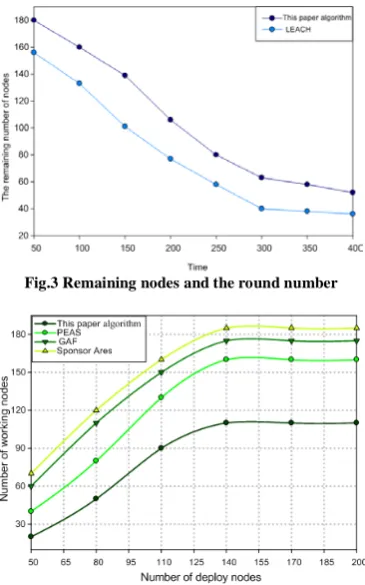
[image:6.595.215.398.326.619.2]Experiment I: The first case is, with the same respective parameters, execute 50 times and get the mean value, then execute for 400 to compare with the LEACH protocol the quantitative relationship between number of remaining nodes and the number of turns, as shown in Figure3:
Fig.3 Remaining nodes and the round number
Fig. 4 Different initial state of the working node as the curve
can ask for good coverage quality, but the work of selected nodes algorithm is almost 2 times more; rather Sponsor Area does not consider excessive overlapping coverage area nodes, leading to excessive working nodes, and as the number of nodes deployed increases. Obviously, the proposed algorithm outperforms the other three algorithms.
Fig.5 Under different algorithms work nodes curve
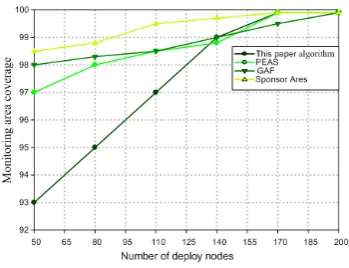
Fig. 6 Different algorithms coverage under the curve
CONCLUSION
Based on Improved Ant Colony Algorithm connected set cover algorithm is to monitor the area is divided into a number of grid points, area coverage can be approximated as point coverage, thus bringing the area coverage problem into set cover problem. Then set covering problem for the basic ant colony algorithm, an improved, is making it optimized for speed has been significantly improved, effectively overcome the slow convergence of the algorithm's defects. And the improved ant colony algorithm uses the wireless sensor network coverage control problem, at least with approximate nodes to monitor the entire area, to minimize redundant data lead to additional energy consumption and prolong the network lifetime. Also take into account network connectivity, to mention of a simple algorithm to maintain the normal transmit and receive data across the network. Finally, the simulation results show the reliability and effectiveness of the algorithm.
Acknowledgments
The authors wish to thank Science of Technology Research of Foundation Project of Henan Province Education Department under Grant Nos.2014B520099; Natural Science and Technology Research of Foundation Project of Henan Province Department of Science under Grant Nos. 142102210471, 142102210063; Natural Science and Technology Research of Foundation Project of Luoyang Department of Science under Grant Nos. 1401037A.
REFERENCES
[1] Zou Y and Charrabarty K. Ad Hoc Network v.11, n.2, pp.286-297, February, 2003. [2] Schuragers C, Tsiatsis V. IEEE Trans. Mobile computer, v.1, n.1, pp 70-80, January 2002. [3] Thomas.H Y, Shi Y. IEEE/ACM Trans. Networking, v.16, n.2, pp.321–334, February, 2008. [4] Jiang J, Fang L. Journal of Software, v.17,n.2, pp. 175-184, February, 2006.
[5]Liu L,Zou S. Journal of Beijing University of Posts and Telecommunications, V28,n4,pp.14-17,April,2005. [6]Schuragers C, Tsiatsis V. IEEE Trans. Mobile Computer, V1,n1,pp70-80,January,2005.
[image:7.595.219.394.277.411.2][9]Salcedo S, Xin Y. IEEE Transactions on Systems.V.3,n.5, pp.2343-2353, May, 2004. [10]An W, Shao F. Computer and Mathematics Applications. V.57,n.4, pp.529-539, April, 2009. [11]Thomas Y, Shi Y. IEEE Trans. Networking. V.16,n.2, pp.321-334, February,2008.