Munich Personal RePEc Archive
Patterns of welfare state indicators in the
EU: Is there convergence?
Caminada, Koen and Goudswaard, Kees and Van Vliet, Olaf
Department of Economics, Leiden University
2008
Online at
https://mpra.ub.uni-muenchen.de/20177/
Pa t t e r ns of W e lfa r e St a t e I ndica t or s in t he EU:
I s The r e Conve r ge nce ?
∗
Koen Caminada, Kees Goudswaard and Olaf van Vliet
Leiden Law School, Leiden University Department of Economics
Research program Reforming Social Security (www.hsz.leidenuniv.nl)
P.O. Box 9520, 2300 RA Leiden, The Netherlands Phone: ++31 71 527 7756
E-mail: [email protected]
E-mail: [email protected]
E-mail: [email protected]
Abst r a ct
Convergence of social protection objectives and policies in member states is an explicit objective of the EU. Earlier research has shown that there has indeed been a tendency of convergence of social protection levels over the last decades. However, comparative studies of welfare states frequently use indicators which may not be representative as measures of the level or generosity of benefits in different countries.
In this paper we have done several σ- and β-convergence tests with the most recent data, using a
variety of indicators of social protection: social expenditures, both at the macro and at the program level, replacement rates of unemployment benefits and social assistance benefits and poverty indicators. Together, these indicators provide a more broad picture of the evolution of social protection.
Our results are less clear cut than earlier findings. We still find a quite strong convergence of social expenditure in EU-countries over a longer period. However, this trend seems to have stagnated in recent years. The evidence is mixed for the other indicators. Replacement rates of unemployment benefits clearly converged to a higher level, but social assistance benefits and poverty rates do not show a trend of convergence.
JEL-codes: H53, H55
Keywords: welfare states, convergence, Europeanization, social indicators
∗ Revised version of a paper prepared for the 64th Congress of the International Institute of Public Finance,
1 . I n t r odu ct ion
Social progress has been a European objective already since the Treaty of Rome in 1957. The founding fathers of the EU believed that economic integration would promote progress in social protection across participating countries, such that convergence of social protection systems follows more or less spontaneously. In the 1990’s both the European Council and the European Commission adopted a more active convergence strategy: they proclaimed the objective of a convergence of social policies of member states and the development of common objectives of social policies. In 2000 the European Council adopted the goal that besides economic growth also social cohesion should be strengthened in the EU (the Lisbon Agenda). The open method of coordination was introduced as the means of spreading best practice and achieving greater convergence towards the main EU goals. Social indicators were developed to monitor the improvements with respect to the social cohesion. This Lisbon Agenda has renewed the interest in patterns of social protection across member states.
Earlier research has shown that there has been a tendency of rather strong convergence of social protection systems in the European Union countries over the last decades (Cornelisse and Goudswaard, 2002). However, the indicators used in earlier studies - mostly public expenditure on social benefits - may not be representative for the social security system at large. Indeed, there are several problems. Expenditure ratio’s are determined to some extent by unemployment rates and by the demographic structure in a country and thus do not fully reflect protection levels. Also, most analyses of social protection are focused on public arrangements only. But social effort is not restricted to the public domain; all kinds of private arrangements can be substitutes to public programs (Caminada and Goudswaard, 2005). Also, differences in the tax treatment of social benefits make international comparisons of social protection systems much more difficult. The OECD has done a comprehensive study on social expenditure, in which they account for private social benefits and the impact of the tax system on social expenditure (Adema, 2001; Adema and Ledaique, 2005). However, also adjusted aggregate expenditure data can only provide a rough indication of the degree of social protection offered by different welfare states. More indicators, also at the program level or at the microlevel are necessary to make an adequate comparison across countries and to test the social convergence hypothesis.
In this paper we will do several convergence tests using recent data on social protection. To that end we use a variety of social indicators: a) at the macro level: total public social expenditure and total public and private social expenditure (accounting for the impact of private arrangements and for the impact of the tax system); b) at the program level: expenditures on various social programs, including old age, disability, unemployment, health, family, active labor market programs and various other social policy areas; and c) at the individual level: replacement rates of unemployment benefits, minimum social assistance levels and poverty rates after social transfers. This poverty rate is an official EU social cohesion indicator.
The paper is organized as follows. In section 2 we discuss the Europeanization of social policies and the hypothesis of social convergence. In section 3 we introduce and discuss the welfare state
indicators used, the data and the σ and β convergence tests. Section 4 presents the results of
several cross-country analyses. Section 5 concludes the paper.
2 . Th e con ve r ge n ce h ypot h e sis
Effects of economic integration
less spontaneously. Theoretically, however, economic integration can be both beneficial and harmful to social protection systems. On the one hand, it can be argued that economic integration leads to more economic development in relatively poor countries and economic development in turn strengthens the need for an extended system of social protection as well as the opportunity to fund it (Goudswaard and Van Riel, 2004). To insure themselves against the increased dynamics of the labor market due to international economic integration, people desire higher levels of social protection (Agell, 1999: 154). On the other hand, internationalization goes along with higher mobility of production factors. An increase in migration can cause adverse selection problems: individuals who expect to be net beneficiaries will be attracted to countries with generous social programs, while net contributors are deterred by the high tax burden in these countries. This puts pressure on the generosity of social security systems, because the social expenditures rise and the tax base narrows (Sandmo, 2001). In the end, this results in convergence to lower social protection levels (Sinn, 2002). This is a standard argument for centralizing redistribution policies in an economic union, although it can be demonstrated that centralization is not an inevitable consequence (Wildasin, 1991). A second argument says that the competitive position of countries with relatively generous protection systems may be damaged through higher labor costs, especially in a single market (Sinn, 2003). Consequently, competition leads to lower standards of social policies, the so-called ‘social race to the bottom’ or ‘social dumping’ (Scharpf, 1999). This effect could even be strengthened by the fact that because of the EMU criteria, countries can only increase their competitiveness with supply-side strategies (Scharpf, 2002: 649). As a consequence, again social protection may converge to lower levels.
Social Europe
Although there are no clear signs that such a race to the bottom takes place, this is an often used argument of those who plead for harmonization of social policies in the EU. In reality, member states of the EU are still autonomous when it comes to the design and generosity of their social protection systems. Still, member states have accepted a certain degree of commitment in terms of social protection. This commitment is embodied in two recommendations accepted by the European Council in 1992. The first recommendation, of June 1992, dealt with common criteria concerning sufficient resources and social assistance in social protection systems (92/441/EEC). The second recommendation, of July 1992, explicitly addressed the “convergence of social protection objectives and policies” (92/442/EEC). The motivation was that convergence seeks to guarantee the continuation and stimulate the development of social protection within the context of the completion of the internal market. And also that member states face common problems, such as ageing of the population, unemployment, changing family structures and poverty; common objectives must act as pointers to the way social protection systems are modified to take account of these problems. The desirability of convergence of member states' policies has been reconfirmed in several reports of the European Commission, such as the White Paper on European Social Policy of 1994 and reports on Social Protection in Europe. The 1998 Employment Guidelines, as a result of the Jobs Summit in Luxembourg at the end of 1997, can partly be seen as an implementation of the convergence strategy. A main line of action in these guidelines is to improve the employability of those out of work. This reflects a change in orientation of systems of social protection: a shift towards a more active policy designed to get people into employment rather than merely transferring income to those who are out of work.
A new and important step was taken at the European Council in Lisbon 2000. For the EU the strategic goal was set for the decade ending in 2010 to become the most competitive and dynamic knowledge-based economy with sustainable economic growth and greater social cohesion. The economic and social agendas were thus explicitly coupled. To achieve these aims, the social model needs to be modernized. To ensure long-term sustainability of the social security systems in the light of the ageing process, participation rates should be increased.
under the principle of subsidiarity. It implies that member states define and evaluate common objectives and learn from each other how to best reach these objectives. Best practices are disseminated and benchmarking is used. Coordination is based on evaluation and peer pressure, but does not offer the option of sanctions. In Nice it was decided that member states should implement action plans for combating poverty and social exclusion and to define common objectives on social indicators. The indicators encompass financial poverty, income inequality, long-term unemployment, regional variation in employment rates, life expectancy and poor health. Some consider these common indicators and the national action plans for social inclusion as significant progress towards integration along the social dimension (Atkinson, 2002). Others question this form of coordination (Leibfried, 2002). At least, this new mode of governance and the Lisbon agenda in general, have renewed the debate on convergence patterns across EU member states.
Earlier findings
Over the past decades the attention for analyzing convergence of social expenditures has grown steadily. Early scholars as Wilensky (1975) show that from the 1950’s social expenditures have grown in rich countries. The hypothesis is that due to similar developments as industrialization and economic growth public expenditures on welfare of modern societies will converge. Montanari (2001: 470) called this the ‘old convergence’ hypothesis. O’Connor’s (1988) study, however, does not confirm this old convergence hypothesis empirically. She concludes that there is minimal convergence in social transfers and social expenditures among 17 countries in the period 1960-1980. When she breaks up this period to identify the effect of the oil crisis, she finds a slight convergence between 1960 and 1973 and a slight divergence between 1973 and 1980 of both indicators.
From the mid 1990’s, the central argument is that globalization and Europeanization lead to a downward convergence of social expenditures. This argument is what Montanari (2001: 470) called the ‘new convergence’ hypothesis. Empirically, scholars found no evidence supporting this hypothesis. Greve (1996) assesses the impact of European integration on social policies and he finds upward convergence of the expenditures on social protection in 12 EU-countries in the period 1980-1993. Cornelisse and Goudswaard (2002) find not only an upward convergence in social benefit expenditures, but also in gross replacement rates of unemployment benefits. Their study shows that EU-countries as well as non-EU OECD-countries converged between 1960 and 1980, but that between 1980 and 1999 only the EU-countries converged. Also Goudswaard and Caminada (2006) find a strong upward convergence in European social spending and gross replacement rates of unemployment benefits. However, the authors argue that it is too early to attribute the convergence in social expenditures to European integration. Castles (2004: 37) found for social expenditures upward convergence across 21 OECD-countries between 1960 and 1998. Whereas for social expenditures controlled for ageing and unemployment he found downward convergence in the period 1980 and 1998. Bouget (2003) divides the period 1980-1998 into three sub periods. He finds in an EU-14 sample as well as in an OECD-21 sample convergence between 1980 and 1990, divergence between 1990 and 1993 and again convergence between 1993 and 1998. Pestieau (2006) concludes that there is a limited tendency towards convergence in spending during the period 1980-2001. Adelantado and Calderón Cuevas (2006) found that European welfare states are converging towards the middle in terms of public expenditure, social protection expenditure, income inequality and the risk of poverty between 1992 and 2001. Alsasua et al (2007) show a picture of convergence across EU-member states between 1985 and 1999. Van Vliet and Kaeding (2007) found between 1991 and 2003 convergence of social expenditure controlled for unemployment and ageing across the EU, while they found divergence across seven non-EU OECD-countries. These results possibly demonstrate an effect of European integration.
3 . Re se a r ch de sign
Expenditure indicators
Most comparative and convergence studies of social protection use social expenditures as a measure of the level of social protection in different countries. We use data from the most recent OECD Social Expenditure Database (2007). This database contains aggregate and disaggregated data on social expenditures. The main social policy areas included are old age, survivors, incapacity-related benefits, health, family, active labor market programs, unemployment, housing and some others. Both cash benefits and benefits in kind are included. In this study we will perform convergence tests both at the aggregate level and at the program level. At the aggregate level, the social expenditure indicator has its limitations (Kühner, 2007). Changes in expenditure ratio’s may not be caused by policy changes, but simply by the number of beneficiaries as a result of an ageing population or changes in unemployment levels due to cyclical factors. For this reason, we will control for cyclical and demographic factors. In case the data are controlled for cyclical and demographic effects, it seems more plausible that patterns of convergence (or divergence) can be attributed to policy changes which are influenced by processes of economic integration or Social Europe. However, several methods to ‘standardize’ total social expenditures to control for changes
in welfare demand (the number of beneficiaries) are criticized because of bias.1 An attractive
method put forward in the literature by Kühner (2007: 16) is simply to include independent variables measuring the unemployment rate (for cyclical factors) and the ratio of the elderly population (for old age pensions) in respective regression estimations to control for cyclical and demographic factors.
To indicate whether it is Europeanization rather than globalization that has had any impact on the convergence of social expenditures, we include not only EU member states, but also other
OECD-countries. These non-EU OECD-countries control for the effects of globalization.2
Other problems with social expenditure as an indicator for differences in social protection across countries are related to differences in the public/private mix in the provision of social protection and differences in tax features. Adema (2001) has developed indicators that aim to measure what part of an economy’s domestic production recipients of social benefits really draw on, net total social expenditure. This requires capturing private social benefits and the impact of tax systems on social effort. For private programs to be considered ‘social’, they need to have a social purpose and
contain an element of interpersonal redistribution.3
The impact of the tax system on the social effort is threefold. In some countries cash benefits are taxable as a rule, in other countries they are not. In the former countries net social effort is less than suggested by gross spending indicators. Indirect taxation of consumption by benefit recipients is another factor that may blur the picture. When indirect taxes are higher, benefit recipients have less effective purchasing power. And thirdly, the tax system can be used for social purposes. Tax deductions (e.g. family tax allowances) replace direct expenditures in some cases. The Earned Income Tax Credit in the United States is a good example of a tax break, which has the features of a social protection program. To control for the impact of tax systems on social spending, we will use the OECD data on net social expenditure. Unfortunately, these data only cover a relatively short time period (1993-2003) and are not available for all EU member states.
1 See for example Castles (2002), Castles (2004), Clayton and Pontusson (1998), Van Vliet and Kaeding (2007).
2 It should be mentioned that European non-EU countries as Switzerland or Norway may also be influenced by European integration, for example via policy competition.
Generosity and poverty indicators
Several comparative studies of social security systems have turned to the use of replacement rates as measures of the level of benefits in different countries and therefore of the degree of social protection offered by different welfare systems (Caminada and Goudswaard, 2001 and 2002). However, also (gross) replacement rates can only be seen as limited indicators of the generosity of benefit systems (Whiteford, 1995). Some of the limitations are: 1) replacement rates are based on entitlement rules and often represent only the maximum payment available in the circumstances specified; 2) benefits are often not fully indexed, implying that benefits represent a decreasing percentage of wages; 3) not all relevant benefits may be reckoned with (such as housing subsidies or health care); and 4) taxation can blur the picture. To monitor social policy developments, one should calculate a variety of replacement rates (differentiated to e.g. social security schemes, earnings levels, family situations, duration of spells). The basic approach adopted by the OECD to measure replacement rates, is to compute the total benefit payable in a year of unemployment for
a variety of "typical" worker and household cases (e.g. OECD, 2002).4 We use the simple (i.e.
unweighted) mean of the gross replacement rates, which is taken to represent a summary measure of benefit entitlements.
The OECD also calculates net replacement rates. Unfortunately, these data are only available for a few data years (2001-2005), so we cannot use them for our time series analysis. But we do have another time series of net replacement rates, based on Cantillon et al (2004). They calculated replacement rates for the basic social benefits: net social assistance benefits, as a proportion of
average earnings.5 These figures, available for the period 1992-2001, give a good indication of the
generosity of the welfare systems at the minimum level in different countries.
Next, we use an important EU indicator for social cohesion: the at-risk-of-poverty rate after social transfers. This rate is defined as the share of persons with an equivalised disposable income below the risk-of-poverty threshold, which is set at 60 percent of the national median equivalised disposable income. For this indicator Eurostat data are available for the period 1995-2005, but not for all member states. This poverty rate reflects the extent to which welfare states offer protection against poverty, although obviously poverty rates are also influenced by other factors than welfare state programs. Finally, for a further comparison, we will also use the OECD poverty indicators: the poverty rate and the poverty gap. The OECD poverty rate is defined as the proportion of individuals with equivalised disposable income less than 50 percent of the median income. The poverty gap is the percentage difference between the average income of the poor and the 50 percent of median income poverty threshold. These OECD equity data are available from the mid-1980’s until the year 2000 (based on Förster and D’Ercole, 2005).
To compare social protection systems adequately via welfare state indicators, ideally for all indicators the same time intervals (data years) and the same countries should be covered. However, a cross-country selection on this basis generates a too small sub-sample of selected countries because of data availability. Alternatively, we made the several data as comparable as possible (data years, indicators, sub-periods), although not all countries will be incorporated for all indicators. In this way, the paper tries to obtain the best over view of patterns of convergence of social protection systems across countries.
σ- and β-convergence tests
One of the simplest methods for estimating convergence of social protection levels is using the standard deviation as a statistical yardstick. With this method it is possible to examine how the dispersion between social protection levels, or other social indicators, has changed, or how the
differences of indicators inside groups of countries are changing compared to the mean. A property of the standard deviation is that its value rises with the average value of the data set to which it is applied. To account for this, we also use the so-called coefficient of variation, defined as the standard deviation divided by the value of the mean of the corresponding data set. Cornelisse and Goudswaard (2002) apply the term relative convergence (divergence) when observing a drop (rise) in the value of the coefficient of variation and the term absolute convergence (divergence) when using the standard deviation as criterion.
This paper evaluates σ-convergence between EU-countries using several social indicators. In order
to assess σ-convergence, we take the EU average level as the basis for comparison. A decrease
(increase) of the statistical yardstick of the indicator of social protection levels indicates that the difference between countries with the highest and lowest social protection level has diminished (increased).
We also employ β-convergence tests. β-convergence implies that convergence occurs when the
regions with lower social protection levels tend to record a greater rate of growth in social
protection.6 In other words, the relatively backward regions tend to catch up with the relatively
advanced regions on the indicator of interest.
It should be noted that β-convergence has a twofold connotation, absolute and conditional
convergence.7 The absolute convergence hypothesis is usually tested for homogeneous groups of
economies such as OECD-countries, and the EU, where characteristics such as preferences and institutions are relatively similar. Therefore, we employ the absolute convergence hypothesis. We
test β-convergence on social protection levels as follows. In line with the work of Sala-i-Martin
(1996a and 1996b), we regress linearly the annual growth rate of several social protection indicators with the initial level of the social protection indicator at the beginning of the period. The
coefficient for absolute β-convergence is estimated using an ordinary least square regression model
of cross-sectional data of the following form: Yi,T = A + βXi,0 + ui (1)
The term on the left-hand side of equation (1) is the average annual growth of the social protection
indicator of country i over the time-period T. The social protection level in country i at the
beginning of the period under consideration is given by Xi,0, and ui is a disturbance term. If the
coefficient β is negative (positive), we say that there is absolute convergence (divergence) in social
protection levels across countries. A is, in absolute convergence analysis, a constant term across
countries. The gap between different countries declines at the speed of β over the time-period T.
The higher the value of β, the faster the social protection indicator in the poor region converges
toward the level of the rich one. The hypothesis to test is that coefficient β is negative.8
4 . Re su lt s
Gross public social expenditure
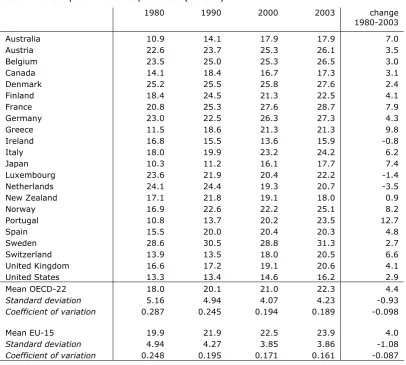
Table 1 indicates a strong σ-convergence of gross social protection expenditure, both relatively and
absolutely, especially within the European Union. Between 1980 and 2003 the standard deviation of public social spending of EU-countries declined by 22 percent, while the coefficient of variation
6 Usually, the concept of β-convergence refers to the speed at which the income per capita of a poor region approaches the level of a rich one. The ‘economic convergence literature’ is typified by the seminal papers of Barro and Sala-i-Martin (1992 and 1995), exploring β-convergence. See also Sala-i-Martin (1996a and 1996b) survey on this literature, and Quah (1993, 1996a, and 1996b) for criticism.
7 The former implies that the process of convergence can be observed regardless of other socio-economic characteristics of the regions that are compared. The observed process is defined ‘conditional convergence’ in case convergence is observed holding constant a number of other ‘conditioning’ variables (which captures other socio-economic characteristics of the regions), then. There is a debate on the appropriateness of either approach. Two articles in particular summarize the main points of the controversy; see Quah (1996b) and Sala-i-Martin (1996b).
showed a decrease by 35 percent. The EU-average level of social spending increased by 4.0 percent points of GDP in the period 1980-2003, which does not indicate a social race to the bottom. On the contrary, especially the Mediterranean countries, with rather low levels of protection in 1980, caught up rapidly in terms of social expenditure, in particular Portugal. This largely explains the rather strong social convergence in the EU. However, convergence seems to have slowed down in recent years. When other OECD-countries are included, social expenditure levels converge to a slightly lesser extent than within the EU only.
Table 1: Gross public social expenditure (% GDP)
1980 1990 2000 2003 change 1980-2003
Australia 10.9 14.1 17.9 17.9 7.0
Austria 22.6 23.7 25.3 26.1 3.5
Belgium 23.5 25.0 25.3 26.5 3.0
Canada 14.1 18.4 16.7 17.3 3.1
Denmark 25.2 25.5 25.8 27.6 2.4
Finland 18.4 24.5 21.3 22.5 4.1
France 20.8 25.3 27.6 28.7 7.9
Germany 23.0 22.5 26.3 27.3 4.3
Greece 11.5 18.6 21.3 21.3 9.8
Ireland 16.8 15.5 13.6 15.9 -0.8
Italy 18.0 19.9 23.2 24.2 6.2
Japan 10.3 11.2 16.1 17.7 7.4
Luxembourg 23.6 21.9 20.4 22.2 -1.4
Netherlands 24.1 24.4 19.3 20.7 -3.5
New Zealand 17.1 21.8 19.1 18.0 0.9
Norway 16.9 22.6 22.2 25.1 8.2
Portugal 10.8 13.7 20.2 23.5 12.7
Spain 15.5 20.0 20.4 20.3 4.8
Sweden 28.6 30.5 28.8 31.3 2.7
Switzerland 13.9 13.5 18.0 20.5 6.6
United Kingdom 16.6 17.2 19.1 20.6 4.1 United States 13.3 13.4 14.6 16.2 2.9
Mean OECD-22 18.0 20.1 21.0 22.3 4.4
Standard deviation 5.16 4.94 4.07 4.23 -0.93
Coefficient of variation 0.287 0.245 0.194 0.189 -0.098
Mean EU-15 19.9 21.9 22.5 23.9 4.0
Standard deviation 4.94 4.27 3.85 3.86 -1.08
Coefficient of variation 0.248 0.195 0.171 0.161 -0.087
Note: EU-15: Austria, Belgium, Denmark, Finland, France, Germany, Greece, Ireland, Italy, Luxembourg, the
Netherlands, Portugal, Spain, Sweden, and the United Kingdom.
Source: OECD Social Expenditure Database (OECD 2007); and own calculations
Social policy areas
market programs and on unemployment, both related to labor market developments, converged rather strongly.
Figure 1: Average gross public expenditure by social policy areas in EU15 (% GDP), 1980-2003
0 1 2 3 4 5 6 7 8 9
1980 1982 1984 1986 1988 1990 1992 1994 1996 1998 2000 2002 2003
1. old age
2. Survivors
3. Incapacity related
4. Health
5. Family
6. Active labor market programs
7. Unemployment
8. Housing
Source: see below Table 1
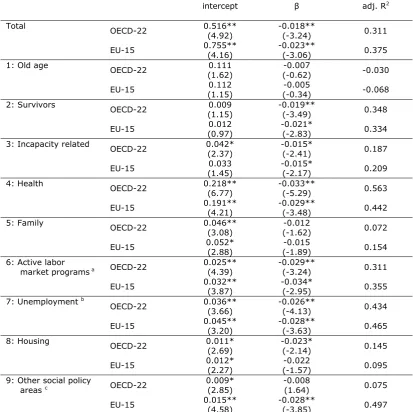
We also estimated β-convergence of public social expenditure. This is done by regressing the
annual growth of gross public social expenditure as percentage of GDP on the initial level of social
spending as percentage of GDP. The results, which are presented in Table 2, indicate a β
-convergence of 1.8 percent per year for the period 1981-2003 for OECD-22, and a β-convergence
of 2.3 percent per year for EU-15. This means that the difference of a country with respect to the OECD- or EU-average declines by 1.8 rep. 2.3 percent per year. For the EU, the functions survivors, incapacity related, health, active labor market programs, unemployment and others show
Table 2: β-Convergence of gross public social expenditure as % of GDP, 1980-2003
intercept β adj. R2
Total
OECD-22 0.516** (4.92)
-0.018**
(-3.24) 0.311 EU-15 0.755**
(4.16)
-0.023**
(-3.06) 0.375 1: Old age
OECD-22 0.111 (1.62)
-0.007
(-0.62) -0.030 EU-15 0.112
(1.15)
-0.005
(-0.34) -0.068 2: Survivors
OECD-22 0.009 (1.15)
-0.019**
(-3.49) 0.348 EU-15 0.012
(0.97)
-0.021*
(-2.83) 0.334 3: Incapacity related
OECD-22 0.042* (2.37)
-0.015*
(-2.41) 0.187 EU-15 0.033
(1.45)
-0.015*
(-2.17) 0.209 4: Health
OECD-22 0.218** (6.77)
-0.033**
(-5.29) 0.563 EU-15 0.191**
(4.21)
-0.029**
(-3.48) 0.442 5: Family
OECD-22 0.046** (3.08)
-0.012
(-1.62) 0.072 EU-15 0.052*
(2.88)
-0.015
(-1.89) 0.154 6: Active labor
market programs a OECD-22
0.025** (4.39)
-0.029**
(-3.24) 0.311 EU-15 0.032**
(3.87)
-0.034*
(-2.95) 0.355 7: Unemployment b
OECD-22 0.036** (3.66)
-0.026**
(-4.13) 0.434 EU-15 0.045**
(3.20)
-0.028**
(-3.63) 0.465 8: Housing
OECD-22 0.011* (2.69)
-0.023*
(-2.14) 0.145 EU-15 0.012*
(2.27)
-0.022
(-1.57) 0.095 9: Other social policy
areas c OECD-22
0.009* (2.85)
-0.008
(1.64) 0.075 EU-15 0.015**
(4.58)
-0.028**
(-3.85) 0.497
a: “1980” data refer to the year 1985 for Austria, Belgium, Germany, Greece, Ireland, and Norway. b: “1980” data refer to the year 1985 for Ireland.
c: “1980” data refer to the year 1985 for Denmark.
Note: OLS-regression; t-statistics in parentheses. ** Significant at the 0.01 level; * significant at 0.05 level
Source: see below Table 1
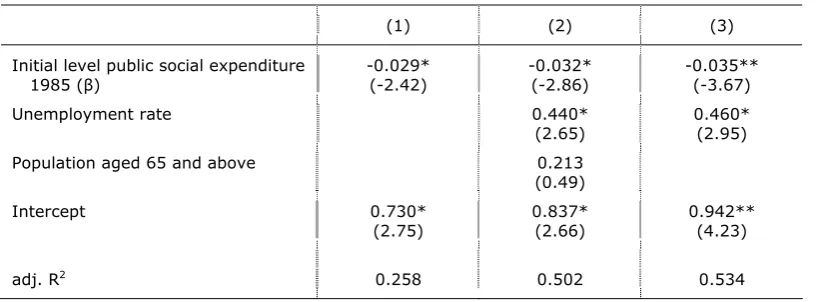
Control for cyclical and demographic effects
As discussed before, convergence of social expenditure ratio’s may simply be caused by the number of beneficiaries as result of ageing of the population or changes in unemployment levels due to cyclical factors, rather than by globalization or Europeanization. To control for these factors,
we again estimate β-convergence of gross public social expenditure by regressing the annual
change of gross public social expenditures on the initial level of gross public social expenditures (1985), the annual change of the unemployment rate (1985-2003) and the annual change of the
percentage of population aged 65 and above (1985-2003).9
The estimations are presented in Table 3. Column 1 shows the β-convergence of the EU-15. In the
second column we see that although we controlled for cyclical and demographic effects, we still find
a pretty good fit of β-convergence since the initial level of social spending is significant. Note that the coefficient of changes in the unemployment rate – as a proxy for cyclical factors - is significant,
but the effect of the percentage of population aged 65 and above does not significantly differ from
0. This means that parallel developments in the unemployment rate across countries partly explain the growth in social spending, while the ageing of populations, in contrary to what usually is assumed in the literature (Castles, 2004; Kühner, 2007), can not. These results are in line with the results of our analysis of the individual social protection programs as presented above, which show
a strong σ- and β-convergence of unemployment benefits, and divergence of public old-age
[image:12.595.65.480.236.387.2]pensions.
Table 3: β-Convergence of public social expenditures in EU-15 controlled for cyclical and
demographic effects, 1985-2003
(1) (2) (3)
Initial level public social expenditure 1985 (β)
-0.029* (-2.42)
-0.032* (-2.86)
-0.035** (-3.67)
Unemployment rate 0.440*
(2.65)
0.460* (2.95) Population aged 65 and above 0.213
(0.49)
Intercept 0.730* (2.75)
0.837* (2.66)
0.942** (4.23)
adj. R2 0.258 0.502 0.534
Note: OLS-regression; t-statistics in parentheses. ** Significant at the 0.01 level; * significant at 0.05 level
Source: (a) Gross public social expenditures: OECD Social Expenditure Database (OECD 2007);
(b) Population aged 65 and above as percentage of total population: The World Bank: World Development Indicators;
(c) Unemployment rate: the number of people unemployed as percentage of the labor force: The World Bank: World Development Indicators; Unemployment rate Germany (1985), New Zealand (1985) and Switzerland (1985): OECD Labour Force Survey;
and own calculations
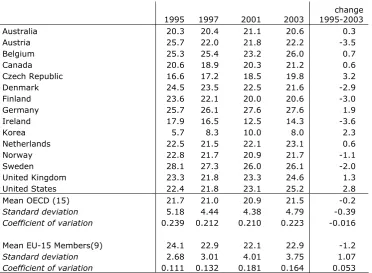
[image:12.595.77.469.236.387.2]Net total spending
Table 4: Net total social expenditure in % GDP, 1995-2003
1995 1997 2001 2003
change 1995-2003
Australia 20.3 20.4 21.1 20.6 0.3
Austria 25.7 22.0 21.8 22.2 -3.5
Belgium 25.3 25.4 23.2 26.0 0.7
Canada 20.6 18.9 20.3 21.2 0.6
Czech Republic 16.6 17.2 18.5 19.8 3.2
Denmark 24.5 23.5 22.5 21.6 -2.9
Finland 23.6 22.1 20.0 20.6 -3.0
Germany 25.7 26.1 27.6 27.6 1.9
Ireland 17.9 16.5 12.5 14.3 -3.6
Korea 5.7 8.3 10.0 8.0 2.3
Netherlands 22.5 21.5 22.1 23.1 0.6
Norway 22.8 21.7 20.9 21.7 -1.1
Sweden 28.1 27.3 26.0 26.1 -2.0
United Kingdom 23.3 21.8 23.3 24.6 1.3 United States 22.4 21.8 23.1 25.2 2.8 Mean OECD (15) 21.7 21.0 20.9 21.5 -0.2
Standard deviation 5.18 4.44 4.38 4.79 -0.39
Coefficient of variation 0.239 0.212 0.210 0.223 -0.016
Mean EU-15 Members(9) 24.1 22.9 22.1 22.9 -1.2
Standard deviation 2.68 3.01 4.01 3.75 1.07
Coefficient of variation 0.111 0.132 0.181 0.164 0.053
Source: Adema (2001), Adema and Ladaique (2005), Net Social Expenditure (2007); and own calculations
Replacement rates
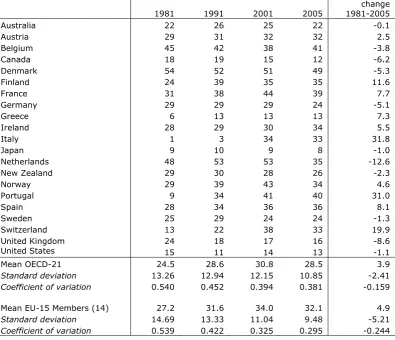
Compared to expenditure data, replacement rates are a better indicator of the generosity of welfare systems, although certainly not a perfect indicator. Table 5 shows that gross replacement rates of unemployment benefits increased on average by 4.9 points in EU in the period 1981-2005.
The figures indicate a quite strong σ-convergence of gross replacement rates, both relatively and
Table 5: Average gross replacement rates unemployment benefits, 1981-2005
1981 1991 2001 2005
change 1981-2005
Australia 22 26 25 22 -0.1
Austria 29 31 32 32 2.5
Belgium 45 42 38 41 -3.8
Canada 18 19 15 12 -6.2
Denmark 54 52 51 49 -5.3
Finland 24 39 35 35 11.6
France 31 38 44 39 7.7
Germany 29 29 29 24 -5.1
Greece 6 13 13 13 7.3
Ireland 28 29 30 34 5.5
Italy 1 3 34 33 31.8
Japan 9 10 9 8 -1.0
Netherlands 48 53 53 35 -12.6
New Zealand 29 30 28 26 -2.3
Norway 29 39 43 34 4.6
Portugal 9 34 41 40 31.0
Spain 28 34 36 36 8.1
Sweden 25 29 24 24 -1.3
Switzerland 13 22 38 33 19.9
United Kingdom 24 18 17 16 -8.6
United States 15 11 14 13 -1.1
Mean OECD-21 24.5 28.6 30.8 28.5 3.9
Standard deviation 13.26 12.94 12.15 10.85 -2.41
Coefficient of variation 0.540 0.452 0.394 0.381 -0.159
Mean EU-15 Members (14) 27.2 31.6 34.0 32.1 4.9
Standard deviation 14.69 13.33 11.04 9.48 -5.21
Coefficient of variation 0.539 0.422 0.325 0.295 -0.244
Note: A simple average of replacement rates is taken to represent a summary measure of benefit
entitlements. In all cases benefit entitlements have been estimated for two earnings levels (average earnings and two-thirds of average earnings of an Average Production Worker), three family situations (single, with dependent spouse, with spouse in work) and three durations of unemployment spells (one year, 2 to 3 years, 4 to 5 years out of work). The columns show the unweigthed averages of these replacement rates. The computations assume standard circumstances such as 40 years of age, involuntary loss of the former job, long previous work record. etc. In some countries, the long-term unemployed who have exhausted unemployment insurance (UI) have a zero replacement rate (no legislated entitlement to assistance). In countries such as the United States and Japan where entitlements fall away before 12 months and yet few workers are long-term unemployed, and Sweden where workers exhausting UI are guaranteed a short-term job on a labor market program which equalities them for UI, the summary measure is much below the initial or average benefit replacement rate of insured workers. For further details, see OECD (1994). Pre-2003 data have been revised.
Source: OECD. Tax-Benefit Models; www.oecd.org/els/social/workincentives
Also our β-convergence test implies that convergence occurs. The coefficient for absolute β
Table 6: β-Convergence of mean gross replacement rates unemployment benefits, 1981-2005
intercept β adj. R2
OECD-21 0.715** (3.97)
-0.022**
(-3.48) 0.357
EU-15 0.965** (4.67)
-0.028**
(-4.18) 0.559
Note: OLS-regression; t-statistics in parentheses. ** Significant at the 0.01 level; * significant at 0.05 level
Source: see below Table 5; and own calculations
In Table 7 we show net replacement rates of social assistance benefits. Perhaps surprisingly, welfare benefits have declined rather substantially in a number of countries: Germany, Ireland, the Netherlands, Sweden and the United Kingdom. Also average welfare benefits have fallen between 1992 and 2001. The data on the computed average of the net replacement rates of social
assistance benefits do not show a σ-convergence.
Table 7: Net social assistance as % of net disposable income at average wage level, 1992 and 2001
Couple, active Lone parent +
children, active
Couple, senior Lone parent,
senior
Computed average
1992 2001 1992 2001 1992 2001 1992 2001 1992 2001
Austria 51 51 57 61 66 70 49 53 56 59
Belgium 45 42 59 56 45 44 38 37 47 45
Denmark 49 76 76 66 108 79 59 80 73 75
France 32 32 37 37 56 57 34 34 40 40
Germany 39 34 58 53 45 34 25 24 42 36
Ireland 45 39 43 : 59 38 34 26 45 34
Luxembourg 54 61 56 57 : : : : 55 59
Netherlands 66 49 63 46 66 56 50 43 61 49
Norway 56 50 56 50 62 67 40 42 54 52
Portugal : 45 : 51 40 45 20 23 30 41
Spain : : 31 30 35 36 20 22 29 29
Sweden 72 58 70 58 83 55 76 48 75 55
United Kingdom 38 23 43 33 53 41 34 27 42 31 Mean (9) 44.8 41.5 51.9 46.0 58.4 50.3 40.5 38.8 48.9 44.2
Standard deviation 12.4 14.8 11.4 10.3 18.9 13.7 14.6 15.7 12.5 12.5
Coefficient of variation 0.28 0.36 0.22 0.22 0.32 0.27 0.36 0.41 0.26 0.28
Notes: Figures are derived from standardized calculations from national informants. They were asked to
calculate incomes, taxes and child benefits for 4 model families (single, couple, couple with 2 children, lone parents with 2 children) at different earnings levels in their countries in 1992 and 2001.
Computed average: unweigthed averages of the presented replacement rates for active couples, lone parents with 2 children, senior couples and senior lone parents.
Mean (9): Austria, Belgium, Denmark, France, Germany, Netherlands, Norway, Sweden, and the United Kingdom.
Source: Cantillon et al (2004: 33); and own calculations.
Poverty rates
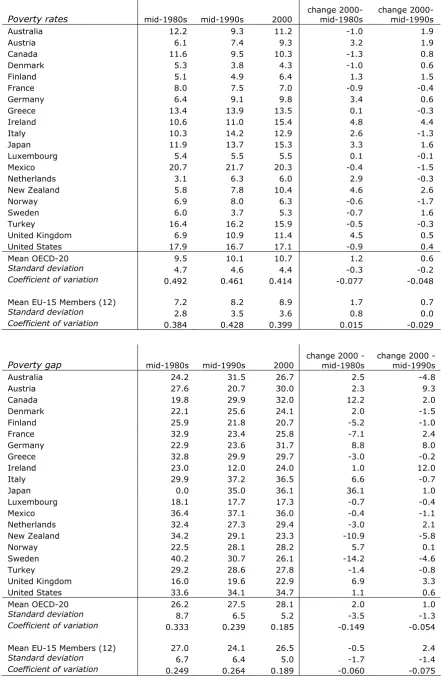
[image:15.595.76.510.345.561.2]during this period. Since the adoption of the Lisbon Agenda in 2000, poverty rates after social transfers in the EU15 show only a weak converging trend.
Using the OECD definition, poverty rates in the EU even show a rather substantial increase from the mid-1980s until 2000 (Table 9). Poverty rates rose in 75 percent of EU-countries: Austria, Finland, Germany, Greece, Ireland, Italy, Luxembourg, Netherlands, and the United Kingdom. Also, we find a divergence of poverty rates in EU-countries: both the standard deviation and the coefficient of variation have risen during this period. After including a number of other OECD-countries, we find a weak convergence trend.
The poverty gap on the other hand has on average been reduced in the EU from the mid-1980s until 2000. But the reduction of the poverty gap has been larger in OECD-countries outside the EU. Here we do find convergence, but more in the OECD than in the EU group of countries; see Table 9.
[image:16.595.71.440.288.507.2]As far as poverty is concerned, our data do neither show a uniform trend of improvement, nor a trend of convergence.
Table 8: EU at-risk-of-poverty rate after social transfers
1995 2000 2003 2005
Austria 13 12 13 12
Belgium 16 13 15 15
Denmark 10 : 12 12
Finland : 11 11 12
France 15 16 12 13
Germany 15 10 15 13
Greece 22 20 21 20
Ireland 19 20 20 20
Italy 20 18 : 19
Luxembourg 12 12 10 13
Netherlands 11 11 12 11
Portugal 23 21 19 20
Spain 19 18 19 20
Sweden : : : 9
United Kingdom 20 19 18 19
Mean EU-15 Members (14) 16.5 15.5 15.2 15.6
Standard deviation 4.11 3.90 3.66 3.85
Coefficient of variation 0.248 0.252 0.241 0.230
Note: EU-15 (14) are all EU-15 countries excluding Sweden
Table 9: OECD poverty rates and poverty gap
Poverty rates mid-1980s mid-1990s 2000
change 2000-mid-1980s
change 2000- mid-1990s
Australia 12.2 9.3 11.2 -1.0 1.9
Austria 6.1 7.4 9.3 3.2 1.9
Canada 11.6 9.5 10.3 -1.3 0.8
Denmark 5.3 3.8 4.3 -1.0 0.6
Finland 5.1 4.9 6.4 1.3 1.5
France 8.0 7.5 7.0 -0.9 -0.4
Germany 6.4 9.1 9.8 3.4 0.6
Greece 13.4 13.9 13.5 0.1 -0.3
Ireland 10.6 11.0 15.4 4.8 4.4
Italy 10.3 14.2 12.9 2.6 -1.3
Japan 11.9 13.7 15.3 3.3 1.6
Luxembourg 5.4 5.5 5.5 0.1 -0.1
Mexico 20.7 21.7 20.3 -0.4 -1.5
Netherlands 3.1 6.3 6.0 2.9 -0.3
New Zealand 5.8 7.8 10.4 4.6 2.6
Norway 6.9 8.0 6.3 -0.6 -1.7
Sweden 6.0 3.7 5.3 -0.7 1.6
Turkey 16.4 16.2 15.9 -0.5 -0.3
United Kingdom 6.9 10.9 11.4 4.5 0.5
United States 17.9 16.7 17.1 -0.9 0.4
Mean OECD-20 9.5 10.1 10.7 1.2 0.6
Standard deviation 4.7 4.6 4.4 -0.3 -0.2
Coefficient of variation 0.492 0.461 0.414 -0.077 -0.048
Mean EU-15 Members (12) 7.2 8.2 8.9 1.7 0.7
Standard deviation 2.8 3.5 3.6 0.8 0.0
Coefficient of variation 0.384 0.428 0.399 0.015 -0.029
Poverty gap mid-1980s mid-1990s 2000
change 2000 - mid-1980s
change 2000 - mid-1990s
Australia 24.2 31.5 26.7 2.5 -4.8
Austria 27.6 20.7 30.0 2.3 9.3
Canada 19.8 29.9 32.0 12.2 2.0
Denmark 22.1 25.6 24.1 2.0 -1.5
Finland 25.9 21.8 20.7 -5.2 -1.0
France 32.9 23.4 25.8 -7.1 2.4
Germany 22.9 23.6 31.7 8.8 8.0
Greece 32.8 29.9 29.7 -3.0 -0.2
Ireland 23.0 12.0 24.0 1.0 12.0
Italy 29.9 37.2 36.5 6.6 -0.7
Japan 0.0 35.0 36.1 36.1 1.0
Luxembourg 18.1 17.7 17.3 -0.7 -0.4
Mexico 36.4 37.1 36.0 -0.4 -1.1
Netherlands 32.4 27.3 29.4 -3.0 2.1
New Zealand 34.2 29.1 23.3 -10.9 -5.8
Norway 22.5 28.1 28.2 5.7 0.1
Sweden 40.2 30.7 26.1 -14.2 -4.6
Turkey 29.2 28.6 27.8 -1.4 -0.8
United Kingdom 16.0 19.6 22.9 6.9 3.3 United States 33.6 34.1 34.7 1.1 0.6 Mean OECD-20 26.2 27.5 28.1 2.0 1.0
Standard deviation 8.7 6.5 5.2 -3.5 -1.3
Coefficient of variation 0.333 0.239 0.185 -0.149 -0.054
Mean EU-15 Members (12) 27.0 24.1 26.5 -0.5 2.4
Standard deviation 6.7 6.4 5.0 -1.7 -1.4
Notes:
- Poverty rates are measured as the proportion of individuals with equivalised disposable income less than 50 percent of the median income of the entire population.
- Poverty gaps are measured as the percentage difference between the average income of the poor and the 50 percent of median income poverty threshold.
- “2000” data refer to the year 2000 in all countries except 1999 for Australia, Austria and Greece; 2001 for Germany, Luxembourg, and New Zealand; and 2002 for Mexico and Turkey; "Mid-1990s" data refer to the year 1995 in all countries except 1993 for Austria; 1994 for Australia, Denmark, France, Germany, Greece, Ireland, Japan, Mexico and Turkey; and 1996 for New Zealand; "Mid-1980s" data refer to the year 1983 for Austria, Denmark and Sweden; 1984 for Australia, France, Italy and Mexico; 1985 for Canada, Japan, the Netherlands, Spain and the United Kingdom; 1986 data for Finland, Luxembourg, New Zealand and Norway; 1987 for Ireland and Turkey; 1988 for Greece; and 1989 for the United States.
Source: OECD Equity Data based on Förster and D'Ercole (2005); and own calculations
Recapitulation
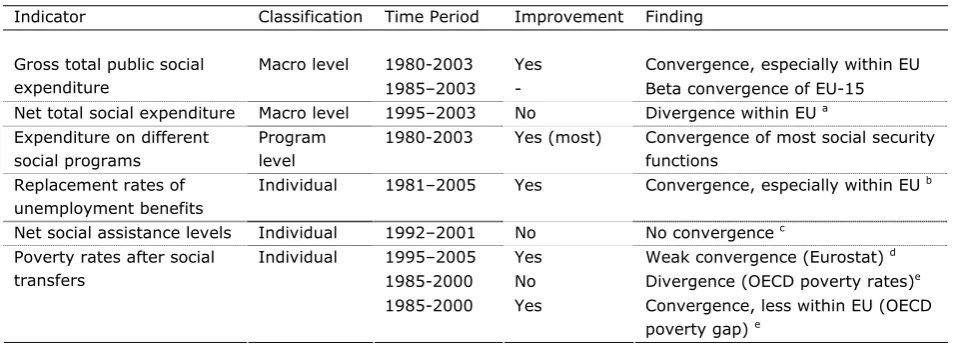
[image:18.595.64.541.368.541.2]After analysing trends in several welfare state indicators in this section, the question rises what the overall pattern looks like. As mentioned before, our analysis stretches as far as the available data allows us to. Unfortunately, because of different periods and country groups, the comparability across indicators is limited. But still, the data gives us a good impression of the dynamics in welfare state policies over the last two decades. Table 10 illustrates an overview of the results for all indicators which are included in this paper. It shows that many indicators demonstrate a converging trend, but that the overall pattern is mixed.
Table 10: Recapitulation
Indicator Classification Time Period Improvement Finding
Macro level 1980-2003 Yes Convergence, especially within EU Gross total public social
expenditure 1985–2003 - Beta convergence of EU-15 Net total social expenditure Macro level 1995–2003 No Divergence within EU a
Expenditure on different social programs
Program level
1980-2003 Yes (most) Convergence of most social security functions
Replacement rates of unemployment benefits
Individual 1981–2005 Yes Convergence, especially within EU b
Net social assistance levels Individual 1992–2001 No No convergence c
Individual 1995–2005 Yes Weak convergence (Eurostat) d
1985-2000 No Divergence (OECD poverty rates)e
Poverty rates after social transfers
1985-2000 Yes Convergence, less within EU (OECD poverty gap) e
Notes:
a EU-15 excluding France, Greece, Italy, Luxembourg, Portugal, and Spain b EU-15 excluding Luxembourg
c Countries included: Austria, Belgium, Denmark, France, Germany, Netherlands, Norway, Sweden, and the United Kingdom
d EU-15 excluding Sweden
e EU-15 excluding Belgium, Portugal, and Spain
5 . Con clu sion
Earlier research concluded that social protection levels in the EU have shown a pattern of convergence to higher levels since the early 1980s. The convergence of EU welfare states has been stronger than in other OECD-countries, indicating a specific EU trend. No empirical evidence for a race to the bottom has been found. However, the welfare state indicators used in earlier studies are difficult to compare across countries and entail various problems. In this paper we have done
several σ- and β-convergence tests with the most recent data, using a variety of indicators of social
protection: social expenditures, both at the macro and at the program level, also corrected for the impact of the tax system and for private social arrangements, replacement rates of unemployment benefits and social assistance benefits and three poverty indicators. Together, these indicators should provide a more broad picture of the evolution of social protection.
Re fe r e n ce s
Adelantado, J. and Calderón Cuevas, E. (2006) ‘Globalization and the Welfare State: The Same
Strategies for Similar Problems?’. Journal of European Social Policy, Vol. 16, No. 4, pp. 374-386.
Adema, W. (2001) ‘Net Social Expenditure: 2nd edition’. Labour Market and Social Policy -
Occasional Papers, No. 52, (Paris: OECD).
Adema, W. and Ledaique, M. (2005) ‘Net Social Expenditure, 2005 edition’, OECD Social,
Employment and Migration Working Paper, 29 (Paris: OECD).
Agell, J. (1999) ‘On the Benefits from Rigid Labour Markets: Norms, Market Failures, and Social
Insurance’. The Economic Journal, Vol. 109, No. 453, pp. 143-164.
Alsasua, J., Bilbao-Ubillos, J. and Olaskoaga, J. (2007) ‘The EU Integration Process and the
Convergence of Social Protection Benefits at National Level’. International Journal of Social
Welfare, Vol. 16, No. 4, pp. 297-315.
Atkinson, T. (2002) ‘Social Inclusion and the European Union’. Journal of Common Market Studies,
Vol. 40, No. 4, pp. 625-643.
Barro, R. and Sala-i-Martin, X. (1995) Economic Growth (Boston MA: Mc Graw Hill).
Barro, R.J. and Sala-i-Martin, X. (1992) ‘Convergence’. Journal of Political Economy, Vol. 100, No.
21, pp. 223-251.
Bouget, D. (2003) ‘Convergence in the Social Welfare Systems in Europe: From Goal to Reality’.
Social Policy and Administration, Vol. 37, No. 6, pp. 674-693.
Caminada, K. and Goudswaard, K.P. (2001) ‘International Trends in Income Inequality and Social
Policy’. International Tax and Public Finance, Vol. 8, No. 4, pp. 395-415.
Caminada, K. and Goudswaard, K. (2002) ‘Income Distribution and Social Security in an OECD
Perspective’. In: Sigg, R. and Behrendt, C. (eds.) Social Security in the Global Village,
International Social Security Series, Vol. 8 (London: Transaction Publishers).
Caminada, K. and Goudswaard, K.P. (2005) ‘Are Public and Private Social Expenditures
Complementary?’. International Advances in Economic Research, Vol. 11, No. 2, pp. 175-189.
Cantillon, B., Van Mechelen, N., Marx, I. and Van den Bosch, K. (2004) ‘De Evolutie van de
Bodembescherming in 15 Europese Landen van 1992 tot 2001’. CSB Berichten, July 2004.
Castles, F.G. (2002) ‘Developing New Measures of Welfare State Change and Reform’. European
Journal of Political Research, Vol. 41, No. 5, pp. 613-641.
Castles, F.G. (2004) ‘The Future of the Welfare State: Crisis Myths and Crisis Realities’ (Oxford:
Oxford University Press).
Clayton, R. and Pontusson, J. (1998) ‘Welfare-State Retrenchment Revisited: Entitlement Cuts,
Public Sector Restructuring, and Inegalitarian Trends in Advanced Capitalist Societies’. World
Politics, Vol. 51, No. 1, pp. 67-98.
Cornelisse, P. A. and Goudswaard, K.P. (2002) ‘On the Convergence of Social Protection Systems in
the European Union’. International Social Security Review, Vol. 55, No. 3, pp. 3-17.
Daguerre, A. and Taylor-Gooby, P. (2004) ‘Adaptation to Labour Market Change in France and the
UK: Convergent or Parallel Tracks?’. In: Taylor-Gooby, P. (ed.) Making a European Welfare State?
Convergences and Conflicts over European Social Policy (Oxford: Blackwell Publishing).
Eurostat (2007) Structural Indicators EU - Social Cohesion,http://epp.eurostat.ec.europa.eu/
Förster, M. and d'Ercole, M. M. (2005) ‘Income Distribution and Poverty in OECD Countries in the
Second Half of the 1990s’. OECD Social, Employment and Migration Working Papers, No. 22
(Paris: OECD).
Goudswaard, K. and Caminada, K. (2006) ‘Convergence of Net Social Protection Levels’, paper
prepared for the 62nd Congress of the International Institute of Public Finance, 28-31 August
2006, Paphos, Cyprus.
Goudswaard, K.P. and Riel, B. van (2004) ‘Social Protection in Europe: Do we Need More
Coordination?’. TvA / Dutch Journal of Labour Studies, Vol. 20, No. 3, pp. 236-248.
Greve, B. (1996) ‘Indications of Social Policy Convergence in Europe’. Social Policy &
Administration, Vol. 30, No. 4, pp. 348-367.
Hvinden, B. (2004) ‘The Uncertain Convergence of Disability Policies in Western Europe’. In:
Taylor-Gooby, P. (ed.) Making a European Welfare State? Convergences and Conflicts Over
European Social Policy (Oxford: Blackwell Publishing).
Kühner, S. (2007) ‘Country-Level Comparisons of Welfare State Change Measures: Another Facet of the Dependent Variable Problem within the Comparative Analysis of the Welfare
State?’..Journal of European Social Policy, Vol. 17, No. 1, pp. 5-18.
Leibfried, S. (2000) ‘National Welfare States, European Integration and Globalization: A Perspective
for the Next Century’. Social Policy and Administration, Vol. 34, No. 1, pp. 44-63.
Leibfried, S. (2002) ‘Some Background Comments on the Extension of the Open Method of
Co-ordination’. Belgisch Tijdschrift voor Sociale Zekerheid, Vol. 44, No. 3, pp. 473-479.
Martinsen, D.S. (2005) ‘The Europeanization of Welfare: The Domestic Impact of Intra-European
Social Security’. Journal of Common Market Studies, Vol. 43, No. 5, pp. 1027-1054.
Montanari, I. (2001) ‘Modernization, Globalization and the Welfare State: a Comparative Analysis
of Old and New Convergence of Social Insurance Since 1930’. British Journal of Sociology, Vol. 52,
No. 3, pp. 469-494.
O’Connor, J.S. (1988) ‘Convergence or Divergence? Change in Welfare Effort in OECD Countries
1960-1980’.European Journal of Political Research, Vol. 16, pp. 277-299.
OECD (1994) The OECD Jobs Study (Paris: OECD).
OECD (2002) Benefits and Wages. OECD Indicators, Edition 2002 (Paris: OECD).
OECD (2004) Benefits and Wages. OECD Indicators, Edition 2004 (Paris: OECD).
OECD (2006) Benefits and Wages. OECD Indicators, Edition 2006 (Paris: OECD).
OECD (2007) Social Expenditure Database 1980-2003 (www.oecd.org/els/social/expenditure);
download January 4th, 2008.
OECD. Tax-Benefit Models; www.oecd.org/els/social/workincentives
Pestieau, P. (2006) The Welfare State in the European Union: Economic and Social Perspectives
(Oxford: Oxford University Press).
Pierson, P. (2001) ‘Introduction: Investigating the Welfare State at Century’s End’. In: Pierson, P.
(ed.) The New Politics of the Welfare State (Oxford: Oxford University Press).
Quah, D.T. (1993) ‘Empirical Cross-Section Dynamics in Economic Growth’. European Economic
Review, Vol. 37, No. 2-3, pp. 426-434.
Quah, D.T. (1996a) ‘Regional Convergence Clusters Across Europe’. European Economic Review,
Quah, D.T. (1996b) ‘Empirics for Economic Growth and Convergence’. European Economic Review, Vol. 40, No. 6, pp. 1353-1375.
Sala-i-Martin, X. (1996a) ‘Regional Cohesion: Evidence and Theories of Regional Growth and
Convergence’. European Economic Review, Vol. 40, No. 6, pp. 1325-1352.
Sala-i-Martin, X. (1996b) ‘The Classical Approach to Convergence Analysis’. The Economic Journal,
Vol. 106, pp. 1019-1036.
Sandmo, A. (2001) ‘Globalisation and the Welfare State: More Inequality, Less Redistribution?’. In:
Pieters, D. (ed.) European Social Security and Global Politics (The Hague: Kluwer Law
International).
Scharpf, F.W. (1999) Governing in Europe: Effective and Democratic? (Oxford: Oxford University
Press).
Scharpf, F. W. (2002) ‘The European Social Model: Coping with the Challenges of Diversity’.
Journal of Common Market Studies, Vol. 40, No.4, pp. 645-670.
Sinn, H-W. (2002) ‘EU Enlargement and the Future of the Welfare State’. Scottish Journal of
Political Economy, Vol. 49, No. 1, pp. 104-115.
Sinn, H-W. (2003) The New Systems Competition (Oxford: Blackwell Publishing).
Taylor-Gooby, P. (2001) ‘Polity, Policy-Making and Welfare Futures’. In: Taylor-Gooby, P. (ed.)
Welfare States under Pressure (London: Sage Publications).
Vliet, O. van and Kaeding, M. (2007), ‘Globalisation, European Integration and Social Protection –
Patterns of Change or Continuity?’, Department of Economics Research Memorandum 2007.06,
(Leiden: Leiden University).
Whiteford, P. (1995) ‘The Use of Replacement Rates in International Comparisons of Benefit
Systems’. International Social Security Review, Vol. 48, No. 2, pp. 3-30.
Wildasin, D. (1991) ‘Income Redistribution in a Common Labour Market’. American Economic
Review, Vol. 81, No. 4, pp. 757-774.
Wilensky, H.L. (1975) The Welfare State and Equality: Structural and Ideological Roots of Public
D a t a
Gross public social expenditure (% GDP)
- OECD-22 and EU-15 - Data years: 1980-2003
- Source: OECD Social Expenditure Database (SOCX)
- Total - Old age
- Survivors - Incapacity-related benefits
- Health - Family
- Active labor market programs - Unemployment
- Housing - Other social policy areas
URL: www.oecd.org/els/social/expenditure
Control for cyclical and demographic effects
- OECD-22 and EU-15 - Data years: 1980-2003
- Source: The World Bank World Development Indicators and OECD Labour Force Survey
- Population aged 65 and above as percentage of total population
- Unemployment rate: the number of people unemployed as percentage of the labor force
URL: www.worldbank.org/data and www.oecd.org/std/mei
Gross and net social expenditure (% GDP)
- OECD-24, and EU-15
- Data years: 1993, 1995, 1997, 2001, and 2003
- Source: Adema (2001); Adema and Ladaique (2005); Net Social Expenditure, 2007 edition; - URL: http://www.oecd.org/dataoecd/14/23/38143827.xls;
Average gross replacement rates unemployment benefits
- OECD-22, and EU-15 - Data years: 1961-2005
- Source: OECD. Tax-Benefit Models
- URL: www.oecd.org/els/social/workincentives
Structural Indicators EU - Social Cohesion
- EU-15, and EU-25
- Data years: 1995, 2000, 2003, and 2005 - Source: Eurostat
- At-risk-of-poverty rate after social transfers
- At-persistent-risk-of-poverty rate
- URL: http://epp.eurostat.ec.europa.eu/portal/page?_pageid=1133,47800773,1133_47803970&_dad =portal&_schema=PORTAL
OECD Equity Indicators
- OECD-18/20, and EU-11/12
- Data years: mid-1980s, mid-1990s, 2000
- Source: OECD Equity Data based on Förster and D'Ercole (2005)
- Poverty
- Poverty gap
- URL: http://www.oecd.org/dataoecd/34/11/34542691.xls
Net social assistance as % of net disposable income at average wage level
- EU-13 (selection)
- Data years: 1992, and 2001
- Source: B. Cantillon, N. Van Mechelen, I. Marx, and K. Van den Bosch (2004).
Appe n dix
Table A1: Mean and σ-convergence tests of gross public expenditure by social policy areas (%
GDP), 1980-2003
1980 1990 2000 2003 change 1980-2003 Total Mean OECD-22 18.0 20.1 21.0 22.3 4.4
Coefficient of variation 0.287 0.245 0.194 0.189 -0.098 Mean EU-15 19.9 21.9 22.5 23.9 4.0 Coefficient of variation 0.248 0.195 0.171 0.161 -0.087 1. Old age Mean OECD-22 5.8 6.8 7.2 7.4 1.6
Coefficient of variation 0.340 0.332 0.362 0.378 0.039 Mean EU-15 6.3 7.5 8.1 8.2 1.9 Coefficient of variation 0.301 0.290 0.335 0.352 0.050 2. Survivors Mean OECD-22 1.1 0.8 0.8 0.8 -0.3
Coefficient of variation 0.782 0.709 0.817 0.832 0.050 Mean EU-15 1.4 1.0 0.9 1.0 -0.4 Coefficient of variation 0.691 0.655 0.766 0.762 0.071 Mean OECD-22 2.5 2.6 2.5 2.7 0.1 3. Incapacity-related
benefits
Coefficient of variation 0.580 0.543 0.462 0.505 -0.075 Mean EU-15 3.0 2.9 2.6 2.8 -0.3 Coefficient of variation 0.468 0.476 0.398 0.446 -0.022 4. Health Mean OECD-22 5.1 5.3 5.7 6.3 1.2
Coefficient of variation 0.219 0.183 0.128 0.121 -0.098 Mean EU-15 5.4 5.5 5.7 6.2 0.8 Coefficient of variation 0.219 0.181 0.146 0.144 -0.074 5. Family Mean OECD-22 1.7 1.8 2.1 2.3 0.6
Coefficient of variation 0.576 0.607 0.476 0.455 -0.121
EU-15 2.0 2.0 2.3 2.5 0.5
Coefficient of variation 0.516 0.546 0.407 0.385 -0.131 Mean OECD-22 0.5 0.7 0.7 0.7 0.2 6. Active labor
market programs
a Coefficient of variation 0.836 0.575 0.581 0.529 -0.307
Mean EU-15 0.6 0.8 0.8 0.8 0.2 Coefficient of variation 0.739 0.501 0.502 0.446 -0.293 7. Unemployment b
Mean OECD-22 1.0 1.3 1.1 1.3 0.2 Coefficient of variation 1.110 0.775 0.700 0.676 -0.434 Mean EU-15 1.2 1.5 1.3 1.5 0.3 Coefficient of variation 1.110 0.750 0.639 0.609 -0.443 8. Housing Mean OECD-22 0.2 0.3 0.4 0.4 0.1
Coefficient of variation 1.240 1.087 1.043 0.977 -0.263 Mean EU-15 0.2 0.3 0.4 0.4 0.2 Coefficient of variation 1.280 1.025 0.981 0.961 -0.319 Mean OECD-22 0.4 0.4 0.5 0.5 0.1 9. Other social policy
areas c
Coefficient of variation 1.167 1.161 1.007 0.848 -0.319 Mean EU-15 0.3 0.3 0.4 0.4 0.2 Coefficient of variation 1.217 0.803 0.615 0.500 -0.626
a: “1980” data refer to the year 1985 for Austria, Belgium, Germany, Greece, Ireland, and Norway. b: “1980” data refer to the year 1985 for Ireland.
c: “1980” data refer to the year 1985 for Denmark.
Re se a r ch M e m or a n du m D e pa r t m e n t of Econ om ics
Research Memoranda
- are available from Department of Economics homepage at : http://www.economie.leidenuniv.nl
- can be ordered at Leiden University, Department of Economics, P.O. Box 9520, 2300 RA Leiden, The Netherlands Phone ++71 527 7756 / 7855; E-mail: [email protected]
2008.05 Koen Caminada, Kees Goudswaard and Olaf van Vliet
Patterns of welfare state indicators in the EU. Is there convergence?
2008.04 Kees Goudswaard and Koen Caminada
The redistributive impact of public and private social expenditure.
2008.03 Karen M. Anderson and Michael Kaeding
Pension systems in the European Union: Variable patterns of influence in Italy, the Netherlands and Belgium.
2008.02 Maroesjka Versantvoort
Time use during the life course in USA, Norway and the Netherlands: a HAPC-analysis.
2008.01 Maroesjka Versantvoort
Studying time use variations in 18 countries applying a life course perspective.
2007.06 Olaf van Vliet and Michael Kaeding
Globalisation, European Integration and Social Protection – Patterns of Change or Continuity?
2007.05 Ben van Velthoven
Kosten-batenanalyse van criminaliteitsbeleid. Over de methodiek in het algemeen en Nederlandse toepassingen in het bijzonder.
2007.04 Ben van Velthoven
Rechtseconomie tussen instrumentaliteit en normativiteit.
2007.03 Guido Suurmond
Compliance to fire safety regulation. The effects of the enforcement strategy.
2007.02 Maroesjka Versantvoort
Een schets van de sociaal-economische effecten van verlof en de beleidsmatige dilemma’s die daaruit volgen.
2007.01 Henk Nijboer
A Social Europe: Political Utopia or Efficient Economics? An assessment from a public economic approach.
2006.04 Aldo Spanjer
European gas regulation: A change of focus.
2006.03 Joop de Kort and Rilka Dragneva
Russia’s Role in Fostering the CIS Trade Regime.
2006.02 Ben van Velthoven
Incassoproblemen in het licht van de rechtspraak.
2006.01 Jurjen Kamphorst en Ben van Velthoven
De tweede feitelijke instantie in de belastingrechtspraak.
2005.03 Koen Caminada and Kees Goudswaard
Budgetary costs of tax facilities for pension savings: an empirical analysis.
2005.02 Henk Vording en Allard Lubbers
How to limit the budgetary impact of the European Court's tax decisions?
2005.01 Guido Suurmond en Ben van Velthoven
Een beginselplicht tot handhaving: liever regels dan discretionaire vrijheid.
2004.04 Ben van Velthoven en Marijke ter Voert
Paths to Justice in the Netherlands. Looking for signs of social exclusion.
2004.03 Guido Suurmond
2004.02 Kees Goudswaard, Koen Caminada en Henk Vording Naar een transparanter loonstrookje?
2004.01 Koen Caminada and Kees Goudswaard
Are public and private social expenditures complementary?
2003.01 Joop de Kort
De mythe van de globalisering. Mondialisering, regionalisering of gewoon internationale economie?
2002.04 Koen Caminada en Kees Goudswaard
Inkomensgevolgen van veranderingen in de arbeidsongeschiktheidsregelingen en het nabestaandenpensioen.
2002.03 Kees Goudswaard
Houdbare solidariteit.
2002.02 Ben van Velthoven
Civiele en administratieve rechtspleging in Nederland 1951-2000; deel 1: tijdreeksanalyse.
2002.01 Ben van Velthoven
Civiele en administratieve rechtspleging in Nederland 1951-2000; deel 2: tijdreeksdata.
2001.03 Koen Caminada and Kees Goudswaard
International Trends in Income Inequality and Social Policy.
2001.02 Peter Cornelisse and Kees Goudswaard
On the Convergence of Social Protection Systems in the European Union.
2001.01 Ben van Velthoven
De rechtsbijstandsubsidie onderzocht. En hoe nu verder?
2000.01 Koen Caminada
Pensioenopbouw via de derde pijler. Ontwikkeling, omvang en verdeling van premies lijfrenten volgens de Inkomensstatistiek.
1999.03 Koen Caminada and Kees Goudswaard
Social Policy and Income Distribution. An Empirical Analysis for the Netherlands.
1999.02 Koen Caminada
Aftrekpost eigen woning: wie profiteert in welke mate? Ontwikkeling, omvang en verdeling van de hypotheekrenteaftrek en de bijtelling fiscale huurwaarde.
1999.01 Ben van Velthoven and Peter van Wijck
Legal cost insurance under risk-neutrality.
1998.02 Koen Caminada and Kees Goudswaard
Inkomensherverdeling door sociale zekerheid: de verdeling van uitkeringen en premieheffing in 1990 en 1995.
1998.01 Cees van Beers
Biased Estimates of Economic Integration Effects in the Trade Flow Equation.
1997.04 Koen Caminada and Kees Goudswaard
Distributional effects of a flat tax: an empirical analysis for the Netherlands.
1997.03 Ernst Verwaal
Compliance costs of intra-community business transactions. Magnitude, determinants and policy implications.
1997.02 Julia Lane, Jules Theeuwes and David Stevens
High and low earnings jobs: the fortunes of employers and workers.
1997.01 Marcel Kerkhofs and Maarten Lindeboom
Age related health dynamics and changes in labour and market status.
1996.07 Henk Vording
The case for equivalent taxation of social security benefits in Europe.
1996.06 Kees Goudswaard and Henk Vording
Is harmonisation of income transfer policies in the European Union feasible?
1996.05 Cees van Beers and Jeroen C.J.M. van den Bergh