Munich Personal RePEc Archive
On measuring indebtedness of African
countries: A stochastic frontier debt
production function
Nkamleu, Guy Blaise
2006
Afric a n De ve lo pme nt Ba nk
Ec o no m ic Re se arc h Wo rking Pape r Se rie s
On Measuring Indebtedness of African Countries:
A Stochastic Frontier Debt Production Function
Guy Blaise Nkamleu
International Institute of Tropical Agriculture (IITA)
Economic Research Working Paper
No 85 (June 2006)
Copyright© 2006
African Development Bank
African Development Bank
Angle des trois rues: Avenue du Ghana, Rue Pierre de Coubertin, Rue Hedi Nouira BP. 323
1002 Tunis Belvedere Tunisia
TEL: (+216) 71 333 511 / 7110 3450 FAX: (+216) 71 351 933
E-MAIL: [email protected]
Rights and Permissions
All rights reserved.
The text and data in this publication may be reproduced as long as the source is cited. Reproductions for commercial purposes are forbidden.
The African Development Bank disseminates the findings of work in progress to encourage the exchange of ideas about economic research and policy issues in Africa. Our main objective is to disseminate findings quickly, so we compromise and bear with presentations that are not fully polished. The papers are signed by the author(s) and should be cited and referred accordingly. The findings, interpretations, and conclusions expressed in this paper are entirely those of the author(s). They do not necessarily represent the view of the African Development Bank, its Board of Directors, or the countries they represent.
Working Papers are available online at http://www.afdb.org/
On Measuring Indebtedness of African Countries:
A Stochastic Frontier Debt Production Function
Guy Blaise Nkamleu*
Abstract
At least since the early 1990s, the problem of Africa’s debt was a recurring theme in the development debate and many suggestions for debt relief have now been implemented. However, a thorough solution is hampered by the existence of multiple ways of scaling debt. This paper provides a framework for comprehensively measuring indebtedness and gives therefore a basis for setting objective principles for debt reduction measures. The paper uses a stochastic frontier production function approach and the technical efficiency computation procedure to develop an indebtedness index for 46 African countries. The results indicate an indebtedness index across countries ranging from a minimum of 3.6 (South-Africa) to a maximum of 92 (Zambia), with an average of 69. Countries, which have experienced extended civil wars, are generally less indebted, while countries with more corrupt governments have generally contracted more multilateral debt. The paper ends by raising a number of implications for a better approach of debt management in Africa.
Résumé
Au moins depuis les années 1990, le problème de la dette africaine est un thème récurrent dans les débats sur le développement, et plusieurs propositions sur l’effacement de la dette sont aujourd’hui mises en œuvre. Cependant, les débats sont entravés par l’existence d’une multitude de façon de mesurer l’état d’endettement d’un pays. Cet article propose un cadre conceptuel permettant de mesurer complètement l’endettement, donnant ainsi une base pour mettre sur pied des principes objectifs sur lesquels pourront s’appuyer les initiatives de réduction de la dette. L’article utilise une approche par la frontière de production stochastique et la procédure de calcul des efficacités techniques pour développer un indice d’endettement pour 46 pays africains. Les résultats donnent un indice d’endettement des pays variant d’un minimum de 3,6 (Afrique du Sud) à un maximum de 92 (Zambie), avec une moyenne située à 69. Les pays ayant connu une guerre civile majeure apparaissent être relativement moins endettés, tandis que les gouvernements les plus corrompus ont généralement contracté plus de dettes multilatérales. L’étude se termine en relevant un certain nombre d’implications pour une meilleure approche de gestion de la dette en Afrique.
*
International Institute of Tropical Agriculture (IITA). I am grateful to Akin Adesina who inspired this work. Thanks are also due to Bernhard Gunter for insightful comments and valuable inputs. The views expressed and errors are solely those of the author. Comments are welcome; please send any communication directly to the author: [email protected].
Chapter I: Introduction
Foreign debt represents an important source of finance in most African countries where it supplements low savings, narrow export earnings, and thin tax bases. The main reasons for external borrowing by a sovereign country are to smooth consumption over time and to allow a country to invest more now with less of a sacrifice of current consumption. The costs of the external borrowing are supposed to be covered by the future returns from the investment. However, in Africa, much of the debt repayments have been rescheduled repeatedly, with the effect that Africa’s debt has continued to climb virtually unabated during the 1980s and early 1990s. For many African countries, the situation has been severe, with the debt overhang having a negative impact on new investment and economic growth.
The severity of a country’s debt burden is often expressed in terms of its debt servicing obligations—the repayments of principal and interest due in a given year. A common rule of thumb is that the debt service due should not exceed 25 percent of a country’s export earnings. Beginning in the mid-1970s, the debt servicing problems became both more general and more intractable. First, following the 1973 oil shock and the subsequent global recession, many African primary-producing countries encountered balance-of-payments difficulties. Then, after the sharp rise in world interest rates in the early 1980s, most middle-income countries that had borrowed from banks were unable to service their debt.
The need to resolve the debt problem overshadowed many other development issues. Thus, improving the quality of external debt management has become a vital aspect of public administration. Given the tenacity of the debt crisis and the growing recognition of its role in blocking renewed economic growth, many people have come to accept that some sort of debt relief is necessary. However, despite a variety of debt relief plans by financial institutions and individual creditor governments, the African debt has continued to climb until very recently. Tanzania for example has been spending nine times more for debt servicing than for basic health and four times more than for primary education. In Africa as a whole, where only half of the children go to school, governments transferred four times more to northern creditors in debt payments during the mid-1990s than they spent on health and education (United Nations Development Programme, 1999).
Reasons for the failure of debt relief plans in terms of their contribution to effective debt reduction, economic growth, and poverty alleviation is partly attributed to a lack of international coordination among creditors, given that various donors do not implement the same policies and may have quite different objectives. The development assistance literature has long focused on the opposition between self-interest behaviors, linking aid to post-colonialist and geopolitical motives of donors, and altruistic behaviors, relating aid to recipient needs and merits (Berthelemy, 2004).
In 1996, the World Bank and the International Monetary Fund, agreed to undertake a new comprehensive approach, called the Heavily Indebted Poor Country
(HIPC) Initiative, providing debt relief to the poorest and most indebted countries in the world. In September 1999, the international community reinforced this initiative, transforming it into the Enhanced HIPC Initiative in order to provide deeper and faster debt relief. In June 2005, the Group-of-Eight (G-8) major industrial countries proposed that three multilateral institutions—the African Development Fund (AfDF) the International Development Association (IDA) of the World Bank, and the International Monetary Fund (IMF)—cancel 100 percent of their debt claims on countries that have reached the completion point under the enhanced HIPC Initiative. This G-8 Initiative has become known as the Multilateral Debt Relief Initiative (MDRI).
The MDRI implies that creditor countries use the HIPC eligibility criteria as a way to exclude certain countries from MDRI debt relief, possibly to suit their own political interests, as they clearly existed in the past. For example, Marijke (1998) reported that, France insisted on the inclusion of its former colony, Côte d’Ivoire, by requesting the IMF and World Bank to change the HIPC eligibility rules such that Côte d’Ivoire would qualify for HIPC debt relief. In addition, NGOs have charged that debt sustainability levels are being interpreted by the World Bank and IMF so as to provide the least amount of debt relief possible and that, their interpretations is driven by their own institutional imperatives (Marijke, 1998; Kapijimpanga, 1998). While many improvements have been made in recent years, eligibility and conditionality issues still need more transparency and analysis.
A first source of divergence is rooted in the existence of multiple measures of the debt burden. Debt and debt servicing payment can be measured in its nominal form, or can be scaled against gross national product (GNP), against exports, population, resource endowment, etc., giving rise to different rankings of countries in terms of indebtedness. It is therefore important to find an objective way of gauging the indebtedness of African countries, in order to be able to identify the countries that need debt relief. The objective of this paper is to determine an indebtedness index of African countries based on an international comparable macroeconomic dataset. The paper uses a stochastic frontier production function approach and the technical efficiency computation procedure to develop such an indebtedness index.
The rest of the paper is organized as follows: Chapter II presents the general theoretical concepts underlying the stochastic frontier approach used in the paper. The third chapter discusses the empirical results, and the last chapter presents conclusions and implications of the study. An annex provides some details on the data used in this study.
Chapter II: Analytical Approach
The stochastic production frontier model was independently proposed by Aigner, Lovell and Schmidt (1977) and Meeusen and van den Broeck (1977). The original specification involved a production function for cross sectional data with an error term with two components: one to account for random effects and another to account for technical inefficiency. The model specification has been extended to accommodate different
distributional assumptions for the inefficiency term, for panel data, and for time-varying technical efficiencies.
Empirical results are obtained by using the stochastic frontier production model with time-varying inefficiency effects, proposed by Battese and Coelli (1993). Our starting point is a supposed debt production function. Suppose that the total debt stock facing a country is a function of country’s characteristics and performance. This implies that with an appropriate functional form, the total debt stock of each country and each year can be directly forecasted.
The debt frontier production function can then be defined as the curve of maximum debt stock attainable by a country with a given set of characteristics. The notion of debt index introduced in this paper is directly related to the classical notion of technical efficiency, and can be defined as the ratio of a country’s actual debt stock to the technically maximum possible debt stock at the given level of characteristics.
Adapting from the standard stochastic production frontier, our debt stochastic production function is written as:
4 ,..., 1 ; 46 ,..., 1 ) ; ( )
(Y = f X +v −u i= t=
Ln it it β it it (Eq. 1)
Where Yit is the debt stock of the i-th country in time period t, Xit is an N*1 vector of the logarithm of characteristics of the i-th country in time period t, β is a vector of unknown parameters. vit are random variables, which are assumed to be iid N(0, σ2v), and uit is a non-negative random variable distributed iid N(ηit, σ2u), associated with technical inefficiency across units. In our case, it accounts for heterogeneity across countries that can cause departures from maximum potential debt stock. vit and uit are assumed to be independent of each other.
The ratio of observed debt stock relative to its potential maximum debt is used to define the indebtedness index (Dit) for the i-th country in period t.
] exp[ ] ) ; (
exp[ it it
it it u v x f Y
D = −
+ =
β (Eq. 2)
This measure of indebtedness index takes on value of zero to one, with a value of one indicating maximum indebted situation. It can also be thought of as indicating the size of the debt stock of the i-th country at time t relative to the debt generated by a fully indebted country having the same characteristics.
The expected value of country-specific inefficiency term “ui” is defined by following Jondrow et al. (1982) as the conditional mean of ui , given “εi = vi - ui”
i i i i v u i i u F f u
E ] ˆ
) ( 1 ) ( [ )] ( − = − = σ λ ε σ εσ ε σ σ σ ε (Eq. 3)
where σ, σu , and σv are the standard errors of ε, u, and v, respectively, λ defined as the ratio of standard errors in non-symmetric to standard errors in symmetric disturbances (λ =
σu/σv). And σ = (σu2 + σv2)1/2 and f(.) and F(.) are the standard Gaussian density function and the cumulative distribution function, respectively, both evaluated at ‘εi/σ’.
A number of empirical studies (Nkamleu, 2004; and Nyemeck, Sylla, Diarra and Nyambi, 2003) have estimated stochastic frontiers and predicted firm-level efficiencies using these estimated functions, and then regressed the predicted efficiencies upon firm-specific variables in an attempt to identify some of the reasons for differences in predicted efficiencies between firms in an industry. But the two-stage estimation procedure has also been long recognized as one, which is inconsistent in its assumptions regarding the independence of the inefficiency effects in the two estimation stages (Coelli, 1996). From a recent development, the frontier methodology now lends itself to the inclusion of potential determinants of country heterogeneity, which is referred as “inefficiency effects”. We follow Battese and Coelli (1995) and specify a frontier model where the technical inefficiency effects are defined to be an explicit function of country-specific institutional and sociopolitical factors that we hypothesized to influence country’s indebtedness index.
The technical inefficiency effect uit for the i-th country at the t-th period as stated above has a truncated iid N(ηit, σ2u), where the mean is:
δ
ηit = zit , (Eq. 4)
where δ is an 1×p vector of parameters to be estimated. And zit is a p×1 vector of variables which may influence the indebtedness index of a country. As described in more details in the Annex, the variables considered include geographical location, colonial heritage, political rights and civil liberties, and experience of conflict. The Battese and Coelli (1995) technical inefficiency effects model will be used to simultaneously investigate indebtedness measures and factors, which may explain differences in index levels between countries.
Chapter III: Results
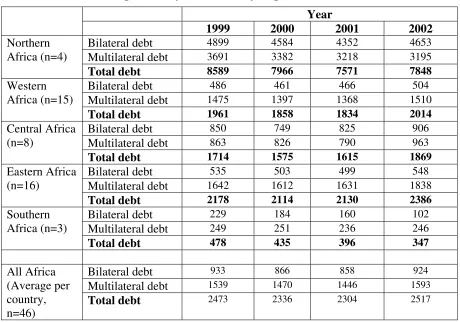
Almost all African countries are facing huge external debts as highlighted in Table 1. In this analysis, we are focusing on two main forms of debts: multilateral claims and official bilateral loans. Other types of external debt such as direct bank loans and non-bank trade credits are not considered in this paper. From Table 1, it is clear that both multilateral and bilateral loans are large. In 2002, the average debt stock per country was slightly over US$2.5 billions. Compared to other geographical regions in Africa, by large, countries in the Northern part of the continent have a greater debt stock. The average debt
of the four Northern African countries surpassed US$8.5 billion in 1999. This was over four times greater than average for the 15 West African countries.
[image:9.612.70.530.237.559.2]To determine the influence of country’s characteristics on the debt stock, a Cobb-Douglas function was estimated with panel data. The dependent variable is the nominal sum of multilateral and bilateral debt for each country for the years 1999–2003. Ordinary least square (OLS) estimates of the debt production function parameters are presented in Table 3, while descriptions of the variables included as independent variables are given in Table 2. The adjusted R-squared indicates that the fitted regression equation explain 74 percent of the variation in country’s debt stock.
Table 1: Average Country Debt Stock by Region (in millions of US dollar) Year
1999 2000 2001 2002
Bilateral debt 4899 4584 4352 4653
Multilateral debt 3691 3382 3218 3195
Northern Africa (n=4)
Total debt 8589 7966 7571 7848
Bilateral debt 486 461 466 504
Multilateral debt 1475 1397 1368 1510
Western Africa (n=15)
Total debt 1961 1858 1834 2014
Bilateral debt 850 749 825 906
Multilateral debt 863 826 790 963
Central Africa (n=8)
Total debt 1714 1575 1615 1869
Bilateral debt 535 503 499 548
Multilateral debt 1642 1612 1631 1838
Eastern Africa (n=16)
Total debt 2178 2114 2130 2386
Bilateral debt 229 184 160 102
Multilateral debt 249 251 236 246
Southern Africa (n=3)
Total debt 478 435 396 347
Bilateral debt 933 866 858 924
Multilateral debt 1539 1470 1446 1593
All Africa (Average per country, n=46)
Total debt 2473 2336 2304 2517
Source: “Joint BIS - IMF - OECD - World Bank Statistics on External Debt”
As shown in Table 3, the total debt stock of African countries is positively but not significantly associated with the population size. We found a positive and significant effect of value added in the agricultural sector, while the value added in services had a negative effect. This implies that the more the services sector is developed the lower the debt stock will be ceteris paribus. The results on agricultural sector imply that an increase of the value added in the agricultural sector is associated with an increase in total debt. This is a bit deceiving result giving the central role of the agricultural sector in the development process of African countries. Another important determinant of nominal
debt stock is the value of export of goods and services. The positive sign of its coefficient suggest that the more the country will export, the more the debt stock will be. This translates the fact that debt is mostly given to those who have means to easily reimburse. However, some of these independent variables may be regarded as endogenous if they bear a two-way relationship with the dependent variable. In this model, all independent variables included are considered exogenous.
Table 2: Descriptive Statistics of Variables Used in the Debt Production Function
Description Mean Minimum Maximum Std. Deviation
POPTOT Population size 17909297 145000 132785000 23477521
AGVALUE Value added in agriculture
(current US$)
2094088301 9386910 16604404190 3243351033
INDVALUE Value added in
industry(current US$)
3839138622 7925571 40697172900 8383497046
SERVALUE Value added in
services(current US$)
5861468168 29043384 85876932960 13770799815
GCAPFOR Gross capital
formation(current US$)
2310632106 13361026 20826991220 4390443598
EXPORT Export of good and
services(current US$)
3534422648 15367706 36588830500 6779605559
FDI Foreign direct
investment(current US$)
287028323.70 200000 7270300000 692971262.16
Table 3: Parameter Estimates for Cobb Douglas Debt Production Function Coefficient Std. Error t-ratio P-value
ONE -5.448 0.682 -7.989 0.000 ***
LPOPTOT 0.151 0.098 1.541 0.123
LAGVALUE 0.584 0.104 5.598 0.000 ***
LINDVALUE -0.110 0.124 -0.888 0.375
LSERVALUE -0.182 0.109 -1.666 0.096 *
LGCAPFOR -0.075 0.120 -0.622 0.534
LEXPORT 0.256 0.105 2.427 0.015 ***
LFDI 0.039 0.039 1.001 0.317
R-square = 0.74; Number of cross-sections = 46; Number of time periods = 4; LogL = -153.16
As shown in the recent literature on the determinants of aids (Svensson, 1999 and Berthelemy, 2004), aid is driven by both donor’s interests and recipients’ needs. We were expecting to see a negative effect of foreign direct investment on debt stock, but this was not the case. This lack of significance may be pointing out a weak absorptive ability of African countries. As pointed out by Li and Liu (2005) the beneficiary effects of foreign direct investment (FDI) are generally stronger in those countries with a higher level of institutional capability.
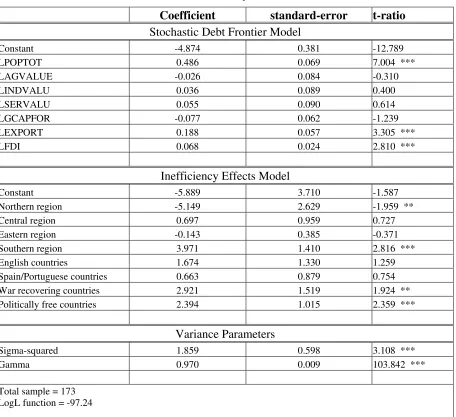
A frontier debt production function was estimated with panel data for 49 countries and five time periods using FRONTIER 4.1 (see Coelli, 1996). This frontier indicates for
[image:10.612.87.532.398.545.2]each country, given its characteristics (gross domestic product, population, etc.) the maximum debt stock attainable.
Table 4: Maximum Likelihood Estimates for the Parameters of the Stochastic Debt Frontier and the Inefficiency Effects Models
Coefficient standard-error t-ratio
Stochastic Debt Frontier Model
Constant -4.874 0.381 -12.789
LPOPTOT 0.486 0.069 7.004 ***
LAGVALUE -0.026 0.084 -0.310
LINDVALU 0.036 0.089 0.400
LSERVALU 0.055 0.090 0.614
LGCAPFOR -0.077 0.062 -1.239
LEXPORT 0.188 0.057 3.305 ***
LFDI 0.068 0.024 2.810 ***
Inefficiency Effects Model
Constant -5.889 3.710 -1.587
Northern region -5.149 2.629 -1.959 **
Central region 0.697 0.959 0.727
Eastern region -0.143 0.385 -0.371
Southern region 3.971 1.410 2.816 ***
English countries 1.674 1.330 1.259
Spain/Portuguese countries 0.663 0.879 0.754
War recovering countries 2.921 1.519 1.924 **
Politically free countries 2.394 1.015 2.359 ***
Variance Parameters
Sigma-squared 1.859 0.598 3.108 ***
Gamma 0.970 0.009 103.842 ***
Total sample = 173 LogL function = -97.24
*** = Significant at 1 percent; ** = Significant at 5 percent; * = Significant at 10 percent. Source: Model results
The computed value of Gamma 2 2 0.97
2
= + =
v u
u σ σ
σ
γ is shown in Table 4 and is
interpreted to be an indicator of the relative variability of the two sources of random error. As γ approaches zero, the relative variation implies that σu approaches zero and/or σv approaches infinity, and this indicates that the symmetric error “vi” dominates in the determination of the sum of error ‘ε’. This means that the discrepancy between the observed
and the frontier debt stock for a given country is primarily due to random factors beyond the control of the country. Similarly, when the coefficient γ becomes large, the discrepancy between the observed and the frontier output is mainly the result of heterogeneity across countries that can cause departures from maximum potential debt stock. The value of γ is significant at 1 percent. This means that the technical inefficiency (ut), representing the degree of “failure” to produce the maximum debt from a given set of characteristic plays a substantial and statistically significant role.
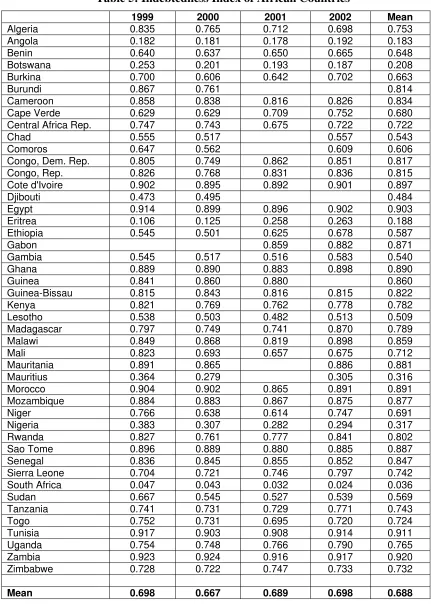
The indebtedness indices were measured for each country and each year. The results are presented in Table 5. Over the period 1999–2002, the mean indebtedness index of African countries was 68.8. However, countries did not have the same performance in attracting (or preventing) debts. Some countries such as Zambia or Egypt have an indebtedness index greater than 90, while Angola for example has an index which is less than 20. Recall that the index represents the ratio of current debt stock relative to the potential maximum debt. Hence, an index of 100 indicates a maximum indebtedness situation for a given country. These results highlight the extent to which efforts are needed to target the reduction of African debt.
Parameter estimates for the stochastic frontier and technical efficiency effects model show that systematic technical inefficiency effects exist and that these are, in part, explained by the variables included in the model. The parameter estimates for the inefficiency model presented in Table 4 only indicates the direction of the effects these variables have upon indebtedness indexes (where a negative parameter estimate shows that the variable has a positive effect on indebtedness index). Four variables in the inefficiency model have a significant impact on indebtedness index. The coefficient for Northern region was significant and negative, implying that countries in the Northern part of the continent are more efficient in contracting debts (or less efficient in preventing debts) than West African countries (Variable for Western region is used here as base). Contrary, it appears that countries from the Southern part of the continent have a relative lower indebtedness index. The positive sign of the coefficient of “war recovering countries” suggests that non-war countries are more indebted than war recovering countries. This can be explained by the fact that countries, which have experienced a major civil war in the course of the last two decades, have long constituted a major risk for investments and loans.
Finally, we also found a negative relationship between politically free countries and indebtedness. Countries rated “politically free” by Freedom House are relatively less indebted. This is a result with very important implications and corroborates the findings of Svensson (1999). It suggests that, either democratic countries are relatively well managed, and are successfully preventing themselves from debt, or it may indicate that creditors are more interested to give credit to dictatorial governments rather than democratic governments. It has been demonstrated that long-run growth impact of aid is conditional on the degree of political and civil liberties in the recipient country (Svensson, 1999). Aid has a positive impact on growth in more democratic countries. This suggests that in searching solutions to African debt crisis, an important step will be to answer the question “who gives credit to whom and why” (Alesina and Dollar, 2000).
Table 5: Indebtedness Index of African Countries
1999 2000 2001 2002 Mean
Algeria 0.835 0.765 0.712 0.698 0.753
Angola 0.182 0.181 0.178 0.192 0.183
Benin 0.640 0.637 0.650 0.665 0.648
Botswana 0.253 0.201 0.193 0.187 0.208
Burkina 0.700 0.606 0.642 0.702 0.663
Burundi 0.867 0.761 0.814
Cameroon 0.858 0.838 0.816 0.826 0.834
Cape Verde 0.629 0.629 0.709 0.752 0.680
Central Africa Rep. 0.747 0.743 0.675 0.722 0.722
Chad 0.555 0.517 0.557 0.543
Comoros 0.647 0.562 0.609 0.606
Congo, Dem. Rep. 0.805 0.749 0.862 0.851 0.817 Congo, Rep. 0.826 0.768 0.831 0.836 0.815 Cote d'Ivoire 0.902 0.895 0.892 0.901 0.897
Djibouti 0.473 0.495 0.484
Egypt 0.914 0.899 0.896 0.902 0.903
Eritrea 0.106 0.125 0.258 0.263 0.188
Ethiopia 0.545 0.501 0.625 0.678 0.587
Gabon 0.859 0.882 0.871
Gambia 0.545 0.517 0.516 0.583 0.540
Ghana 0.889 0.890 0.883 0.898 0.890
Guinea 0.841 0.860 0.880 0.860
Guinea-Bissau 0.815 0.843 0.816 0.815 0.822
Kenya 0.821 0.769 0.762 0.778 0.782
Lesotho 0.538 0.503 0.482 0.513 0.509
Madagascar 0.797 0.749 0.741 0.870 0.789
Malawi 0.849 0.868 0.819 0.898 0.859
Mali 0.823 0.693 0.657 0.675 0.712
Mauritania 0.891 0.865 0.886 0.881
Mauritius 0.364 0.279 0.305 0.316
Morocco 0.904 0.902 0.865 0.891 0.891
Mozambique 0.884 0.883 0.867 0.875 0.877
Niger 0.766 0.638 0.614 0.747 0.691
Nigeria 0.383 0.307 0.282 0.294 0.317
Rwanda 0.827 0.761 0.777 0.841 0.802
Sao Tome 0.896 0.889 0.880 0.885 0.887
Senegal 0.836 0.845 0.855 0.852 0.847
Sierra Leone 0.704 0.721 0.746 0.797 0.742
South Africa 0.047 0.043 0.032 0.024 0.036
Sudan 0.667 0.545 0.527 0.539 0.569
Tanzania 0.741 0.731 0.729 0.771 0.743
Togo 0.752 0.731 0.695 0.720 0.724
Tunisia 0.917 0.903 0.908 0.914 0.911
Uganda 0.754 0.748 0.766 0.790 0.765
Zambia 0.923 0.924 0.916 0.917 0.920
Zimbabwe 0.728 0.722 0.747 0.733 0.732
Mean 0.698 0.667 0.689 0.698 0.688
A simple correlation between indebtedness and corruption indices from Transparency International shows clearly that corrupt countries are significantly more indebted (Table 6). The limited data availability for corruption prevents us from using this variable in the estimation model. However, we can see from Table 6 that based on the Pearson correlation of different debt categories and the corruption index that multilateral creditors seem to provide more loans to corrupt countries than other creditors, with the World Bank, the African Development Bank Group, and the IMF being the three major multilateral creditors. Hence, the results suggest that part of the money received from these institutions might have been used to satisfy government’s own non-productive goals.
Table 6: Pearson Correlation of Debt versus Corruption Indexes
Bilateral debt Multilateral
debt
Total debt Indebtedness index Corruption index (from
Transparency
International) -0.024 -0.29 *** -0.139 -0.229 **
The indebtedness index for selected institutional variables shown in Table 7 confirms the results of the econometric model and stresses the potential role of institutional and socio-political factors on debt contraction. Table 8 provides the ranking of the countries in terms of their indebtedness status and gives another insight of the debt situation of African countries. The ranking shows clearly that the most indebted countries are not necessarily those with higher nominal debt stock.
Table 7: Average Country Level for Selected Variables
Countries Indebtedness index
Political Freedom
Not-Free 0.70
Partly Free 0.73
Free 0.54
Geographical location
North-Africa 0.86
Western Africa 0.72
Center Africa 0.70
Eastern Africa 0.69
Southern Africa 0.25
Colonial heritage
Former French colonies 0.75
Former English colonies 0.61
Former Spain/Portuguese colonies 0.69
Countries that have experienced a major war
Non-War 0.71 War 0.62
[image:14.612.158.463.429.715.2]Table 8: Ranking of African Countries According to Indebtedness Status
Ranking (from more to less indebted)
Using per capita debt stock
Using debt stock relative to GDP
Using our indebtedness index
1 Gabon Sao Tome Zambia
2 Sao Tome Guinea-Bissau Tunisia
3 Cape Verde Malawi Egypt
4 Tunisia Burundi Cote d'Ivoire
5 Congo, Rep. Sierra Leone Morocco
6 Zambia Zambia Ghana
7 Mauritania Mozambique Sao Tome
8 Cote d'Ivoire Mauritania Mauritania
9 Djibouti Congo, Dem. Rep. Mozambique
10 Guinea-Bissau Ghana Gabon
11 Morocco Gambia Guinea
12 Ghana Togo Malawi
13 Senegal Mali Senegal
14 Mauritius Rwanda Cameroon
15 Lesotho Congo, Rep. Guinea-Bissau
16 Gambia Madagascar Congo, Dem. Rep.
17 Guinea Niger Congo, Rep.
18 Comoros Comoros Burundi
19 Malawi Guinea Rwanda
20 Egypt Central Africa. Rep Madagascar
21 Mozambique Lesotho Kenya
22 Cameroon Chad Uganda
23 Togo Ethiopia Algeria
24 Zimbabwe Senegal Tanzania
25 Botswana Uganda Sierra Leone
26 Algeria Cote d'Ivoire Zimbabwe
27 Sierra Leone Cape Verde Togo
28 Benin Tanzania Central Africa. Rep
29 Mali Benin Mali
30 Madagascar Kenya Niger
31 Central Africa. Rep Burkina Cape Verde
32 Kenya Djibouti Burkina
33 Rwanda Cameroon Benin
34 Burundi Zimbabwe Comoros
35 Uganda Gabon Ethiopia
36 Chad Eritrea Sudan
37 Tanzania Tunisia Chad
38 Niger Sudan Gambia
39 Congo, Dem. Rep. Morocco Lesotho
40 Sudan Egypt Djibouti
41 Burkina Nigeria Nigeria
42 Angola Algeria Mauritius
43 Ethiopia Angola Botswana
44 Eritrea Mauritius Eritrea
45 Nigeria Botswana Angola
46 South Africa South Africa South Africa
Chapter IV: Conclusion and Policy Implications
Throughout the 1990s, the problem of African country’s debts was a recurring theme in international debate. Earlier, the aid-saving debate focused on past models that set foreign aid as an engine of growth. Growing critics of these models have argued that foreign aid substitutes domestic resources through declined savings, reduced government tax revenue and increased government consumption (Njeru, 2003). With regard to the growth effects of foreign aid, the literature is far from a consensus (Butkiewicz and Yanikkaya, 2005). In their study of the effects of IMF and World Bank lending on economic growth, Butkiewicz and Yanikkaya (2005) found that IMF lending has negative effects on growth, while there is evidence that Bank lending increases growth in some cases. Today, it is more and more accepted that debt crisis plays an important role in blocking economic growth and human development and many debates are taking place on strategies for debt relief. For decades, several debt relief initiatives have been undertaken primarily by bilateral and commercial creditors, but did not significantly lower African’ debt burden.
The ongoing MDRI represents a step forward in the international community’s efforts to achieve long-term debt sustainability in the eligible HIPCs, most of which are African countries. However, according to Matthew (2004), judging whether developing country debt is sustainable involves four sets of issues: the way to measure debt burdens; the types of debt to include in the measurement; the way to judge payment capacity; and the thresholds to set to judge debt sustainability. Three elements are usually suggested for measuring debt burdens: (i) debt stock – the nominal amount of debt owed by a country; (ii) debt service – the annual amounts payable on the debt; (iii) the present value (PV) of debt – future debt service aggregated based on its cost in today’s money (Matthew, 2004).
The existence of multiple ways of scaling debt demonstrates that there is need for an objective unanimous measure, as each creditor can deliberately chose to use a measure that serves its interest. Discussion is often hampered by lack of empirically based objective criteria for an efficient and pro-development debt reduction measures. For example, according to United Nation (1996), the Paris Club tends to favor the low-income countries, while commercial bank rescheduling committees accord their best terms to middle-income debtors. The absence of equitable burden-sharing procedures can inhibit creditor participation in debt reduction exercises, since no creditor wants to see its debt portfolio reduced in a way that aids other creditors. It is also well known that colonial connection, commercial interests, and the recipients’ political and ideological orientations account for the differences in donor support to individual countries and for the changes over time in a given donor’s support for particular recipients (Barro and Lee, 2002). This paper provides a framework for scaling debt stock and gives a basis for setting clear principle for debt reduction measures.
Using a stochastic frontier debt production function and panel data of 46 countries over a four-year period (1999–2002), the indebtedness index for African countries has
been estimated and its variation explained using variables representing a number of institutional, sociopolitical and geographical factors. Our findings show an average indebtedness index of 69, with a minimum of 3.6 (South Africa) and a maximum of 92 (Zambia). This indicates the extent of effort that needs to be put in place to resolve the debt problem. The estimated indebtedness index was used to rank countries in order to have a clear picture of the indebtedness situation of different countries. This constitutes an important indicator that could help creditors and debtors’ countries to formulate and implement appropriate debt management policies.
A serious question that emerges today is whether the relief provided under the HIPC initiative should be sufficient for HIPCs to embark on a path of sustainable debt. As stated by Gilman and Mitchell (2004), a country’s long-term debt sustainability depends not only on (i) the existing stock of debts and its associated debt service, but also on (ii) the evolution of a country’s fiscal and external repayment capacity, as well as on (iii) the growth and terms of new borrowing. The HIPC initiative deals only with the first of these elements by providing a one-time debt reduction, but this is not an ongoing guarantee of debt sustainability. The other two elements fall beyond the initiative’s scope and more under the responsibility of HIPC government and their creditors. It can easily be imagined that the causes that have brought African countries into this debt problem, will do the same after HIPC and MDRI debt relief, if not properly addressed. Clearly, canceling only the existing debt stock is not a comprehensive solution to the problem of African debt, as this takes care only of the symptoms of the disease but not the cause of the disease. Hence, a more comprehensive solution towards long-term debt sustainability will have to also tackle its determinants.
The results of this paper identify some relevant factors. We found that the indebtedness across countries and regions vary greatly, reflecting different country conditions, institutions, and politico-historical factors. In particular, our results indicate that the geographical location, military instability, civil liberty, and corruption level have a significant impact on a country’s indebtedness. These results have three important implications for policy targeting.
First, countries recovering from war appear to be (in the average) less indebted than non-war countries. This is not necessarily surprising as war countries constitute a major risk and are generally excluded from international support. However, the huge needs during the postwar reconstruction might expose them to an excessive indebtedness. There is therefore need for early assistance in the management of internal resource and external loans in these countries.
Second, we also found countries rated ‘politically free’ to be relatively less indebted. On the other hand, we found a positive correlation between indebtedness situation and corruption indexes, evidencing that corrupt countries are more indebted. This corroborates other recent findings and restated that bad governance is a main driving force of indebtedness in Africa. Beyond the short-term targets by the HIPC initiative, sustainable measures should be put into place by both debtors and creditors to ensure that the debt problem does not recur in the future. In this regard, particular attention should be
given to dictatorial countries and countries with bad governance systems. In this regard, the following issues should be considered: (a) encourage these countries to establish and/or enforce laws that regulate borrowing and prevent the accumulation of unsustainable debt; (b) parliaments of debtor countries (as well as of the creditor countries) should take a more active role in approving loans; and (c) civil society involvement could also be considered in monitoring loans to ensure that financial resources are being appropriately used. Multilateral debts were identified to be more correlated to corrupt countries than with other creditors. Given that the World Bank, African Development Bank Group, and the IMF are the three major multilateral donors, this result should draw attention to these institutions’ loan eligibility policies as well as these institutions’ role in promoting good governance in Africa.
Third, the paper also highlights regional difference in terms of indebtedness. It appears that the three countries from the Southern part of the continent (dominated by South Africa) have a relatively lower indebtedness than the Northern African countries. This gives a clear picture of the geography of indebtedness in Africa. These regional differences have implications on the type and extent of interventions needed in each region and should guide future interventions by development agencies.
Globally, our findings restated the fact that efforts are needed not only from within the countries and regions, but also from the international community to ensure that the right mixture of policies are put in place to tackle debt crisis in Africa. However, debt management has several facets. Policymakers of different countries must also be able to calculate the debt supporting capacity of their country through realistic appraisal of export capacity. They must also account for what are the appropriate forms of borrowing for different types of projects and objectives. Finally, the economic planning process will require that the projected evolution of the economy takes into account the changes in macro-economic variables over time and that their impact on the country’s debt servicing capacity be assessed.
African countries also face the challenge of preventing excessive debt and absorbing loans received. This suggests that there is a need to move away from discussing the debt problem at aggregate levels alone, but also at the level of projects and programs to gather lessons from success and failures. A promising possibility might be to put efforts in building capacity in debt management and monitoring, both at the budget level and at the level of individual projects and programs. Addressing all these constraints is imperative if the debt crisis is not to be perpetuated. Only a truly exit solution will really encourage the productive sector, which would generate wealth internally to reduce poverty and enhance development of African countries.
References
Aigner, D. J., C. A. K. Lovell and P. Schmidt (1977) “Formulation and estimation of stochastic production function models”, Journal of Econometrics, Vol. 6, pp. 21-37.
Alesina, A. and D. Dollar (2000) “Who gives foreign aid to whom and why?”, Journal of Economic Growth, Vol. 5 (1), pp. 33-63.
Barro, R. J. and J.-W. Lee (2002) “IMF programs: who is chosen and what are the effects”, National Bureau of Economic Research (NBER) Working Paper Series, No. 8951 (May).
Battese, G. E. and T. J. Coelli (1993) “A stochastic frontier production function incorporating a model for technical inefficiency effects”, Working Papers in Econometrics and Applied Statistics, No. 69, Department of Econometrics, University of New England, Armidale, Australia.
Battese, G. E. and T. J. Coelli (1995) “A model of technical inefficiency effects in a stochastic frontier production function for panel data”, Empirical Economics, Vol. 20 (2), pp. 325-332.
Berthelemy, J.-C. (2004) “Bilateral donors’ interest vs recipients’ development motives in aid allocation: do all donors behave the same?”, Paper presented at the HWWA conference on the political economy of aid, Hamburg (9-11 December).
Butkiewicz, J. and H. Yanikkaya (2005) “The effects of IMF and World Bank lending on long-run economic growth: an empirical analysis”, World Development, Vol. 33 (3), pp.371-391.
Coelli, T. (1996) “A guide to Frontier Version 4.1: A computer program for stochastic frontier production and cost function estimation”, CEPA Working Paper, No. 96/07, University of New England, Armidale, Australia.
Gilman, M. and W. Mitchell (2004) “Achievements to date and challenges ahead: A view from the IMF”, in J. J. Teunissen and A. Akkerman (eds.) HIPC Debt Relief: Myths and Reality, The Hague: Forum on Debt and Development (FONDAD), pp. 72-96.
Jondrow, J., C. A. K. Lovell, I. S. Materov and P. Schmidt (1982) “On the estimation of technical inefficiency in the stochastic frontier production function model”,
Journal of Econometrics, Vol. 19, pp. 233-238.
Kapijimpanga, O. (1996) The Unresolved and Deepening African Debt Crisis, Harare, Zimbabwe: African Forum and Network on Debt and Development (AFRODAD). Kapijimpanga, O. (1998) “Solving the African debt crisis?”, African Dialogue, Vol. 3.3
(December).
Li, X. and X. Liu (2005) “Foreign direct investment and economic growth: an increasingly endogenous relationship”, World Development, Vol. 33 (3), pp. 393-407.
Marijke, T. (1998) “Even with string attached, debt relief lack U.S pull”, Washington, DC: The Development Gap, mimeo.
Meeusen, W. and J. van den Broeck (1977) “Efficiency estimation from Cobb-Douglas production functions with composed error “, International Economic Review, Vol. 18 (2), pp. 435-444.
Njeru, J. (2003) “The impact of foreign aid on public expenditure: the case of Kenya”, Nairobi, Kenya: African Economic Research Consortium, Research Paper, No. 135.
Nkamleu, G. B. (2004) ‘‘Productivity growth, technical progress and efficiency change in African agriculture”, African Development Review, Vol. 16 (1), pp. 203-222. Nyemeck J. B., Sylla K., Diarra I., and G. Nyambi (2003) “Factors affecting technical
efficiency among coffee farmers in Cote d’Ivoire: evidence from the Center West region”, African Development Review, Vol. 15 (1), pp. 66-76.
Svensson, J. (1999) “Aid, growth and democracy”, Economics and Politics, Vol. 11 (3), pp. 275-297.
United Nations Development Programme (UNDP) (1999) “Debt and sustainable human development”, Technical Advisory Paper, No 4, New York: UNDP, Management Development and Governance Division, Bureau for Development Policy.
World Bank (2003) African development indicators, Washington DC: World Bank.
Annex: Data Specifications
To conduct our analysis, panel data on debts for 1999–2003 was collected from “Joint BIS-IMF-OECD-World Bank Statistics on External Debt” website. This is one of the most complete debt datasets and was designed to facilitate timely and frequent access by a broad range of users to one data set that brings together data that are currently compiled and published by the contributing international agencies on components of external debt and international reserve assets. The output of the production function is the amount of total debt outstanding at the end of each period (debt stock of countries). The total debt considered here is the sum of stocks of “official bilateral loans” and “total multilateral claims”. Multilateral claims cover data for African Development Bank, Asian Development Bank, Inter-American Development Bank, use of IMF credit, and World Bank loans (i.e., from the International Bank for Reconstruction and Development (IBRD) and International Development Association (IDA)). Official bilateral loans represent the outstanding debt on loans, other than direct export credits, extended by governments, which are members of the Development Assistance Committee (DAC) of the Organisation for Economic Co-operation and Development (OECD). These are concessional loans and other loans provided mainly for developmental purposes by the 21 member countries of the DAC.
The debt data was complemented by data on geographic location, colonial heritage, some governance indictors, population, exports of goods and services, foreign direct investment, and gross capital formation; mostly drawn from the African Development Indicators (World Bank, 2003).
• Geographical location: It is expected that due to difference in natural resource endowment, geographical location will have an impact on the indebtedness status of countries.
• Colonial heritage: Countries were grouped according to their colonial heritage. It is well known that colonial connection accounts for the differences in donor support to individual countries and for the changes over time in a given donor’s support for particular recipients (Barro and Lee, 2001; Berthelemy, 2004).
• Political right and civil liberties: Indexes of political freedom that “freedom house” has published for each sampled country was used. Each year, since 1972, based on a series of checklists relating to political rights and civil liberties, we have used a dummy variable indicating whether a country has been rated as “free” or not.
• Conflict: A dummy variable was used to characterize countries that have experienced a major civil war in the course of the last two decades. We have ranked 11 countries in a group of those who have experienced a major civil war.
• Exports of goods and services: The nominal value of all goods and services provided to the rest of the world, including merchandise, freight, insurance, travel, and other nonfactor services.
• Foreign direct investment: The amount invested or reinvested by nonresidents to acquire a lasting interest in enterprises in which they exercise significant managerial control. Investment includes equity capital, reinvested earnings, and other capital. The net figures subtract the value of direct investment abroad by residents of the reporting country.
• Gross capital formation: The amount of gross domestic fixed capital formation plus net changes in the level of inventories. Gross capita formation comprises outlays by the public sector and the private sector.
Finally, using information on the structure of production in the form of gross domestic product and its components by industrial origin, we have generated for each year and each country, the values added in agriculture, industry, and services sectors. Value added in agriculture comprises the gross output of forestry, hunting, and fishing less the value of their intermediate inputs. Value added in industry comprises the gross output of mining, manufacturing, construction, electricity, water, and gas, less the value of their intermediate inputs. Value added in services consists of gross output of all other branches of economic activity, including government, less the value of their intermediate inputs.