Non-Line-Of-Sight Environment based Localization in
Wireless Sensor Networks
Divya.R
PG Scholar,Electronics and communication Engineering, Pondicherry Engineering College, Puducherry, India
Gunasundari.R
Associate Professor,Electronics and communication Engineering, Pondicherry Engineering College, Puducherry, India
ABSTRACT
This paper presents the node localization under Non-Line-of-Sight conditions in wireless sensor networks. Consider the static blind sensor and mobile anchor nodes are in random deployment. Each of the sensor nodes determines its own position by itself is called localization. Obstacles blocking between the direct paths, called as Non-Line-Of-Sight (NLOS), which causes NLOS error. The propagation of this error results in unreliable localization and significantly decreases localization accuracy. It is an important research topic because position information is a major requirement in many WSN applications. Localization algorithms are used to find the position information of nodes in wireless sensor networks (WSNs). In the proposed work, Range Map Stitching (RMS) algorithm is used. This method can provide good localization accuracy and energy efficiency by mitigating the effects of NLOS measurements.
General Terms
Range Map Stitching Algorithm, Position estimation, Distance estimation.
Keywords
RMS(Range Map Stitching), SDP(Semi-Definite Programming), NLOS(Non-Line-Of-Sight), RSS(Received Signal Strength)
1.
INTRODUCTION
Node localization is the process through which each of the sensor nodes determines its own position by itself. Gang Wang [9] WLS approach is used for RSS-based localization in sensor networks. The WLS solution is used as a starting point for any local search routine to estimate the corresponding ML solution. The proposed method is easily applied to indoor localization although the exact ML formulation for indoor localization is hardly obtained. Simulations in both outdoor and indoor environments confirm the effectiveness of this method.Stefano Marono [5] a novel approach deals with the non-line-of-sight propagation that relies on features extracted from the received waveform. This technique does not require formulation of explicit statistical models for the features. Chao-Tsun Chang [3] the minimizing and balancing the location inaccuracies of all sensors can be reached. The proposed mechanism outperforms the
Snake-The rest of the paper is organized as follows. In Section 2, we discussed the proposed work based on node localization under NLOS conditions used. In section 3, described in detail about RMS algorithm. In Section 4, Simulation results of Performance analysis for localization accuracy and energy efficiency are presented. Conclusions are given in Section 5.
2.
PROPOSED WORK
Obstacles blocking the direct path between nodes cause some error, called as Non-Line-Of-Sight (NLOS) errors, which positive biases the location estimates and affects the localization accuracy. The main objective of the project is to identify and mitigate the NLOS errors and provides good localization accuracy in the case of static blind sensor nodes and the mobile anchor nodes. A novel algorithm, called as Range Map Stitching (RMS) algorithm is proposed.
The algorithm has two steps basically: 1) Creating local maps using geometric properties; 2) Stitching the local maps iteratively. Received Signal Strength (RSS) ranging technique used to create local maps under NLOS environments. RMS algorithm is used to find the node location of the static blind sensor nodes using the mobile anchor nodes.
2.1
RSS TECHNIQUES
2.1.1
Distance Estimation
The RSS based localization techniques eliminate the need for additional hardware, and exhibit favourable properties with respect to power consumption, size and cost. In general, the RSS based localization techniques can be divided into two categories: the distance estimation and the RSS profiling based techniques.
In free space, the received signal strength at a receiver is given by the Friis equation:
L
d
G
G
P
d
P
t t rr 2 2
2
)
4
(
)
(
3.
RANGE MAP STITCHING
The map stitching is a type of localization algorithm in which the network is divided into small overlapping sub regions, each of the mobile anchor node creates a local map, and then the local maps are stitched together to form a single global map. Although there are several methods of constructing local maps, every existing algorithm uses the same method for stitching two maps, called the absolute orientation method.
The proposed method achieves good localization accuracy and energy efficiency under NLOS conditions. Range Map Stitching (RMS) is a different way of approaching the same problem.
3.1.1
Process of RMS
Step 1: Split the network into small overlapping maps. Very often each map is simply a single node and its one-hop neighbours.
Step 2: For each sub region, compute a “local map”, which is essentially an embedding of the nodes in the sub region into a relative coordinate system.
Step 3: Finally, merge the sub regions using a coordinate system registration procedure.
Following steps are to form a single coordinate system: Step 1: Let the node responsible for each local map chooses an integer coordinate system ID at random.
Step 2: Each node communicates with its neighbors; each pair performs the following steps.
Step 2a: If both have the same ID, then do nothing further. Step 2b: If they have different IDs, then register the map of the node with the lower ID with the map of the node with the higher ID. Afterwards, both nodes keep the higher ID as their own.
Step 3: Repeat step 2 until all nodes have the same ID; now all nodes have a coordinate assignment in a global coordinate system.
Fig 2: Node v1, v2, and v3 are common to two patches (a) and (b). Two patches can be rigidly stitched by overlapping three common nodes as shown in (d). Node v1 is a little away from its actual position in the patch (c). Stitching two patches (a) and
(c) will result in a flip error as shown in (e).
3.1.2
RSS Based RMS Algorithm
Received-signal-strength (RSS) is defined as the power measured by a power detector circuit implemented in the receiver. The RSS of RF signals can be obtained during normal signal transmission without demanding additional bandwidth. RSS measurement is relatively inexpensive and can be simply implemented in the receiver; however, it is unreliable because of its unpredictable and not well modelled (i.e., large variance) sources of error. The RSS method is based on the fact that the average power of a received signal decays as a function of the distance between transmitter and receiver. Hence, a unique relationship between signal power and range can be established.
In free space, signal power decays proportionally as d-2, where d is the distance between transmitter and receiver. In a wireless channel, shadowing and multipath are two major error sources in RSS measurement which deteriorate with the quadratic property of free space attenuation. Reflection and
[image:3.595.313.551.411.476.2]Refraction of the radio wave from objects are associated into multipath and shadowing phenomena, respectively. Due to the multi-component nature of the multipath, its effect can be constructive or destructive in RSS measurement but shadowing always causes the destructive (i.e., attenuative) effect on the signal. The shadowing effect can be modelled stochastically and some RSS techniques take advantage of the a priori stochastic models to enhance the performance of the RSS method.
Table 1. Comparison Table
Mobile
Anchor Static Anchor %
Localization
Accuracy 120 70 41.6
Energy
Efficiency 47 17 63.83
4.
SIMULATION RESULTS
4.1
Simulation Environment
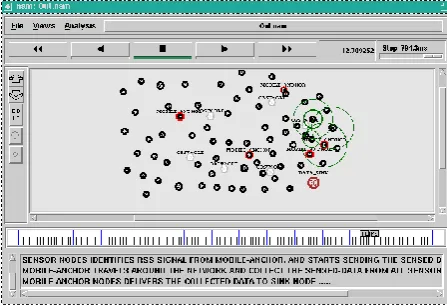
The simulation is performed with 59 sensor nodes, 5 anchor nodes and 6 obstacles. The node localization of simulation in ns2 and the node creation are shown in Fig 3. The nodes are shown in red colour is an anchor node; black colour denotes blind nodes and grey colour are obstacles. Data sink is act as a
base station. Fig 3 shows the random deployment of static blind and the mobile anchor nodes with NLOS error. Nodes start the process of localizing. Each node determines its own
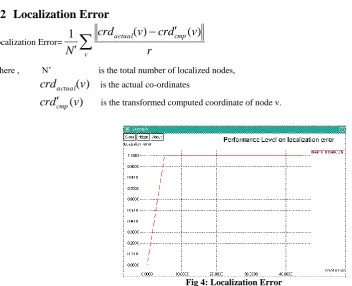
[image:3.595.185.409.602.755.2]Fig 4: Localization Error
4.3
Per Node Localization
The percentages of localized nodes are to be compared. A node is counted as localized if it belongs to the core map after completion of the stitching phase. The percentage does not depend on the stitching orders. Stitching technique achieves a higher percentage overall, but the difference is not so
[image:4.595.186.412.174.351.2]significant. As long as the network is not very sparse, it is very likely that each adjacent pair of local maps has three or more common nodes. Fig 5 shows that the result of per node localization.
Fig 5: Per Node Localization
4.4
Mobile Anchor Vs Static Anchor nodes
Fig 6 shows that the mobile anchor nodes of route length localization are better than the static blind sensor nodes. Route
[image:4.595.192.408.433.600.2]Fig 6: Mobile Anchor Vs Static Anchor nodes
4.5
Energy Efficiency
Fig 7 shows that the energy efficiency for the localization. When compared to the static and the mobile anchor, mobile anchor only consumes lesser energy. So the mobile anchor
[image:5.595.187.416.344.501.2]only the best of energy efficiency for localization under NLOS conditions. The energy efficiency of mobile anchor consumes 63.83% in terms of joules.
Fig 7: Energy Efficiency
5.
CONCLUSION
Node localization based RMS algorithm has been proposed. Mixture of LOS and NLOS range measurements, our method is applicable in both cases without discarding any range information. Simulation results demonstrate the effectiveness of RMS method. Many localization algorithms have been developed and used to estimate the position of blind sensors. Although a lot of algorithms are proposed, it is still difficult to find the node location accurately and efficiently in WSN since the proposed algorithm should be low complexity and to reduce the communication cost for WSN. It has been shown in the simulation results that the proposed localization scheme can achieve the good localization accuracy and energy
programming in wireless sensor networks,” IEEE Transactions on Wireless Communications, vol. 11, no. 1, pp. 108–116, January 2012.
[2] Oh-Heum Kwon, and Ha-Joo Song, “Localization through map stitching in wireless sensor network,” IEEE Transactions on Parallel and distributed systems, vol. 19, no. 1, January 2008.
[3] Chao-Tsun Chang, Chih-Yung Chang, and Chih-Yu Lin, “Anchor-Guiding Mechanism for Beacon-Assisted Localization in Wireless Sensor Networks” IEEE Sensor journal., Vol.12, No.5 May 2012.