http://dx.doi.org/10.4236/mnsms.2014.43011
Numerical Simulation of Decarburization in
a Top-Blown Basic Oxygen Furnace
Miguel A. Barron, Dulce Y. Medina, Isaias Hilerio
Departamento de Materiales, Universidad Autonoma Metropolitana-Azcapotzalco, Mexico City, Mexico Email: [email protected]
Received 14 April 2014; revised 13 May 2014; accepted 13 June 2014
Copyright © 2014 by authors and Scientific Research Publishing Inc.
This work is licensed under the Creative Commons Attribution International License (CC BY). http://creativecommons.org/licenses/by/4.0/
Abstract
An improved mathematical model to describe the decarburization process in basic oxygen fur- naces for steelmaking is presented in this work. This model takes into account those factors or parameters that determine the bath-oxygen impact area, such as the cavity depth, the lance height, the number of nozzles and the nozzles diameter. In the thermal issue, the model includes the tar- geted carbon content and temperature. The model is numerically solved, and is validated using reported data plant. The oxygen flow rate and the lance height are varied in the numerical simula- tions to study their effect on the carbon content and decarburization rate.
Keywords
Basic Oxygen Furnace, Carbon Content, Decarburization, Lance Height, Numerical Simulation, Oxygen Flow Rate, Oxygen Steelmaking
1. Introduction
carbon content [C] (weight percent, wt%) is higher or the bath temperature is lower than their end-point specifi- cations, a reblow of oxygen proceeds. A delay reduction may be obtained by cutting tap-to-tap times and by mi- nimizing the number of reblows. The reduction on the tap-to-tap time improves process operation in several ways. One of the most important benefits is that the refractory damage is reduced because steel and slag remain in the furnace for less time [2].
In many shops, a static charge model is used to calculate the amount of charge and the amount of oxygen re- quired. Some plants have static models that depend on the type of operation and product mix. The static charge model uses initial and final information about the heat, e.g. the amount of hot metal and scrap, the end-point carbon and temperature. The main information is sent to the process computer, and the static model performs calculations at the beginning of the heat. The static model determines the output of the amount of oxygen to be blown and the amount of fluxes to be added to get the targeted carbon and temperature [2]. A dynamic model, on the contrary, controls the blowing period of the BOF steelmaking and calculates the amounts of oxygen and coolant requirements, and predicts the end-point carbon content and temperature of molten steel [3].
In [4], a critical carbon content [C]c is defined as the melt carbon content where the decarburization reaction
rate during the main blow is equal to the decarburization rate at the end of the blow. In [5] is assumed that the point where the total rate of decarburization via gases is equal to the decarburization rate controlled by mass transfer of carbon in the liquid iron represents [C]c. Some mathematical models have been recently reported to
study oxygen steelmaking decarburization [1] [5] [6]. These models are comprehensive and first-principles based, however, their complexity prevent that plant engineers and less trained operators employ them success- fully.
A less complex mathematical model previously reported in the literature [7] is presented in this work. This model considers that [C]c = 0.3 wt%, and two decarburization mechanisms prevail: in the first one for
[ ] [ ]
C ≤ Cc the rate of carbon removal depends on the bath-oxygen impact area, whereas in the second one for[ ] [ ]
C > Cc the decaburization rate is determined by the oxygen flow rate. Unfortunately, the above model has two significant drawbacks: the bath-oxygen interface area is assumed constant and independent of the blowing conditions, and the employed thermal model, based on the thermodynamic carbon content-temperature equili-brium, is rather simple. In this work, the above model is improved in two ways: 1) taking into account those factors or parameters that determine the bath-oxygen interface area, such as the lance height, the cavity depth, the number of nozzles of the lance and the diameter of the nozzles, and 2) modification of the thermal model to include the targeted carbon content and temperature. The improved decarburization model is validated using da- ta plant reported in the literature. Besides, numerical simulations are carried out to analyze the influence of the oxygen flow rate and the lance height on the carbon content and the decarburization rate.2. Mathematical Model
The fast decarburization rates in the BOF are due to the large surface area available for the chemical reactions. When the oxygen jet hits the metal bath, a great amount of gas composed by CO + CO2 + inert evolves and the formed gas-metal-slag emulsion increases the rate of the refining reactions [2]. Roughly, the decarburization starts when all the silicon dissolved in the melt has been depleted, and this is due to the huge chemical affinity between oxygen and silicon. The time required for the silicon depletion, and therefore the beginning of decarbu- rization, is defined here as tSi. The total time during which oxygen is blown is named here as blowing time tb.
These are concepts that allow to tackle in an easy way the decarburization and the thermal modeling issues. On the other hand, the carbon content dynamics is different for low and high carbon contents given that the control- ling mechanism is different for each case.
2.1. Decarburization Rate
For
[ ] [ ]
C ≤ Cc the decarburization rate is controlled by the mass transfer, i.e. the transport of carbon to the bath-oxygen interface:[ ]
[ ]
d C C
d
d m
k S
where t is the time (min), kd is the mass transfer coefficient (m/min), S is the area (m2) of the oxygen-melt im-
pact zone, and Vm is the melt volume (m3).
For
[ ] [ ]
C > C c the decarburization rate is governed by the oxygen flow rate of the supersonic jet:[ ]
(
)
(
)
2 O 5 CO 1 d Cd 1.87 10 1 0.5
in
m in
Q x
t −W x x
− −
=
× − − (2)
where QO is the oxygen flow rate (Nm3/min), xin is the mol fraction (dimensionless) of inert gas in the decarbu-
rization zone, e.g. nitrogen, xCO is the relative content (dimensionless) of CO in the CO + CO2 mixture, and Wm
is the melt weight (g). In Equation (2) xCO is determined from the equilibrium constant of the chemical reaction
2
C CO+ →2CO and some thermodynamic considerations. In [7], the following implicit expression to deter- mine xCO is derived:
[ ]
(
)
2 CO
C CO
16759.0
exp 15.3 0
%C 1 in
Px
f x x T
− − =
− − (3)
where T is the melt temperature (K) and P is the pressure (atm). Besides, fc is the carbon activity coefficient
(dimensionless), which depends on the carbon content and the melt temperature. A least square fitting yields an expression to determine fc[7]:
[ ]
[ ]
2[ ] (
3)
[ ](
)
1 2 3 4
logfc =A C +A C +A C T−273 +A C T−273 (4)
where A1 = 0.1666, A2 = –0.01585, A3 = 9.9613 × 10⁻⁷, A4 = 3.0246 × 10⁻⁵.
2.2. Impact Zone Area
The decarburization reactions take place both in the oxygen-melt impact zone and in the gas-metal-slag emul- sion. However, is in the impact zone where a significant proportion of the carbon removal in the BOF occurs [5]. An increase in the impact area increases the reaction rate significantly, and inversely, a decrease in the impact area lowers the reaction rate [8]. A lance with multiple nozzles creates individual cavities in the liquid bath, and the total impact area of a jet can be calculated by summation of the individual areas [9]. In this work an empiri- cal expression is employed to estimate the impact area [10]
( )
( )
3 2
2 3
4 1 1
π
3 1000 2 2
L
S a
a a a
= + − (5)
where a is the cavity shape factor (dimensionless) and L is the cavity depth (mm). The cavity depth depends on the lance height, i.e. the distance from the lance tip to the initial melt level. In this work, L is estimated from the expression [11]
0 0 0.78 exp h L L L − =
(6)
where h is the lance height (mm) and L0 is a parameter which depends on the oxygen flow rate and on the geo- metrical characteristics of the particular lance being used [11]:
2 3 O 0
60 63 Q k L
nd
α
=
(7)
where kα is a coefficient (dimensionless) according to the nozzle angle, n is the number of nozzles in the lance, and d is the nozzles diameter (mm).
2.3. Thermal Model
of the melt dissolved elements such as silicon, carbon, manganese, phosphorus and iron, occurring during the oxygen blow produce more thermal energy than that required to raise the temperature of the melt to the target temperature, and to melt the fluxes. The excess heat is used to melt the cold scrap and reduce the iron ore to metal; besides, some heat is lost to the surroundings [2]. A thermal model that considers all the above factors involved in the oxygen steelmaking process would result very complex and computer time consuming, and would require a lot of computational power not always available in some plants. Then, the engineers and plant operators are in search of simple models which represent with reasonable accuracy the BOF decarburization and the thermal phenomena.
In [7] is assumed that the melt temperature varies linearly with the carbon content as follows:
[ ]
CT = −A B (8)
where A and B are constants whose values are 1873 and 50, respectively. The above assumption rests on the fact that when the scrap is added to the pig iron, the melt temperature follows a trajectory close and parallel to the liquidus line of the Fe-C equilibrium diagram. In this work a thermal model is proposed in which A and B de- pend on the initial and the end-point carbon content and temperature:
[ ]
0 C0A=T +B (9)
[ ]
Cep ep
A=T +B (10)
where T0 is the initial melt temperature (K), [C]0 is the initial melt carbon content, Tep is the end-point melt tem-
perature (K), and [C]ep is the end-point melt carbon content. Solving the above pair of simultaneous equations yield
[ ] [ ] [ ]
00 0 0 C C C ep ep T T A T − = + − (11)
[ ] [ ]
C 0 C0ep
ep
T T
B= −
− (12)
Substitution of the values of A and B obtained through Equations (11) and (12) in Equation (8) yields an im- proved value of the melt temperature.
3. Numerical Solution
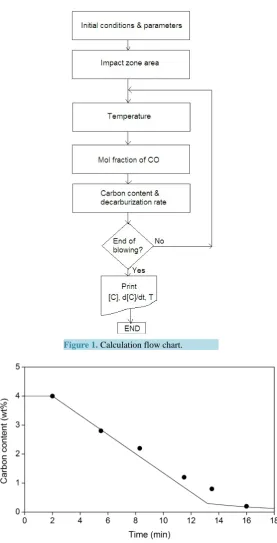
Equations (1) and (2) are ordinary differential equations that are numerically integrated using the fourth order Runge-Kutta method [12] with a time step of 1 × 10⁻⁴ min. The computer simulations for verification purposes showed that this time step is small enough to assure the stability and the convergence of the numerical solution. On the other hand, Equation (3) is a nonlinear algebraic equation that is numerically solved for xCO by means of the first order Newton-Raphson procedure [12] with a convergence criterion of 1 × 10⁻⁶ which satisfies the re- quired accuracy. FORTRAN programming language was employed for the elaboration of the computer pro-gram, and the executable file was obtained using an Absoft compiler. Calculation flow chart is shown in Fig-ure 1.
4. Results and Comments
Numerical simulations are carried out to: 1) validate a particular numerical solution of the mathematical model with data plant taken from the literature; 2) analyze the influence of oxygen gas flow rate and lance height on the carbon content and the decarburization rate. Numerical results are discussed and compared, as much as possible, with results previously reported by other authors.
4.1. Validation
The mathematical model was validated using the plant data reported in [1] and [13]. The plant data for valida- tion were as follows: Wm = 200 × 106 g, QO = 620 Nm3/min, T0 = 1623 K, Tep = 1923 K, [C]0 = 4 wt%, [C]ep =
0.1 wt%, h = 2500 mm, n = 6, d = 45 mm, P = 1 atm, tSi = 2 min, tb = 18 min. Calculated values of A and B were
simula-tions [14]: [C]c = 0.3 wt%, kd = 3.98 m/min, a = 4.1632, xin = 0, kα = 1.2. Melt volume is calculated from Vm =
Wm/ρm, where ρm = 7.1 g·cm–3. The results of validation are shown in Figure 2. One can see that the agreement
[image:5.595.172.450.150.694.2]between the numerical results and the plant data are very good, except at the end of the oxygen blow, i.e. for 10 < t < 14 min, where the numerical results are a little bit underestimated. This gives some reliability to the sub- sequent numerical simulations.
[image:5.595.241.386.156.489.2]Figure 1. Calculation flow chart.
4.2. Effect of the Oxygen Flow Rate
The oxygen flow rate controls the decarburization rate if
[ ] [ ]
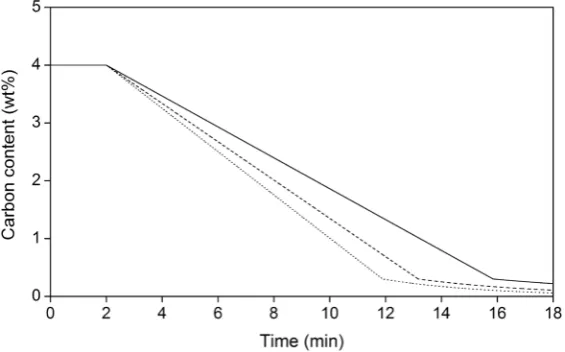
C > C c. Due to the high availability of carbon during the initial oxygen blow, the decarburization rate is mainly determined by the oxygen flow rate. The blowing rates have a wide variation from shop to shop and depend on the lance design and on the pressure and quality of the oxygen supply. The oxygen flow rate in plant operation is frequently limited by the volume of the furnace, the lance design, and the capacity of the gas collection and cleaning system to handle the gaseous reac- tion product and fumes [2]. [image:6.595.172.455.305.481.2] [image:6.595.176.455.519.692.2]Considering the plant data of [1] and [13] which are detailed in Section 4.1, numerical simulations were car- ried out for three values of the oxygen flow rate: 500, 620 and 700 Nm3/min. The results are depicted in Figure 3 and Figure 4, which show the effect of the oxygen flow rate on the carbon content and the decarburization rate, respectively.
Figure 3 shows that as the oxygen flow is increased, the carbon content experiences a faster decrease. An in- flexion point at [C] = [C]c is exhibited by the three flow rates considered, and this inflexion point corresponds to
a transition in the decarburization mechanism: the carbon oxidation process passes from being controlled by the oxygen flow rate to a process controlled by the mass transfer, the area of the impact zone and the lance height. The time at which this transition of decarburization mechanism occurs is named here as transition time tt, and is depicted in Figure 5 as a function of the oxygen flow rate. It is appreciated that tt decreases from 15.85 to 11.89
Figure 3. Melt carbon content as a function of the blowing time and the oxy- gen flow rate. 500 (solid), 620 (dashed), 700 Nm3/min (dotted).
min as the oxygen flow rate increases from 500 to 700 Nm3/min. In accordance to Figure 5, tt has a slightly nonlinear dependence on the oxygen flow rate.
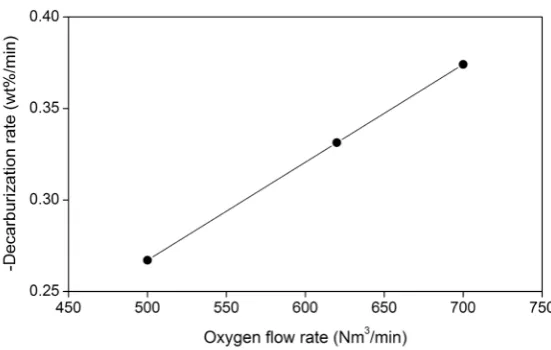
Given that tSi = 2 min, during this time the decarburization rate is null given that the silicon has a preferential oxidation than the carbon, as is seen in Figure 4. Thereafter, the decarburization rate remains constant until the transition time is reached; then it decays nonlinearly until the end of the blow. The laboratory investigations on decarburization kinetics have demonstrated that for high carbon melts at a partial pressure of oxygen similar to that in the BOF the rate of carbon removal is a linear function of the gas flow rate [15]. This corroborates the results shown in Figure 6, where this linear dependence is exhibited.
4.3. Effect of the Lance Height
The lance height is a trade-off between a faster carbon removal rates and a right slag forming. When the lance is too high, the rate of carbon removal is reduced and erratic; besides, the slag will be over-oxidized and higher iron losses occur by oxidation. When the lance is too low, the carbon removal is increased [16] and the oxidation losses are reduced. However, there is a correct lance height, and it depends on the furnace and lance design and the oxygen flow rate [2]. The cavity depth is increased and the impact zone area is decreased when the lance height is decreased [5], so in the last minutes of the blow where the decarburization rates depends on the mass transfer and the impact zone area, the lance height is the main factor controlling the carbon removal.
[image:7.595.172.455.321.496.2]Figure 7 shows the melt carbon content as a function of the lance height during the last five minutes of the
Figure 5. Time for the decarburization mechanism shift as a function the of oxygen flow rate.
[image:7.595.175.451.530.705.2]oxygen blow. For
[ ] [ ]
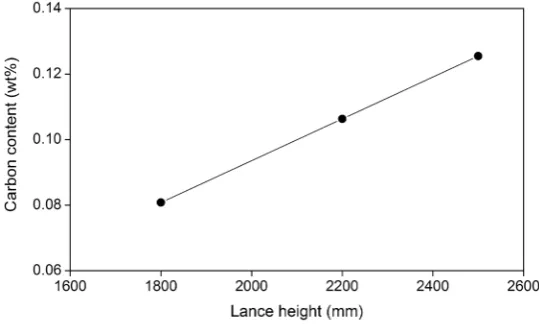
C ≤ C c the carbon contents exhibits exponential time decay due to thermodynamic con- siderations, in accordance to Equation (1); this behavior is observed in Figure 7.In spite of the exponential time decay of the carbon content, at the end of the blow this variable has a linear dependence on the lance height, as is seen in Figure 8.
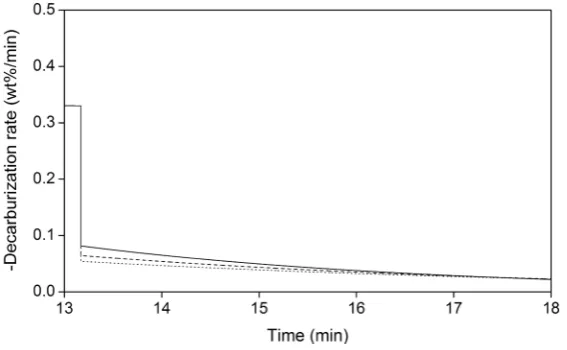
Finally, as reported in [2] and [16], the decarburization rate decreases as the lance height is increased, as is observed in Figure 9.
5. Conclusions
An improved mathematical model of decarburization in basic oxygen furnaces is presented in this work. Im- provements consist in taking into account those factors or parameters that determine the bath-oxygen impact area, such as the depth of cavity, the lance height, the nozzles number and the nozzles diameter, and by modifi- cation of the thermal model to include the carbon content and temperature end-points specifications. The im- proved model is validated using data plant reported in the literature. Conclusions are as follows:
1) The oxygen flow rate controls the decarburization rate for carbon contents above a critical value. As the oxygen flow rate is increased, the decarburization rate is increased too. The decarburization rate has a linear de- pendence on the oxygen flow rate.
[image:8.595.181.448.327.493.2]2) The lance height controls the decarburization rate for carbon contents below a critical value. As the lance height is decreased, the decarburization rate is increased. The carbon content at the end of the blow has a linear dependence on the lance height.
Figure 7. Melt carbon content as a function of the blowing time and the lance height. 1800 (solid), 2200 (dashed), 2500 mm (dotted).
[image:8.595.177.447.530.693.2]Figure 9. Decarburization rate as a function of the blowing time and the lance height. 1800 (solid), 2200 (dashed), 2500 mm (dotted).
3) The present model has a reasonable reliability given that it is able to reproduce in a proper manner the data plant considered. Then, in spite of its simplifications, this improved model can be used as a static or dynamic model to train plant technicians and operators.
References
[1] Dogan, N., Brooks, G.A. and Rhamdhani, M.A. (2011) Comprehensive Model of Oxygen Steel-Making. Part 1: Model Development and Validation. ISIJ International, 51, 1086-1092. http://dx.doi.org/10.2355/isijinternational.51.1086 [2] Fruehan, R.J. (1998) The Making, Shaping and Treating of Steel. Steelmaking and Refining Volume. 11th Edition, The
AISE Steel Foundation, Pittsburgh.
[3] Han, M. and Zhao, Y. (2011) Dynamic Control Model of BOF Steelmaking Process Based on ANFIS and Robust Re- levance Vector Machine. Expert Systems with Applications, 38, 14786-14798.
http://dx.doi.org/10.1016/j.eswa.2011.05.071
[4] Goldstein, D.A. and Fruehan, R. (1999) Mathematical Model for Nitrogen Control in Oxygen Steelmaking. Metallur- gical and Materials Transactions B, 30, 945-956.
[5] Dogan, N., Brooks, G.A. and Rhamdhani, M.A. (2011) Comprehensive Model of Oxygen Steel-Making. Part 3: De- carburization in Impact Zone. ISIJ International, 51, 1102-1109. http://dx.doi.org/10.2355/isijinternational.51.1102 [6] Dogan, N., Brooks, G.A. and Rhamdhani, M.A. (2011) Comprehensive Model of Oxygen Steel-Making. Part 2: Appli-
cation of Bloated Droplet Theory for Decarburization in Emulsion Zone. ISIJ International, 51, 1093-1101. http://dx.doi.org/10.2355/isijinternational.51.1093
[7] Chou, K.C., Pal, U.B. and Reddy, R.G. (1993) A General Model for BOP Decarburization. ISIJ International, 33, 862-868. http://dx.doi.org/10.2355/isijinternational.33.862
[8] Zughbi, H.D. (2004) Decarburization of Fe/C Melts in a Crucible: Effects of Bath Sulfur Level and Bath Surface Area. Scandinavian Journal of Metallurgy, 33, 242-250. http://dx.doi.org/10.1111/j.1600-0692.2004.00691.x
[9] Deo, B. and Boom, R. (1993) Fundamentals of Steelmaking Metallurgy. Prentice-Hall, New York.
[10] Garnica, P., Morales, R.D. and Rodriguez, N.U. (1994) Improving the Operation Technology of the BOF at SI- CARTSA. Proceedings of the 77th Steelmaking Conference,20-23 March 1994, Chicago, 189-198.
[11] Nippon Steel Corporation (1975) Metallurgical Information Based on Nippon Steel BOF Plant Operation. Technical Report, Nippon Steel Corporation, Tokyo.
[12] Chapra, S.C. and Canale, R.P. (2010) Numerical Methods for Engineers. 6th Edition, McGraw-Hill, New York.
[13] Cicutti, C., Valdez, M., Perez, T., Donayo, R. and Petroni, J. (2002) Analysis of Slag Foaming during the Operation of an Industrial Converter. Latin American Applied Research, 32, 237-240.
[14] Gonzalez, J. and Barron, M.A. (2002) Carbon Estimation in a BOF with Noise Attenuation. Proceedings of the 15th IFAC World Congress, Barcelona, 21-26 July 2002, 1167-1172.
nism and Kinetics of Reactions in BOF Steelmaking: Theory vs. Practice. Steel Research International, 81, 940-948. http://dx.doi.org/10.1002/srin.201000123
[16] Li, G., Wang, B., Liu, Q., Tian, X., Zhu, R., Hu, L. and Cheng, G. (2010) A Process Model for BOF Based on Bath Mixing Degree. International Journal of Minerals, Metallurgy and Materials, 17, 715-722.
currently publishing more than 200 open access, online, peer-reviewed journals covering a wide range of academic disciplines. SCIRP serves the worldwide academic communities and contributes to the progress and application of science with its publication.