© 2018, IRJET | Impact Factor value: 6.171 | ISO 9001:2008 Certified Journal
| Page 1707
OPTIMIZATION ON FRICTION WELDING OF SUPER DUPLEX STAINLESS
STEEL 2507 USING DESIGN OF EXPERIMENTS
Sivakumar Velayutham
1, M.Deepak kumar
21
Dept. of metallurgical Engineering, Government college of Engineering, Salem, Tamil Nadu, India.
2
Asst .professor, Dept. of Metallurgical Engineering, Government college of Engineering, Salem, Tamil Nadu, India.
---***---Abstract
–
The super duplex stainless steel 2507 were friction welded. The welded samples were prepared for tensile test. The optimization of welding parameter is found by design of experiments. The tensile strength of friction welded joint is analyzed. The present work was focused on optimization of super duplex Stainless steel welds. This may lead to have a difference in mechanical properties of weld joints with respect to the varying parameters.Key Word: friction welding, super duplex stainless steel
2507, tensile test, response surface methodology, analysis of variance and optimization of parameters.
1.
INTRODUCTION
Welding, as a technological process, is widely used in modern engineering. Without the ability to make strong and durable connections between materials it would not be possible to produce the many different objects upon which we all rely in our everyday lives, from the very large to the very small parts. In conventional welding process, a filler material is added to the joint with the help of an outside heat source such as a torch flame. The welding processes currently used in fabrication and construction industry basically involve the deposition of weld metal by arc welding processes which may be manual, semi or fully mechanized. All of these processes involve the preparation of the joint edges and multi-pass techniques in order to achieve full penetration of the joints. The major demerit of above mentioned techniques are associated-with, possible use of pre-heat, low joining rates, requirement of skilled labor, use of expensive filler materials restrictions on welding positions and there are many other problems of metallurgical nature concerned with weld defects and joint properties, particularly toughness. However, the availability of a mechanized process capable of a high joining rate would be a considerable breakthrough. It is considered that both friction and electron beam welding offer great potential in this area.
Friction Welding (FRW) is a solid state welding process which produces weld by the compressive force contact of work pieces which are either rotating or moving relative to one another. Heat is produced due to the friction which displaces material plastically from the faying surfaces [1,2]. Friction welding can achieve high-production rates and therefore it is economical in operation. It has widespread industrial applications and helps to weld materials which are difficult to join by fusion welding. Various ferrous and non-ferrous alloys, which have circular or non-circular cross-sections and, having different thermal and mechanical
properties, can easily be joined by the friction welding method. The main process parameters of friction welding are rotation speed, friction load, friction time, forging load and forging time and these process parameters have significant role in making good quality joints [3].
So to get a good quality weld joint, it is significant to select proper combinations of process parameters. To produce the expected response, the first step is to identify the suitable combinations of process variables and it requires many experiments, making this process time consuming and expensive [4]. So to overcome this situation, mathematical models could be built which can adequately predict the relation between input process parameters and the responses. Response surface methodology (RSM) [5] is widely used for this purpose.
The super duplex stainless steel 2507 has plenty of industrial applications such as in desalination and food processing equipment, shipbuilding because of its high mechanical strength.
© 2018, IRJET | Impact Factor value: 6.171 | ISO 9001:2008 Certified Journal
| Page 1708
2.
EXPERIMENTAL PROCEDURE
2.1 Material selection
Knowledge on material properties and applicability of metallic materials and material combinations for friction welding is not completely clear. Experimental studies and practical applications have been given to address this problem. Preliminary trials have been carried out in order to determine optimum parameters of welding, the applicability of welding process for every new material or material combinations. The results of these studies are not concrete since they are experimental. They can be modified or redefines as new facts come out. The main two parameters needed for the test of suitability of a material to welding are the strength of a material and its deformation capacity under heat. The strength of material has to be high enough to resist axial pressure and torque, which may occur due to excessive deformation. Moreover, the material to be joined needs to exhibit enough heat treatment deformation behavior for the quality of joining process. In this study super duplex stainless steel 2507 is used as the base material. The chemical composition of the base material SS 2507 is given in Table 1. The samples have 13 mm diameter extruded rod and 76 mm length.
Table -1: Chemical Composition of the Studied Alloy
2.2 Experimental design based on Response SurfaceMethod
Engineers often wish to determine the values of the process input parameters at which the responses reach their optimum condition. RSM is one of the optimization techniques currently in widespread use in describing the performance of the welding process and finding the optimum of the responses. When all independent variables are measurable, controllable and continuous in the experiments, with negligible error, the response surface can be expressed by
y = f (x1, x2,……,xk) --- (1)
k is the number of independent variables. To optimize the response „„y‟‟, it is necessary to find an appropriate approximation for the true functional relationship between the independent variables and the response surface. Usually a second-order polynomial Eq. (2) is used in RSM.
y = bo +ΣbiXi+ΣbiiX2ii+ΣbijXiXj+ --- (2)
Based on the literature survey it was observed that the process parameters have a significant effect on the tensile strength. Process parameters like friction load, friction time, rotational speed, forging load, forging time, burn of length. Among the above parameters, the friction load, forging load,
and rotational speed are more important because these parameters affect weld joint quality. These process parameters are set based on the survey in the field. In the present study, the process parameters selected are friction load, friction time, forging load, forging time and rotational speed is kept constant. The working ranges of all selected parameters were fixed by conducting trial runs. This was carried out by varying one of the parameters while keeping the rest of them at constant values. The working range of each process parameter was decided upon by inspecting the weld for a smooth appearance without any visible defects. By performing various trial runs the maximum and minimum levels of welding parameters for super duplex stainless steel 2507 were found and given below in table 2.
Table -2: factors and levels
Factors Level 1 Level 2 Level 3 Level 4 Level 5
Friction load (FrL) kg 850 900 950 1000 1050
Friction time (Frt) sec 28 29 30 31 32
Forging load (FoL) kg 800 850 900 950 1000
Forging time (Fot) sec 5 6 7 8 9
The Design of Experiments (DOE) was done by Response surface methodology (RSM) using Design Expert version 6.0.8 statistical software. The design matrix chosen to conduct the experiment was a Central Composite Design (CCD) having 31 experiments. Thus the 31 experimental runs allowed the estimation of linear, square and two-way interactive effects of the process parameters on tensile strength.
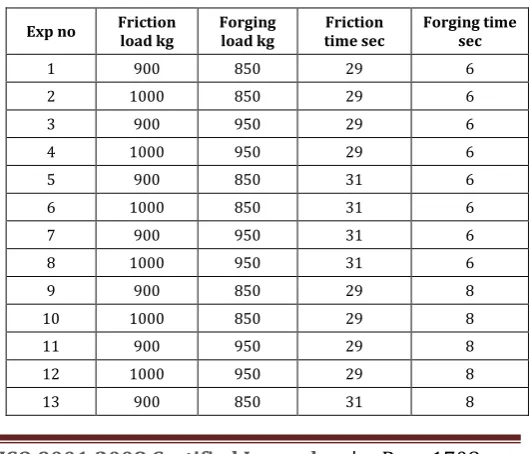
[image:2.595.300.565.557.784.2]The test was designed based on a four factors-five levels central composite rotatable design with full replication. The Friction welding input variables are friction time Frt, friction load FrL, forging time Fot, forging load FoLas shown below in table 3.
Table -3: Welded Input Variables
Exp no Friction load kg Forging load kg Friction time sec Forging time sec
1 900 850 29 6
2 1000 850 29 6
3 900 950 29 6
4 1000 950 29 6
5 900 850 31 6
6 1000 850 31 6
7 900 950 31 6
8 1000 950 31 6
9 900 850 29 8
10 1000 850 29 8
11 900 950 29 8
12 1000 950 29 8
© 2018, IRJET | Impact Factor value: 6.171 | ISO 9001:2008 Certified Journal
| Page 1709
14 1000 850 31 8
15 900 950 31 8
16 1000 950 31 8
17 850 900 30 7
18 1050 900 30 7
19 950 800 30 7
20 950 1000 30 7
21 950 900 28 7
22 950 900 32 7
23 950 900 30 5
24 950 900 30 9
25 950 900 30 7
26 950 900 30 7
27 950 900 30 7
28 950 900 30 7
29 950 900 30 7
30 950 900 30 7
31 950 900 30 7
2.3 RESULTS AND DISCUSSION
The welded joints are machined to the dimensions as per ASTM guidelines are followed in preparing the tensile test specimens. Tensile test is carried out on a 100 kN electromechanical controlled universal testing machine. The specimen is loaded at the rate of 1.5 kN per minutes according to the ASTM specifications.
[image:3.595.32.567.55.329.2]The tensile strength values are given with corresponding friction welding process parameters in the Table 4.
Table -4: welding input parameters and corresponding tensile strength
Exp
no Friction load kg Forging load kg time sec Friction time sec Forging
Tensile strength (TS)
N/mm2
1 900 850 29 6 724
2 1000 850 29 6 745
3 900 950 29 6 791
4 1000 950 29 6 762
5 900 850 31 6 784
6 1000 850 31 6 811
7 900 950 31 6 848
8 1000 950 31 6 820
9 900 850 29 8 733
10 1000 850 29 8 721
11 900 950 29 8 769
12 1000 950 29 8 754
13 900 850 31 8 770
14 1000 850 31 8 722
15 900 950 31 8 818
16 1000 950 31 8 817
17 850 900 30 7 751
18 1050 900 30 7 790
19 950 800 30 7 717
20 950 1000 30 7 819
21 950 900 28 7 765
22 950 900 32 7 843
23 950 900 30 5 745
24 950 900 30 9 776
25 950 900 30 7 789
26 950 900 30 7 792
27 950 900 30 7 791
28 950 900 30 7 787
29 950 900 30 7 790
30 950 900 30 7 789
31 950 900 30 7 792
The mathematical model to establish the relationships between input and output parameters were developed using Design expert software based on the experimental data collected as per the Central Composite Design based on Response Surface Methodology (RSM). Tensile strength is expressed in the form as a non-linear function of process parameters. The final empirical relationship was constructed using only these coefficients, and the final empirical relationship obtained in un-coded values for tensile strength ‘TS’. The regression equations in terms of actual factors thus obtained tensile strength is as follows
Tensile strength (TS) = -2052 + 5.29 FrL + 1.98 FoL - 142 Frt + 300 Fot - 0.00149 FrL*FrL- 0.00167 FoL*FoL + 2.51 Frt*Frt 8.30 Fot*Fot 0.00148 FrL*FoL 0.0187 FrL*Frt 0.0844 FrL*Fot + 0.0798 FoL*Frt + 0.0696 FoL*Fot 5.72 Frt*Fot
[image:3.595.32.563.526.796.2]S = 17.8652; R-Sq = 85.33%; R-Sq (adj) = 72.50%; R-Sq (pred) = 15.77%, where, (S = root mean squared deviation, R-Sq = coefficient of correlation)
Table -5: Estimated Regression Coefficients
Factors Estimated regression coefficient (tensile strength)
Intercept 790
FrL -3.53
FoL 44.96
FrT 45.65
FoT -9.93
FrL * FrL -14.9
FoL ⃰FoL -16.7
FrT ⃰FrT 10.0
FoT ⃰FoT -33.2
FrL ⃰FoL -14.8
© 2018, IRJET | Impact Factor value: 6.171 | ISO 9001:2008 Certified Journal
| Page 1710
FrL ⃰FoT -16.9
FoL ⃰FrT 16.0
FoL ⃰FoT 13.9
[image:4.595.321.563.51.261.2]FrT ⃰FoT -22.9
Table -6: ANOVA test results for the response tensile strength
SOURCE DF ADJ SS ADJ MS F P
MODEL 14 29709.8 2122.1 6.65 0.000
LINEAR 4 25292.4 6323.1 19.81 0.000
SQUARE 4 2926.7 731.7 2.29 0.104
2-WAY
INTERACTION 6 1490.8 248.5 0.78 0.599 RESIDUAL ERROR 16 5106.6 319.2
LACK OF FIT 10 5086.6 508.7 152.60 0.000
PURE ERROR 6 20.0 3.3
TOTAL 30 34816.5
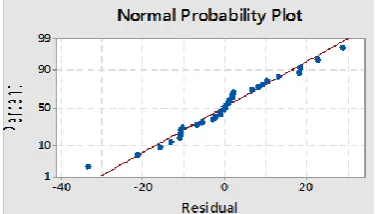
The normal probability plot of the residuals for tensile strength is shown in Fig.1. It reveals that the residuals are falling on the straight line, which means the errors are distributed normally [10].
Fig -1: Normal probability plot for tensile strength
FrL 950 FoL 900 Frt 30 Fot 7 Hold Values FoL*FrL 1020 960 900 1000 950 900 850 800 Frt*FrL 1020 960 900 32 31 30 29 28 Fot*FrL 1020 960 900 9 8 7 6 5 Frt*FoL 1000 900 800 32 31 30 29 28 Fot*FoL 1000 900 800 9 8 7 6 5 Fot*Frt 32 30 28 9 8 7 6 5 > – – – < 700 700 750 750 800 800 850 850 TS Contour Plots of TS
Fig -2: Contour plots for tensile strength
FrL 950 FoL 900 Frt 30 Fot 7 Hold Values 700 750 00 0 8 8 960 1 00 0 900 800 1040 10 900 1000 0 00 8 0 S T L o F L r F 750 00 8
8809601 0 0 30 28 0 4 0 1 3 30 32 00 8 50 8 0 0 S T t r F L r F 0 0 7 725 0 5 7 0 8 8 960 1 0 9. 7.5 0 6. 0 1 40 75 7 5 S T t o F L r F 0 0 7 0 0 8 8 0 0 0 0 8 900 0 0 0 30 28 1 000
[image:4.595.67.256.391.498.2]3 30 2 3 900 S T t r F L o F 0 5 6 0 0 7 0 5 7 800 0 0 9 9.0 7 5. 6 0. 0 0 0 1 0 5 7 800 0 0 S T t o F L o F 0 70 5 7 0 800 0 28 30 0 0 0 0 . 9 . 7 5 0 . 6 32 800 0 5 8 S T t o F t r F S T f o s t o l P e c a fr u S
Fig -3: Surface plots for tensile strength
Interactive effects of process parameters on the response are shown using contour plots. Contour plots have generated using Minitab 16 software for all pairs of factors. Contour plots for Impact Strength are shown in the figure 2.
Response surface methodology (RSM) is used to optimize the friction welding parameters in this study. RSM is a collection of mathematical and statistical techniques that are helpful in designing a set of experiments, analyzing the optimum combination of input process parameters, developing a mathematical model, and expressing the values graphically. Surface plots and contour plots are the indications of possible independence of factors. To obtain the nature of influence and optimized condition of the process on tensile strength, surface plots and contour plots have been developed for the empirical relation by considering one process parameters in the middle level and two process parameters in the X and Y axes. These response contours can assist in the prediction of the response for any zone in the experimental field. The apex of the response plot shows the maximum achievable tensile strength. Fig. 2 show that, the tensile strength increases with increasing the friction load/time and then decreases. But the tensile strength increases with increase the forging load and decreases with increase in forging time.
A contour plot is produced to display the region of the optimal factor settings visually. For second- order responses, such a plot can be more complex compared to the simple series of parallel lines that can take place with first-order models. Once the stationary point originates, it is generally necessary to characterize the response surface in the immediate vicinity of the point. Characterization involves identifying whether the stationary point is a saddle point or minimum response or maximum response.
[image:4.595.41.281.531.723.2]© 2018, IRJET | Impact Factor value: 6.171 | ISO 9001:2008 Certified Journal
| Page 1711
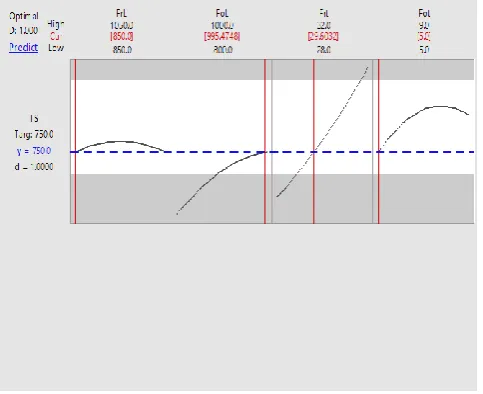
the friction time is found to have greater influence on tensilestrength of the joints followed by forging load/time and friction load within the range considered in this investigation.
Fig -4: optimization plot for maximum tensile strength
[image:5.595.42.284.138.335.2]The predicted tensile strength for the first friction welded specimen is 723.355 N/mm2 could be attained under the welding conditions of Friction load (FrL) is 900kg, Forging load (FoL) is 850kg, friction time (Frt) is 29 sec, forging time (Fot) is 6 sec and rotational speed is 1100 rpm. The experimentally determined tensile strength for the first friction welded specimen is found to be 724 N/mm2 and could be attained under the welding conditions of Friction load (FrL) is 900 kg, Forging load (FoL) is 850 kg, friction time (Frt) is 29 sec, forging time (Fot) is 6 sec and 1100 rpm of rotational speed which shows the consistency of the model. The optimized welding condition obtained by the response surface methodology is given in the table 7.
Table -7: Optimized conditions by Response Surface Methodology
Friction load (FrL) kg 850
Forging load (FoL) kg 995
Friction time (Frt) sec 29
Forging time (Fot) sec 5
3. CONCLUSIONS
In this study, Friction welding process parameters were optimized by using response surface methodology. The friction welding process was carried out as per the design of experiments by central composite design. Tension test was carried out for friction welded samples and the results of the tests are recorded. Based on the experimental results, regression analysis has conducted with the help of Minitab-16 and Design-Expert softwares, to determine input–output relationships of the process. Based on the mathematical model developed, the responses were predicted and
correlation graphs were plotted successfully. The regression equations were then plotted on tensile strength was analyzed. The process parameters were then optimized using RSM to yield maximum tensile strength. Based on the experimentation and optimization the following conclusions are stated:
1. The empirical relations were developed to predict the tensile strength of the friction welded super duplex stainless steel 2507 rods incorporating process parameters at 85% confidence level.
2. The optimum condition for maximum tensile strength could be attained in friction welded super duplex stainless steel 2507 rods under the welding conditions of Friction load (FrL) is 850 kg, Forging load (FoL) is 995 kg, friction time (Frt) is 29 sec, forging time (Fot) is 5 sec and rotational speed is 1100 rpm.
3. The process parameters have a significant effect on tensile strength and friction time was found to have greater influence on tensile strength of the joints followed by forging load, forging time and friction load.
4. The fusion zone of rotating side has more width than the stationary side. This will lead the higher hardness than the stationary side of the welded specimen.
REFERENCES
1) AWS welding handbook. vol. 2. Miami: American Welding Society; 1991.
2) ASM handbook. vol. 6. Materials Park: ASM International; 1995.
3) Dunkerton SB. Toughness properties of friction welds in steels. Weld J 1986:193–201.
4) Deb Kalyanmoy. Optimizations for engineering design algorithm and examples. New Delhi: Prentice Hall of India; 1996.
5) Khuri AI, Cornell JA. Response surfaces; design and analysis. New York: Marcel Dekker; 1996.
6) K.G.K. Murti, S. Sundaresan, Parameter optimization in friction welding dissimilar materials, Met. Constr. (1983) 331–335.
© 2018, IRJET | Impact Factor value: 6.171 | ISO 9001:2008 Certified Journal
| Page 1712
8) Sathiya, P., S. Aravindan, A. Noorul Haq and K.Paneerselvam (2009) Optimization of friction welding parameters using evolutionary computational techniques. Journal of Materials Processing Technology, 209, 2576–2584.
9) Paventhan, R., P. R. Lakshminarayanan And V. Balasubramanian (2011) Prediction and optimization of friction welding parameters for joining aluminium alloy and stainless steel. Trans. Nonferrous Met. Soc. China, 21, 1480-1485.