ISSN: 1992-8645 www.jatit.org E-ISSN: 1817-3195
VERIFICATION OF VERTICAL TIME LAG IN AN
E-GOVERNMENT SYSTEM BY USING A CASUAL MODEL:
KOREA WORKNET SYSTEM CASE
1 Dae Chul Lee, 2 Gyoo Gun Lim, 3Mi Hwa Lim
1
Creative Consulting Chief Consultant, School of Business, Hanyang University, Seoul, Korea
2
Professor, School of Business, Hanyang University, Seoul, Korea, corresponding author
3
Assistant Professor, Urban Planning & Real Estate, Dankook University,Geonggi, Korea
E-mail: [email protected], [email protected], [email protected]
ABSTRACT
Many organizations and governments have been investing various types of innovative information systems. Sometimes it takes time to see the performance of such investments due to the time lags. The time lags of information systems investment can be seen from vertical and horizontal viewpoints. The vertical means the time lag among the performance layers; input, process and output and the horizontal means the time lag in a specific layer. In this study we show the existence of time lags between the layers by using causality relation model for the WORKNET system of Korea. For this study we made indicators for each layers and tested the causality among indicators in different layers. From this study we showed the existence of the time lag between performance layers.
Keywords: Time-lag effect, Performance evaluation, IT performance, Performance model, vertical time
lag
1. INTRODUCTION
Many organizations and governments have been investing various types of innovative information systems (IS). Innovative information systems can be defined as the means bringing out innovation to organizations and can be seen to belong to one of the organizational innovations (Swanson, 1994). In the research field related to the information system studies, the adoption or implementation of new information system can be seen as the efforts of organizational innovation or technology diffusion by using proper technology into user group. Many e-government information systems and strategic information systems can be categorized as an innovative information system [22].
Sometimes it takes time to see the performance of such investments due to the time lags of the adoption about the innovation. Previous studies regarding performance evaluation for information systems rarely mentioned time lags in the performance and some researches tried to explain the time lag only from a chronological viewpoint. However, recently Lim et al., (2015) proposed a framework for the performance evaluation considering time lags [20, 23]. Time lag can exist in a certain level of performance layers (HTL: horizontal time lag) and between certain performance levels (VTL: vertical time lag). VTL
refers to the time until a change in performance appears through the performance layers following the flow of input process output layers. HTL refers to the time lag of a specific performance indicator in a certain performance layer.
ISSN: 1992-8645 www.jatit.org E-ISSN: 1817-3195 Section 2 reviews some related literatures, and
Section 3 suggests a research model. Section 4 discusses the results of this study and section 5 provides concluding remarks.
2. LITERATURE REVIEW
2.1 Performance evaluation
There have been many researches on the performance of information systems. Davis (1989) proposed Technology Adaption Model as a theory to explain the behavior of users on IT. This model explained process that perceived usefulness and perceived ease of use impact on attitude toward use and eventually use of it. DeLone and McLean (2003) argued that individual can improve their performance by using information system features (system quality, information quality, service quality) and this has a same context with Davis’s model. Likewise, Myers et al. (1997), Hamilton and Chervany (1981) insisted that use of IS positively impacts on individual performance and emphasized the active support of IS management staff and the importance of response activities for improvement. Goodhue and Thompson (1995) proposed TCP model that if IS is utilized then it leads to the improvement of individual performance when tasks fit the IS. Besides system quality, Lim et al. (2008), Delone and McLean (2003), Rainer and Watson (1995), Olson and Lucas (1982), and others mentioned that information quality of IS can affect the performance through timeliness, sufficiency, and accuracy of information and etc. Recently the service quality is considered important to the IS performance. It can be defined as the quality of IS services including IS user supporting activities and service staffs [9, 18, 25, 27, 28].
2.2 Time Lag Framework
A time lag can be defined as a time delay attributable to a particular property or behavior of individuals, organizations, communities, systems, etc. [14]. Lim et al., (2015) proposed a framework for the performance evaluation considering time lags as Figure 1. [20, 23]. This framework defined the time lags between two layers as Tip, Tpo, and
Tio in the VTL dimension and the time lags of specific indicators as Ti, Tp, and To in the HTL dimension. t refers to a specific time point and t + n
is n time units that have passed after a certain time t. Input(t), Process(t), Output(t) refers to the performance of a specific time t. Therefore, Ti is the time lag of the performance change in the input layer that appears after n time units have passed.
[image:2.612.318.534.149.309.2]Likewise Tpo is the time lag of the performance change in the output layer after n time units have passed that is affected by Process(t) [20, 23].
Figure 1: Time Lag Based Performance Evaluation Framework For Information Systems [23]
To demonstrate a time lag effect in the HTL dimension, Lim et al., (2015) designed a research model and set up hypotheses. By collecting related data and analyzing it, they verified these hypotheses with some examples of Korea and the U.S cases. This study tries to set up a research model and derive hypotheses based on existing theory in order to demonstrate a causal relationship in the VTL dimension through the layers to verify the existence of a time lag between layers after innovative information system investment.
2.2 WORKNET
WORKNET(http://worknet.go.kr) is the major public recruitment portal in Korea which was established in 1998 by the Ministry of Labor of Korea to provide reliable recruitment, job search and placement, and career information. WORKNET provides integrated employment services allowing people to find all the employment-related information and allows job seekers to manage their application documents. The average daily visitors are 467,000 in 2013 and 3,912,110 people are registered for the job search and 2,551,322 firms are registered for recruitment. 9.3 million users are registered on WORKNET with 8.24 million personal members and one million corporate members and 6,766 job placement staffs in local Employment Support Centers [23].
ISSN: 1992-8645 www.jatit.org E-ISSN: 1817-3195 for career consultants in local government
Employment Support Centers to help them effectively perform their duties such as job placement, certification of job search and recruitment, operation of employment assistance programs, and career counseling. In this study we measure the VTL in the performance by gathering survey information from 392 public officers in the centers who are responsible for the employment support using WORKNET.
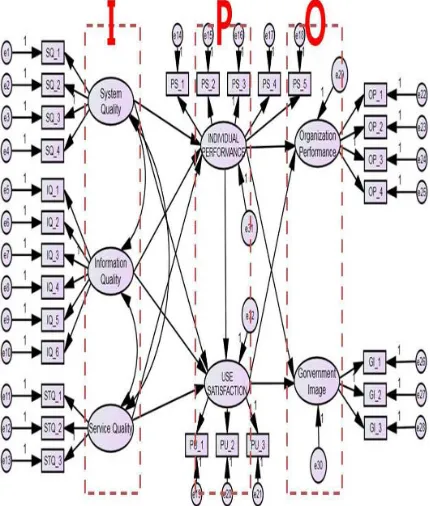
3. RESEARCH MODEL
3.1 Model and Hypotheses
[image:3.612.92.297.326.530.2]This research sets up the research model and derived hypotheses as shown in Figure 2 based on the existing theory so that it demonstrate the causal relationship through Input – Process – Output in VTL dimension.
Figure 2: Causal model of time lag effect in VTL
Based on previous studies, this research set up hypotheses for investigating the causal process between Output, Process, and Input layers as Table 1.
Table 1: Research Hypotheses
Between Input layer and Process layer
Ha1 System quality will positively affect the Individ ual process performance.
Ha2 Information quality will positively affect the Ind ividual process performance.
Ha3 Service quality will positively affect the Individ ual process performance.
Ha4 System quality will positively affect the User sa tisfaction.
Ha5 Information quality will positively affect the Us er satisfaction.
Ha6 Service quality will positively affect User satisf action.
Between Process layer and Output layer
Hb1 Individual performance will positively affect the Organization performance.
Hb2 Individual performance will positively affect the Organization images.
Hb3 User satisfaction will positively affect the Organ ization performance.
Hb4 User satisfaction will positively affect the Organ ization images.
3.2 Variables
Input level measures the quality of system itself, the quality of produced information, and the quality of supporting services for the IS utilization of users as shown in Table 2. This research defined the system quality as an evaluating factor consisted of indicators such as convenience, reliability, security, and response time based on previous researches [9, 14, 15, 25]. Information quality is consisted of indicators such as, accuracy, timeliness, usability, sufficiency, ease of understanding, reliability based on the previous researches [9, 24, 26, 29]. Service quality as an evaluating factor consisted of indicators like responsiveness of IS provider, reliability of IS provider, professionalism of IS providers, etc. [9, 18, 25, 27, 28].
ISSN: 1992-8645 www.jatit.org E-ISSN: 1817-3195 degree of getting help with the overall business
through IS and consist of overall satisfaction, work results satisfaction, improvement of job satisfaction as indicators like Table 2. DeLone & McLean (2003) proposed a model of process perspective that user improved individual task performance ultimately impacts on the achievement of organizational goals through utilizing the information produced by the IS. Hamilton & Chervany(1981) also identified that individual performance by IS will be led to organization’s goals.
This research set up the Output level as organization performance and organization images. It is important for e-government systems to secure legitimacy for policy promotion by improving public images because public organizations are operated by national tax [7]. Therefore, the improvement of public images for informatization policy of public organizations can be seen as one of the important performance variables. Public organizations can lead public trust and active supports from the people and improve public images by using successful IS [31] (Viteritti, 1990). The organization performance is defined as evaluating factors focused on the degree of contribution to organization performance and consists of processing capabilities, improvement of competence, reduced workload, and improvement of business knowledge as indicators. Performance of public organizations takes precedence over the public interest and has impacts national-wide in the long-terms, not short-term performance-oriented. In addition, to pursue side effect and the maximization of synergy effect is different from the private organization that pursues the maximization of short-term profits in short-terms of view of the entire society. Brewer & Seldon (2000) defined the performance of public organization as multi-dimensional concept that is made up with efficiency, which is effect from administrative and operating functions, effectiveness, which means the achievement and
quality of service, satisfaction, and public image. Accordingly, organization images can be seen as evaluating factors focused on the degree of improvement of organization image and are made up Informatization effect, reliability and recognition improvement as Table 2.
3.3 Data
Based on derived evaluation indicators, this study developed a questionnaire to target officers in the Employment Support Centers in Korea government. Question items are listed on Table 2. The survey was conducted for total 392 public officers who are responsible for the employment support using WORKNET. They answered survey questions about 28 indicators and 150 (38.3%) of the entire survey questionnaire were valid.
4. ANALYSIS AND RESULTS
This research conducted the covariance structure analysis for hypothesis testing by using Amos 18.0.
4.1 Validity and Reliability Test of Evaluation Indicators
Exploratory factor analysis is a technique to identify whether there are any factors or any relationships within the collected samples. This research extracted factors using the principal component analysis of SPSS v18.0. We used Varimax method as the method of factors rotation and chose factors which Eigen value is larger than 1.0. We regarded factors as significant if the factor loading is larger than 4.0 as Table 3.
[image:4.612.66.549.602.725.2]Cronbach's alpha coefficient is a technique to analyze the causality of respondents on indicators of variables. If Cronbach's alpha coefficient is larger than 0.6, there is no consistency problem. As the analysis result, there are no consistency problems from each factors because alpha coefficient of most factors recorded larger than 6.0 as Table 4.
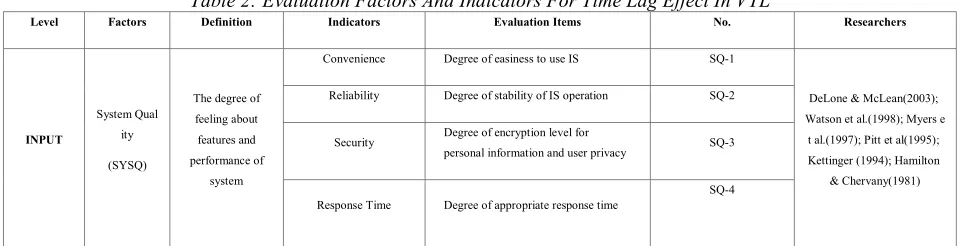
Table 2: Evaluation Factors And Indicators For Time Lag Effect In VTL
Level Factors Definition Indicators Evaluation Items No. Researchers
INPUT
System Qual ity
(SYSQ)
The degree of feeling about features and performance of
system
Convenience Degree of easiness to use IS SQ-1
DeLone & McLean(2003); Watson et al.(1998); Myers e
t al.(1997); Pitt et al(1995); Kettinger (1994); Hamilton
& Chervany(1981) Reliability Degree of stability of IS operation SQ-2
Security Degree of encryption level for
personal information and user privacy SQ-3
Response Time Degree of appropriate response time
ISSN: 1992-8645 www.jatit.org E-ISSN: 1817-3195
Information Quality
(INFQ)
The degree of feeling about features and contents of information
Accuracy Degree of accuracy of the information
provided by IS IQ-1
Lim et al.(2008); Delone & McLean(2003); Rainer & W atson(1995); Olson & Lucas(
1982) Timeliness Degree of appropriate time for the
information provided by IS IQ-2
Usability Degree of useful information
provided by IS IQ-3
Sufficiency Degree of coverage of the information
provided by IS IQ-4
Ease of understanding Degree of easiness to understand the
information provided by IS IQ-5
Reliability Degree of trust in the information
provided by IS IQ-6
Service Qual ity
(SERVQ)
The degree of feeling about services provided
by IS provider
IS Provider Responsiven ess
Degree of interaction speed for the
service by the IS provider SQ-1 DeLone & McLean(2003); K ettinger (1994); Myers et al. (1997); Parasuraman et. al(1 998); Pitt and Watson(1995),
Lee et(SAAS) IS Provider Reliability Degree of belief on the IS provider SQ-2
IS Provider Expertise Degree of feeling on the expertise of
the IS provider SQ-3
PROCESS
User Satisfac tion
(USAT)
The degree of individual satisfaction on
work
Overall satisfaction Overall satisfaction of business processes
through the utilization of IS PU-1 Jeong et. al (2008); Doll & T orkzadeh(1998); Bailey & Pe arson(1983); Ives et al.(1983 ); Baroudi & Orlikowski(198
8) Work results satisfaction Degree of satisfaction on the work results
through the utilization of IS PU-2
Improvement of job satis faction
Degree of improved jab satisfaction
through the utilization of IS PU-3
Individual Pe rformance
(INPER)
The degree of feeling which performance appeared from
overall tasks
Overall performance Degree of overall job performance
through the utilization of IS PS-1
DeLone & McLean(2003); K ettinger (1994); Myers et al.( 1997); Parasuraman et. al(1 998); Pitt and Watson(1995) Business processing cap
abilities
Degree of improved business processing
capabilities through the utilization of IS PS-2
Work speed Degree of accelerated speed of work
through the utilization of IS PS-3
Efficiency Degree of increased business efficiency
through the utilization of IS PS-4
Business linkage
Degree of the smoother on work linkage with other institutions through the utilization of IS
PS-5
OUTPUT
Organization Performance
(ORPER)
The degree of improved tasks, capabilities, and knowledge across the organization
Processing capabilities Degree of service processing capabilities
after the introduction of IS BP-1
Chung and Jung (2003); Lim et al.(2008); Kim et al.(2003
); Woodruff(1980) Improvement of compete
nce
Degree of improved competence of the
organization after the introduction of IS BP-2
Reduced workload Degree of a reduction in organization
workload after the introduction of IS BP-3
Improvement of busines s knowledge
Degree of improved knowledge of the business after the introduction of IS
ISSN: 1992-8645 www.jatit.org E-ISSN: 1817-3195
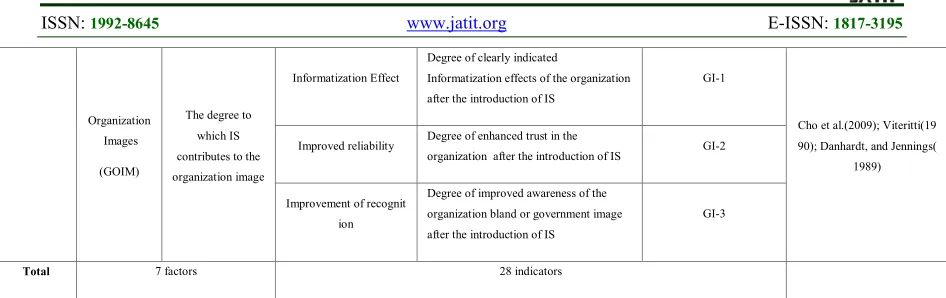
Organization Images
(GOIM)
The degree to which IS contributes to the organization image
Informatization Effect
Degree of clearly indicated
Informatization effects of the organization after the introduction of IS
GI-1
Cho et al.(2009); Viteritti(19 90); Danhardt, and Jennings(
1989) Improved reliability Degree of enhanced trust in the
organization after the introduction of IS GI-2
Improvement of recognit ion
Degree of improved awareness of the organization bland or government image after the introduction of IS
GI-3
[image:6.612.70.543.70.219.2]Total 7 factors 28 indicators
Table 3: Validation of evaluation indicators
Individual tas k performanc
e
Information Q uality
System Qual ity
Service Qualit y
Government image
User satis faction
Organizati on task per formance
Individual task perfo rmance
IP_1 0.823 0.07 0.194 0.112 -0.043 0.26 0.19
IP_5 0.836 0.031 0.192 0.213 0.053 -0.025 0.113
IP_2 0.773 0.02 0.151 0.235 0.114 0.093 0.08
IP_3 0.785 0.131 -0.01 0.287 0.002 0.165 0.125
IP_4 0.031 0.783 -0.053 0.102 0.098 0.045 0.049
Information Quality
IQ_1 0.032 0.758 0.08 0.093 0.148 -0.05 0.07
IQ_2 0.155 0.751 0.082 0.014 0.055 -0.106 0.05
IQ_4 -0.007 0.754 0.137 0.061 0.1 -0.114 0.115
IQ_3 -0.066 0.732 -0.024 0.018 0.18 0.225 -0.054
IQ_5 0.073 0.614 -0.033 -0.047 0.242 0.064 -0.185
IQ_6 0.107 0.069 0.812 0.237 0.121 0.032 0.18
System Quality
SQ_2 0.15 0.125 0.747 0.373 -0.021 0.123 0.091
SQ_1 0.324 -0.059 0.588 0.324 0.049 0.219 0.103
SQ_4 0.191 0.082 0.246 0.852 0.077 0.118 0.124
SQ_3 0.098 0.044 0.182 0.808 0.011 0.215 0.194
Service Quality
SERVQ_
1 0.336 0.039 0.201 0.803 0.035 0.058 0.158
SERVQ_
2 0.23 0.095 0.211 0.769 0.025 0.189 0.271
SERVQ_
4 0.213 0.065 0.226 0.827 -0.037 0.074 0.083
SERVQ_
ISSN: 1992-8645 www.jatit.org E-ISSN: 1817-3195
Table 4: Validation Of The Reliability Of Evaluation Indicators
Level Factors
No. of
Indicators
Cronbach’s Alpha
OUTPUT
Organization performance 4 .814
Organization image 3 .844
PROCESS
Individual performance 5 .939
User satisfaction 3 .866
INPUT
System quality 4 .892
Information quality 5 .845
Service quality 3 .848
4.2 Causality Test of Time Lag Effect in VTL
Confirmatory factor analysis is an analysis technique to identify whether the collected data fit to the model or not and the degree of causality relationship. This technique is useful for validity evaluation on indicators of specific concept. For the validation of the causality in VTL level, this research constructed the causal model of I-P-O structure as Figure 3.
As shown in Table 5, this research considered that reliability and validity were secured because the composite reliability and average variance estimate for measuring internal consistency of indicators are in acceptable level. In the evaluation of model fit, GFI(0.782), AGFI(0.737), NFI(0.769) were sufficient for recommendation index but
x2/df=1.766, CFI(0.883), TLI(0.868), RMR(0.045), RMSEA(0.072), and other indexes were closer to recommendation index. Therefore, this research considered that there is no significant in estimating relationship between variables given the complexity of the model study [3, 12, 13].
[image:7.612.313.528.462.715.2]As a result of the causality analysis, this research demonstrated that individual task performance through the introduction of IS leads to organization performance as Figure 4 and Table 6.
Figure 3: The Causal Model Of I-P-O Structure Government image
GI_1 0.018 0.253 0.027 -0.021 0.87 0.001 0.015
GI_2 0.034 0.241 0.043 0.075 0.888 -0.032 0.037
GI_3 0.176 -0.034 0.218 0.349 0.004 0.655 0.08
User satisfaction
US_3 0.197 -0.005 0.238 0.149 -0.08 0.792 0.144
US_2 0.523 0.043 0.146 0.252 -0.029 0.542 0.315
US_1 0.206 0.016 0.165 0.127 -0.003 0.089 0.844
Organization perfor mance
OP_3 0.107 0.039 0.219 0.215 0.016 0.102 0.824
OP_2 0.23 0.003 0.052 0.416 0.001 0.149 0.695
OP_4 0.134 0.058 0.169 0.194 -0.041 0.314 0.718
Eigenvalues 3.497 3.669 2.648 4.307 2.22 1.853 2.375
R^2(%) 12.488 13.104 9.456 15.382 7.928 6.617 8.484
ISSN: 1992-8645 www.jatit.org E-ISSN: 1817-3195
Figure 4: Results Of The Causality Analysis Between Evaluation Factors
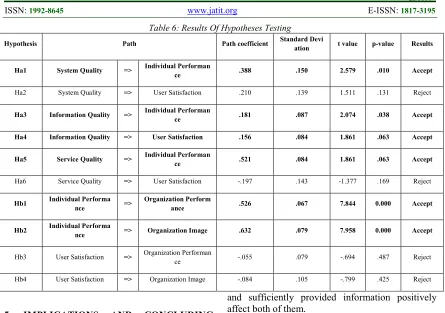
From the results, we can see that except Ha2, Ha6, Hb3 and Hb4, all other hypotheses are statistically accepted.
Table 5: Results of confirmatory factor analysis
Construct Indicator Estimate SE CR AVE
System Qu
ality
SQ_1 0.879 0.129
0.929 0.77
SQ_2 0.795 0.203
SQ_3 0.747 0.246
SQ_4 0.787 0.205
Informatio
n Quality
IQ_1 0.746 0.289
0.891 0.58
IQ_2 0.773 0.288
IQ_3 0.678 0.394
IQ_4 0.696 0.366
IQ_5 0.699 0.45
IQ_6 0.689 0.451
Service Qu
ality
SERVQ_1 0.696 0.394
0.856 0.67
SERVQ_2 0.765 0.327
SERVQ_3 0.836 0.165
Individual
Performan
ce
IP_1 0.875 0.116
0.953 0.80
IP_2 0.789 0.186
IP_3 0.873 0.15
IP_4 0.806 0.171
IP_5 0.782 0.214
User Satisf
action
PU_1 0.734 0.191
0.915 0.78
PU_2 0.847 0.112
PU_3 0.729 0.192
Organizati
on Perform
ance
OP_1 0.751 0.212
0.913 0.73
OP_2 0.802 0.178
OP_3 0.741 0.196
OP_4 0.703 0.266
Governme
nt Image
GI_1 0.755 0.297
0.869 0.69
GI_2 0.814 0.191
GI_3 0.697 0.285
Fit index
X2=593.440(df=336), X2/df=1.766, p-value=0.000, GFI
=0.782, AGFI=0.737, RMR=0.045, RMSEA=0.072, CFI
ISSN: 1992-8645 www.jatit.org E-ISSN: 1817-3195
Table 6: Results Of Hypotheses Testing
Hypothesis Path Path coefficient Standard Devi
ation t value p-value Results
Ha1 System Quality => Individual Performan
ce .388 .150 2.579 .010 Accept
Ha2 System Quality => User Satisfaction .210 .139 1.511 .131 Reject
Ha3 Information Quality => Individual Performan
ce .181 .087 2.074 .038 Accept
Ha4 Information Quality => User Satisfaction .156 .084 1.861 .063 Accept
Ha5 Service Quality => Individual Performan
ce .521 .084 1.861 .063 Accept
Ha6 Service Quality => User Satisfaction -.197 .143 -1.377 .169 Reject
Hb1 Individual Performa
nce =>
Organization Perform
ance .526 .067 7.844 0.000 Accept
Hb2 Individual Performa
nce => Organization Image .632 .079 7.958 0.000 Accept
Hb3 User Satisfaction => Organization Performan
ce -.055 .079 -.694 .487 Reject
Hb4 User Satisfaction => Organization Image -.084 .105 -.799 .425 Reject
5. IMPLICATIONS AND CONCLUDING
REMARKS
In this article we tried to verify the existence of VTL using a causal model by applying it with WORKNET system data. By empirical study for the causal model we can know that there are causal relationships among layers, which means there are time lags between VTL layers. By receiving necessary information service directly to individual tasks, system users can improve their task performance and it positively affects organizational performance and improvement of organization image. However, user satisfaction does not affect organizational performance and improvement of organization image in this case.
As the results of the hypotheses tests on the causal model in VTL layers in this case, this research found the following results.
First, the system quality affects individual performance but does not affect user satisfaction. WORKNET system users felt that performance appears by doing tasks using the system. However, this does not affect the user satisfaction because public officers have to use WORKNET system for their routine tasks as a job.
Second, information quality affects both individual performance and user satisfaction. Accurate, timely, useful, understandable, reliable,
and sufficiently provided information positively affect both of them.
Third, service quality affects individual performance but does not affect user satisfaction. Appropriate supports from IS providers positively affect the individual performance by improving capacity of task processing. However, this does not affect the user satisfaction because system users tend to take supports from IS providers for granted.
Fourth, individual performance affect to organization performance and improvement of government image. Organizational performance showed a positive affect such as faster organizational handling capabilities and improvement of the business knowledge by improving task processing speed and task processing capacity in individual level. In addition, improvement of government image shows positive affects by improving the overall task performance.
Fifth, user satisfaction does not affect to both organization performance and improvement of government image. The reason why user satisfaction does not affect is that WORKNET system is a mandatory system forced to be used and is not a voluntary system.
ISSN: 1992-8645 www.jatit.org E-ISSN: 1817-3195 innovative systems especially like e-government
systems.
This research was conducted in a specific e-government system in Korea. There might be difference casual relation paths according to the types of e-government systems. However, it is meaningful to show the existence of the causality between the layers. Further researches might be followed in different systems and more detailed research and verification about the time lags in the layer would be performed.
6. ACKNOWLEDGEMENT
This article was revised based on the dissertation thesis of Lee (2011)[20].
REFERENCES:
[1] Bailey, J. E., & Pearson, S. W., “Development of a tool for measuring and analyzing computer user satisfaction”, Management Sscience, Vol. 29, No. 5, 1983, pp. 530-545. [2] Baroudi. J. J, Orlikowski. W. J, "A Short Form
Measure of User Information Satisfaction: A psychometric Evaluation and Notes on Use",
NYU Working Paper, 1988, pp. 87-118. [3] Bassellier. G., Benbast, I., & Reich, B. H.,
"The Influence of Business Managers IT Competence on Championing IT", Information Systems Research, Vol. 14, No. 4, 2003, pp. 317-336.
[4] Brewer. G. A., Seldon, S. C., "Antecedents affecting public service motivation", Personnel Review, Vol. 36 No. 3, 2000, pp. 356-377. [5] Cho N. J., G. G. Lim, D. C. Lee, “An Analysis
of the Time-Lag Effects on the Investment of G4C E-Government System by analyzing DB Data”, Journal of Information Technology Applications & Management. Vol.16, No.4, 2009.12, pp. 205-222.
[6] Chung C. K. and J. K. Jung, "Time Lag Elements of Policy Institutional Change ",
Korean Journal of Public Administration, Vol. 41, No. 2, 2003, pp. 194-202.
[7] Cleary. M. C., Peasants, politicians, and producers: the organization of agriculture in France since 1918, Cambridge University Press, 1989
[8] Davis, F.D., “Perceived Usefulness, Perceived Ease of Use, and User Acceptance of Information Technology”, MIS Quarterly, Vol.13, No.31, 1989, pp. 319-340.
[9] DeLone. W. H., McLean E. R., "The DeLone and McLean Model of Information Systems Success: A Ten-Year Update", Management Information Systems, Vol. 19, No. 4, 2003. pp. 9-30.
[10]Denhardt, R. B., and Jennings, E. T., “Image and integrity in the public service”, Public Administration Review, Vol. 49, No. 1, 1989, pp. 74-77.
[11]Doll, W. J., & Torkzadeh, G. (1998). “Developing a multidimensional measure of system-use in an organizational context”,
Information & Management, Vol. 33, No. 4, 1998, pp. 171-185.
[12]Fornell, C., & Larcker, D. F, "Evaluating
Structural Equation Models with
Unobservable Variables and Measurement Error", Journal of marketing research, Vol 18, No. 1, 1981, pp.39-50.
[13]Gefen. D., Straub. D. W., & Boudreau. M., " Structural equation modeling and regression: Guidelines for research practice",
Communications of the Association for Information System, Vol. 4, No. 7, 2000, pp.1-77.
[14]Goodhue. D. L., Thompson. R. L., "Task-Technology Fit and Individual Performance",
MIS Quarterly, Vol. 19, No. 2, 1995, pp. 213-226.
[15]Hamilton. S., Chervany. N. L., "Evaluating Information System Effectiveness - Part I: Comparing Evaluation Approaches", MIS Quarterly, Vol. 5, No. 3, 1981, pp. 55-69. [16]Ives, B., M. H. Olson, and J. J. Baroudi. "The
measurement of user information satisfaction."
Communications of the ACM, Vol. 26, No.10, 1983, pp. 785-793.
[17]Jeong K. H., H. J. Kim and J. H. Ahan, "A Case Study on Time Delay Effect on IT Performance ", Proceedings of 2008 Korea Management Information Systems Conference, 2008, pp. 827-832.
[18]Kettinger. W. J., "National infrastructure diffusion and the US information super highway“, Information & Management, Vol. 27, Iss. 6, 1994, pp. 357-368.
[19]Kim Gil Seon, Lee Won Jun , Kwon Seong Hyeon, “A study on the development of model to measure value chain performance”, Sogang Journal of Business, Vol. 14 , No. 2 , 2003, pp. 23-51.
[20]Lee D.C., A Study of Vertical and Horizontal
Time Lag on Performance of Public
Information System, Hanyang University
ISSN: 1992-8645 www.jatit.org E-ISSN: 1817-3195 [21]Lee S.J., S.B. Park, G.G. Lim, “Using
balanced scorecards for the evaluation of Software-as-a-service,” Information & Management, Vol. 50, No. 7, 2013, pp. 553-561.
[22]Lim G.G., D. C. Lee, “A Case of Evaluation of the G2B System by Analyzing Operational DB Data”, Journal of Korea Society of IT Services, Vol.11, No.2, 2012, pp. 243-258,
[23]Lim G.G., D. C. Lee, E. C. Robert, “A Comparative Study on The Time Lag Effect of Investments in Innovative Information Systems”, Journal of Theoretical and Applied Information Technology, Vol. 77, No. 3, 2015, pp. 328-341.
[24]Lim G.G., N. J. Cho, and D.C. Lee, “An Analysis of the Time-lag Effects on the Investment of Informatization for Industrial Human Resources”, Information Systems Review, Vol. 10, No. 2, Dec. 2008, pp. 133-153.
[25]Myers. B. L., Kapelman. L. A. and Prybutok. V. R., "A Comprehensive Model for Assessing the Quality and Productivity of the Information Systems Function: Toward a Theory for Information Systems Assesment", Information Resource Management Journal, Vol 10, No. 1, 1997, pp.6~25.
[26]Olson, M. H., & Lucas Jr, H. C., "The impact of office automation on the organization: some implications for research and practice."
Communications of the ACM, Vol. 25, No.11, 1982, pp. 838-847.
[27]Parasuraman, A., Zeithaml, V. A., & Berry, L. L., “Servqual”, Journal of Rretailing, Vol. 64, No. 1, 1988, pp. 12-40.
[28]Pitt. L. F., Watson. R. T., "Service Quality: A
Measure of Information Systems
Effectiveness", MIS Quarterly, Vol. 19, No. 2, 1995, pp. 173-187.
[29]Rainer, R. K. and H. J. Watson, "What does it take for successful executive information systems?", Decision Support Systems, Vol. 14, No.2. 1995, pp. 147-156.
[30]Swanson, E. B., "Information Systems Innovation among Organizations",
Management Science, Vol. 40, No. 9, 1994, pp. 1069-1092.
[31]Viteritti. J. P., "THE CITY AND THE CONSTITUTION: A Historical Analysis of Institutional Evolution and Adaptation",
Journal of Urban Affairs, Vol. 12, Iss. 3, 1990, pp. 221–236.
[32]Watson R. T., Leyland F. Pitt and C. Bruce Kavan, “Measuring Information Systems Service Quality: Lessons from Two Longitudinal Case Studies”, MIS Quarterly, Vol. 22, No. 1 (Mar., 1998), pp. 61-79. [33]Woodruff, C. K., “Data processing people—
are they satisfied/dissatisfied with their jobs?”,
![Figure 1: Time Lag Based Performance Evaluation Framework For Information Systems [23]](https://thumb-us.123doks.com/thumbv2/123dok_us/8908989.958283/2.612.318.534.149.309/figure-time-based-performance-evaluation-framework-information-systems.webp)