WRL
Research Report 88/4
Measured Capacity
of an Ethernet:
Myths and Reality
research relevant to the design and application of high performance scientific computers. We test our ideas by designing, building, and using real systems. The systems we build are research prototypes; they are not intended to become products.
There is a second research laboratory located in Palo Alto, the Systems Research Cen-ter (SRC). Other Digital research groups are located in Paris (PRL) and in Cambridge, Massachusetts (CRL).
Our research is directed towards mainstream high-performance computer systems. Our prototypes are intended to foreshadow the future computing environments used by many Digital customers. The long-term goal of WRL is to aid and accelerate the development of high-performance uni- and multi-processors. The research projects within WRL will address various aspects of high-performance computing.
We believe that significant advances in computer systems do not come from any single technological advance. Technologies, both hardware and software, do not all advance at the same pace. System design is the art of composing systems which use each level of technology in an appropriate balance. A major advance in overall system performance will require reexamination of all aspects of the system.
We do work in the design, fabrication and packaging of hardware; language processing and scaling issues in system software design; and the exploration of new applications areas that are opening up with the advent of higher performance systems. Researchers at WRL cooperate closely and move freely among the various levels of system design. This allows us to explore a wide range of tradeoffs to meet system goals.
We publish the results of our work in a variety of journals, conferences, research reports, and technical notes. This document is a research report. Research reports are normally accounts of completed research and may include material from earlier technical notes. We use technical notes for rapid distribution of technical material; usually this represents research in progress.
Research reports and technical notes may be ordered from us. You may mail your order to:
Technical Report Distribution
DEC Western Research Laboratory, UCO-4 100 Hamilton Avenue
Palo Alto, California 94301 USA
Reports and notes may also be ordered by electronic mail. Use one of the following addresses:
Digital E-net: DECWRL::WRL-TECHREPORTS
DARPA Internet: [email protected]
CSnet: [email protected]
UUCP: decwrl!wrl-techreports
Myths and Reality
David R. Boggs
Jeffrey C. Mogul
Christopher A. Kent
September, 1988
Ethernet, a 10 Mbit/sec CSMA/CD network, is one of the most successful LAN technologies. Considerable confusion exists as to the actual capacity of an Ethernet, especially since some theoretical studies have examined operat-ing regimes that are not characteristic of actual networks. Based on measurements of an actual implementation, we show that for a wide class of applications, Ethernet is capable of carrying its nominal bandwidth of useful traffic, and allocates the bandwidth fairly. We discuss how implementations can achieve this performance, describe some problems that have arisen in existing implementations, and suggest ways to avoid future problems.
This paper was originally published in Proceedings of the SIGCOMM ’88 Symposium on
Communications Architectures and Protocols, ACM SIGCOMM, Stanford, California, August
1988.
Copyright 1988 Association for Computing Machinery
technologies have been designed, and more than a few of these have made it to market;
Ethernet [8] is one of the most successful. There are many factors that influence a choice
be-tween different technologies, including availability, acceptance as a standard, cost per station and per installation, and ease of maintenance and administration. All of these are difficult or impos-sible to quantify accurately. Performance characteristics, on the other hand, are easier to quan-tify, and can thus serve as the basis for religious debates even though the potential performance of a LAN technology may have very little to do with how useful it is.
Considerable confusion exists as to the actual capacity of an Ethernet. This capacity can be determined either by measurement or by analysis. Measurements of intrinsic Ethernet perfor-mance (its perforperfor-mance in the limiting case) are fairly meaningless because, at least until recently, most feasible experiments could only measure the performance of host implementations and interfaces, not of the Ethernet per se. If no experiment can ‘‘see’’ the intrinsic performance of the network, then applications probably cannot see it either, and intrinsic performance there-fore does not matter. Analyses, on the other hand, have tended to concentrate on the intrinsic performance; first, because software and interface design is too hard to analyze, and second, because Ethernet performance is ‘‘interesting’’ only at very high loads. Therefore, most theoretical studies have examined operating regimes that are not characteristic of actual net-works, and their results are also of limited utility in comparing network technologies.
Ethernet works in practice, but allegedly not in theory: some people have sufficiently misun-derstood the existing studies of Ethernet performance so as to create a surprisingly resilient mythology. One myth is that an Ethernet is saturated at an offered load of 37%; this is an incor-rect reading of the theoretical studies, and is easily disproved in practice. This paper is an at-tempt to dispel such myths.
2. What theoretical studies really say
The literature is full of theoretical analyses of carrier-sense multiple access (CSMA), CSMA with collision detection (CSMA/CD), and related access mechanisms. Most of these analyses rely on simplifying assumptions, either for tractability or simply to avoid drowning in the variety of results that would come from exploring the entire parameter space. In spite of the simplifica-tions, these analyses often require mathematical machinery that render them relatively inacces-sible to the average practitioner of computer networks.
This inaccessibility, coupled with potential inapplicability due to simplifying assumptions, has led unwary readers into misunderstanding the theoretical studies. As a result, a substantial mythology has arisen to obscure the true properties of the Ethernet.
In this section we examine the theoretical literature pertaining to the Ethernet, and we attempt to dispel some of the mythology by pointing out the applicability of these studies.
2.1. Parameters affecting performance
The performance of an Ethernet depends upon a variety of parameters, in addition to those fixed by the specification. We assume that the reader is familiar with the principles of operation of an Ethernet, specifically the CSMA/CD mechanism [17].
The fixed parameters of the standard Ethernet are described in the specification [8]. These include the following:
•Bit rate: The standard Ethernet operates at a bit rate of 10 Mbits/second. Some studies in the literature describe the ‘‘experimental’’ Ethernet, which operated at 3 Mbits/second [17]. We will assume the standard Ethernet unless otherwise in-dicated.
•Maximum propagation delay: the maximum round trip delay between any two transmitters is defined to be 464 bit times. This is equivalent to about 5 km of coax cable, much more than a transceiver can drive, but a conceivable delay when repeaters and transceiver multiplexors are used.
•Maximum jam time: a transmitter which detects a collision continues to transmit for 32-48 more bit times to insure that the other participants reliably detect the col-lision.
•Slot time: an upper bound on the acquisition time of the network. It must be larger than the sum of the maximum round trip propagation time plus the maximum jam time. This is defined to be 512 bit times (51.2 microseconds).
•Minimum packet length: The shortest packet must be no shorter than the slot time, so that if there is a collision it is detectable. This leads to a minimum length of 64 bytes, including a 14-byte header and a 4-byte ‘‘frame check sequence.’’
•Maximum packet length: This limit, 1518 bytes, bounds the size of buffers that receivers must maintain, and also helps to limit the average access time.
•Persistence: The Ethernet is a 1-persistent CSMA/CD protocol, so-called because a host that becomes ready to transmit when the channel is busy will transmit as soon as the channel is free, with probability 1. Other CSMA/CD protocols have been analyzed; the non-persistent protocol waits a random time if the channel is busy. The general case is a p-persistent protocol which, after a busy channel becomes free, initiates transmission immediately with probability p, and otherwise waits before trying to transmit. Non-persistent protocols lead to higher delays at low loads but perform better at high loads.
In addition to the fixed parameters, performance depends on several parameters determined by the users of the network. These are not entirely independent variables, since intelligent im-plementors will choose them so as to make best use of the Ethernet. Further, no single choice of these parameters can be viewed as typical; they vary tremendously based on the applications in use.
•Packet length distribution: Within the limits of the Ethernet specification, there is substantial freedom to choose packet lengths. In those networks that have been ob-served, packet length distributions are strongly bimodal, with most packets either near minimum length or near maximum length [20, 11].
•Actual number of hosts: The number of hosts on actual Ethernets varies tremen-dously, and usually is limited for logistical reasons such as the ease with which a single network can be administered. Typical installations have on the order of tens of hosts to a couple of hundred hosts.
•Arrival rate of packets: Although the Ethernet allows a host to transmit a minimal length packet every 67.2 microseconds, most hosts are unable to transmit or receive more than a few hundred packets per second; this effectively limits the arrival rate of packets, and it also places a lower bound on the value of average channel access time that actually affects performance.
•Actual length of cable: The actual length of an Ethernet may be far shorter than the specification allows. It is not unusual for installations to use a few hundred meters. This means that collisions are detected far sooner than the worst-case propagation delay would imply; channel acquisition may resume as soon as a few microseconds after the beginning of a failed attempt, not the worst-case 51.2 microseconds implied by the specification.
Some of the theoretical analyses make assumptions to provide a simplified model of reality. These may be hard to relate to actual parameters of a real network:
•Distribution of packet arrivals: Most theoretical studies assume a simple distribu-tion for the arrival of packets, typically Poisson. Traffic on real networks is seldom so well-behaved; often, there are brief bursts of high load separated by long periods of silence [20].
•Infinite population: An assumption that even if hosts are blocked waiting for the channel, new packets will arrive for transmission.
•Slotting: An assumption that there is a master slot-time clock, with transmissions beginning only at slot boundaries. In a real Ethernet, transmission starts may be separated by less than the slot time; Ethernet is therefore ‘‘unslotted.’’
•‘‘Balanced star’’ topology: An assumption that all hosts are separated from each other by the maximum legal distance; this is essentially impossible in a real instal-lation.
•Fixed packet size: It is often much easier to analyze a protocol assuming fixed packet sizes; frequently, the worst-case (minimal packet size) is used.
2.2. How performance is measured
The performance of a network, as with most interesting computer systems, cannot be quan-tified with a single dimension. Theoretical studies have tended to examine a small set of measures, both for analytic tractability and because it is hard to understand what to measure without knowing what applications are involved.
Performance measures include:
•Average delay: the average time it takes to send a packet, measured from the time the host first wishes to acquire the channel.
•Throughput: the fraction of the nominal network bandwidth that is actually used for carrying data. Packet headers are considered useful data in calculating this value.
•Channel capacity: the maximum achievable throughput for a given set of parameters. Capacity is a function of such parameters as packet length and network length.
•Fairness: in a fair network, each host with pending traffic should have an equal probability of acquiring the channel (this is not an equal share of the bandwidth, since hosts use differing packet sizes).
•Stability: if the throughput actually drops at high loads then the network is said to be unstable in that region.
2.3. Definitions of offered load
Performance measures are usually described as a function of some parameter of the model;
offered load is the most common. Several different definitions of offered load are used in the
literature.
Another definition of offered load is the average number Q of hosts waiting to transmit. This concept is what underlies the binary exponential backoff mechanism used to delay retransmis-sion after a colliretransmis-sion. If Q hosts are waiting to transmit, one would like each to attempt trans-mission during a given slot with probability 1/Q. Essentially, the backoff mechanism is trying to estimate Q.
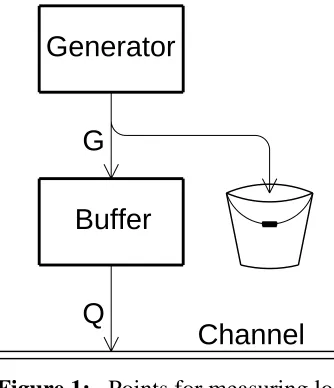
Although G and Q are both described as the offered load on the network, they are not the same. Q is the offered load as seen by the network, while G is the offered load provided by an idealized customer of the network. Figure 1 depicts this schematically; a generator is providing packets at some rate, which are being passed via a buffer to the channel; if the buffer is full when a packet is generated, the packet is discarded. G is measured at the output of the generator, whereas Q is measured at the output of the buffer, and so does not count the load contributed by the discarded packets.
Generator
Buffer
Channel
G
[image:9.612.236.403.257.451.2]Q
Figure 1: Points for measuring load
While G, at first glance, seems to be a more useful measure from the point of view of the user, in most real systems figure 1 is not an accurate model, because flow-control mechanisms ensure that packets are not discarded in this way. Flow control between the buffer and the generator is the norm in most applications, except for those, such as packet voice, that are more sensitive to response time than throughput.
Because it is much harder to model the packet arrival distribution of flow-controlled applica-tions, many of the theoretical studies analyze for response time as a function of G, rather than analyzing for throughput as a function of Q.
2.4. A brief guide to the theoretical studies
We do not describe the important early work on CSMA without collision detection, such as the papers by Tobagi and Kleinrock [13, 24], and by Metcalfe [15, 16]. The interested reader may refer to these papers for more information.
2.4.1. Metcalfe and Boggs, 1976
In the original paper on the Ethernet [17], Metcalfe and Boggs provide a simple analysis of the 3Mbit/second ‘‘experimental’’ Ethernet invented at Xerox PARC during 1973 and 1974. They compute the throughput of the network as a function of packet length and Q. The throughput remains near 100% for large packets (512 bytes in this case), even with Q as large as 256, but drops to approximately 1/e (37%) for minimal-length packets.
2.4.2. Almes and Lazowska, 1979
Almes and Lazowska [1] continue the analysis of the experimental Ethernet. They present values of response time as a function of G. They show that for small packet sizes, the response times stays under 1 millisecond for G less than 75%; as G increases much past that point, the response time is asymptotically infinite. For larger packet sizes, the knee in the curve comes at a higher offered load, but the low-load response time is worse because a single long packet ties up the network for almost a millisecond. They also point out that as the network gets longer, the slot time gets larger, and the response time is proportionately worse. The performance of the network is thus quite sensitive to the actual slot time.
In addition to a theoretical analysis, Almes and Lazowska simulated the performance of an Ethernet as a way of avoiding some of the simplifying assumptions required to keep the analysis tractable. With fixed packet sizes, the simulation agrees closely with the analytical results. They
1
also simulated a mixture of short and long packets , which leads to somewhat worse response times than for a fixed packet size of the same average length. More importantly, the standard deviation of the response time increases much faster than the mean with increasing load, which could be a problem for some real-time applications. As with other performance measures, the variance in response time is quite sensitive to the effective slot time.
2.4.3. Tobagi and Hunt, 1980
Tobagi and Hunt [25] provide a more extensive analysis of the throughput-delay characteris-tics of CSMA/CD networks. Many of the results in this paper are for non-persistent and p-persistent protocols, and so cannot be blindly applied to Ethernets, but it contains a detailed analysis of the effect of bimodal packet-size distributions on throughput, capacity, and delay.
This analysis starts with three parameters: the lengths of the ‘‘short’’ and ‘‘long’’ packets, and the fraction of the packets that are short. The results show that when only a small fraction of the packets are long, the capacity of the network approaches that which can be obtained using a long fixed packet size. Unfortunately, the fraction of the channel capacity available to short packets drops rapidly as the fraction of long packets goes up; this, in turn, increases the average delay for short packets (which are now waiting for long packets to go by, instead of for collisions to be resolved).
1The ‘‘long’’ packets in this study were only 256 bytes long, although the Pup protocol suite [4] used on the
A large fraction of long packets does allow a somewhat higher total throughput before delays become asymptotically infinite. Further, the delays experienced by the long packets decrease, since fewer total packets are being sent and the amount of time spent resolving collisions is lower.
2.4.4. Bux, 1981
Bux [5] attempts a comparative evaluation of a variety of LAN technologies, including bus systems such as Ethernet, and token-ring systems. Such a comparison has value only if the measure used to distinguish the performance of various systems is relevant to actual users. The measure used in this study is the average packet delay as a function of throughput, and it appears to be biased against Ethernet in that it stresses real-time performance over bulk-transfer perfor-mance more than measures used in other studies.
Since throughput is always less than the offered load, curves of delay versus throughput are steeper than those relating delay to offered load, and show knees at lower values of the inde-pendent variable. Referring to figure 1, throughput is measured not at the output of the
generator or the buffer, but on the network itself. The curves in [5] show knees for CSMA/CD
at throughputs of 0.4, instead of the knees at offered loads of about 0.75. To the unwary, this distinction may not be obvious.
Further, the curves displayed in this study are based on unimodal distributions of packet lengths with means of about 128 bytes. Although Bux has attempted to correct for the effects of analyzing a slotted system, the use only of short packet lengths in this study makes it less ap-plicable to bulk-transfer applications. The comparison favors slotted-ring systems over CSMA/CD systems with equal bandwidth; this is valid only for real-time applications using short packets.
Bux does include an interesting figure that demonstrates the sensitivity of CSMA/CD systems to propagation delay. Packet delays are reasonable even for high throughputs so long as packet lengths are at least two orders of magnitude longer than the propagation delay (expressed in bit-times).
2.4.5. Coyle and Liu, 1983 and 1985
Coyle and Liu [6, 7] refine the analysis of Tobagi and Hunt [25] by using a somewhat more realistic model; specifically, rather than assuming an infinite number of hosts generating an ag-gregate stream of packets with a Poisson distribution, this analysis assumes a finite number of hosts each generating new packets with an exponential distribution. (They analyze non-persistent CSMA/CD, rather than the 1-non-persistent Ethernet.)
2.4.6. Takagi and Kleinrock, 1985
Takagi and Kleinrock [22] analyze a variety of CSMA protocols under a finite-population as-sumption. In particular, they provide an analysis of unslotted 1-persistent CSMA/CD. They solve for throughput as a function of G, and one interesting result of their analysis is that not only does the throughput curve depend on the time to abort transmission after detecting a col-lision, but that for very small values of this parameter, there is a double peak in the curve. In all cases there is a peak at G = 1, corresponding to a load exactly matching the capacity of the network. The second peak, present when collisions are detected quickly, comes at offered loads (G) of 100 or more.
2.4.7. Gonsalves and Tobagi, 1986
Gonsalves and Tobagi [10] investigated the effect of several parameters on performance using a simulation of the standard Ethernet. In particular, they examined how the distribution of hosts along the cable affects performance. Previous studies had assumed the balanced star configura-tion (all hosts separated by the maximum length of the network). This is not a realistic assump-tion, and so in this simulation several other configurations were examined.
If hosts are uniformly distributed along the cable, or if they are distributed in more than two equal-sized clusters, those hosts in the middle of the cable obtain slightly better throughput and delay than those at the ends. If the clusters are of unequal sizes, hosts in the larger clusters get significantly better service. This is because the hosts within a cluster resolve collisions quickly, whereas the collisions between clusters, which take longer to resolve due to the higher separa-tion, are more likely to be a problem for members of the smaller cluster (since there are more ‘‘distant’’ hosts for those hosts than for members of a large cluster).
This is an important result because a number of theoretical analyses explicitly assume that the network is fair by design (for example, that of Apostolopoulos and Protonotarios [2]). Users with real-time applications may find position-dependent unfairness of some unusual Ethernet configurations to be an important effect.
2.4.8. Tasaka, 1986
Tasaka [23] analyzes the effect of buffering on the performance of slotted non-persistent CSMA/CD. As the size of the buffer (measured in packets) increases, fewer packets are dropped due to congestion and thus are retained to use up channel capacity that would otherwise be idle. Increased buffer size leads to higher throughput and average delays at lower offered loads, and causes the knees of these curves to appear at lower offered loads.
2.5. Myths and reality
Although many of the theoretical papers accurately describe the limitations of their ap-proaches, it is still difficult to extract the right lessons from these studies. Thus, many people have learned the wrong lessons, and a variety of myths have been propagated.
Pitfalls for the unwary fall into several categories:
or systems without collision detection. These variations can significantly affect real performance: there are reasons why the Ethernet design is as it is.
•Unrealistic assumptions: for analytic tractability, many analyses usually assume balanced-star configurations, infinite populations, unimodal or constant packet lengths, small packet lengths, no buffering, etc. Many (if not most) real-world Ethernets include a relatively small number of hosts, distributed randomly over a cable shorter than the maximum length, with flow-controlled protocols that generate a bimodal distribution of packet lengths.
•Measuring the wrong dependent variable: if one is building a real-time system, average packet delay (or perhaps the variance of packet delay) is the critical system parameter. If one is building a distributed file system, throughput may be the criti-cal parameter. Since it is not always possible to optimize for both measures simul-taneously, the network designer must keep the intended application clearly in mind.
•Using the wrong independent variable: when comparing two studies, it is impor-tant to understand what the independent variable is. Most studies use some ap-proximation to offered load, but there are real differences in how offered load is defined.
•Operating in the wrong regime: Virtually all of the studies cited in this paper ex-amine the performance of networks at high offered load; that is where the theoreti-cally interesting effects take place. Very few real Ethernets operate in this regime; typical loads are well below 50%, and are often closer to 5%. Even those networks that show high peak loads usually have bursty sources; most of the time the load is much lower. Unless real-time deadlines are important, the capacity of the Ethernet is almost never the bottleneck.
The most well-known myth is that ‘‘Ethernets saturate at an offered load of 37%.’’ This is a fair summary of what happens for certain worst-case assumptions, but has very little to do with reality. As we show in section 3, an Ethernet is quite capable of supporting its nominal capacity under realistic conditions. In section 4, we look at how implementors can achieve these con-ditions.
3. Measurements of a real Ethernet
This section presents measurements of the behavior of an Ethernet under varying combina-tions of packet lengths, network lengths, and number of hosts.
When many hosts are waiting for a long packet to go by on a busy Ethernet, the instantaneous load on the network routinely exceeds its capacity for short periods. Stressing an Ethernet with an unusual steady overload yields insights into how the network handles the usual momentary overloads encountered in normal operation. Therefore, in these tests we attempt to generate a total offered load that continuously exceeds the capacity of the network.
3.1. Previous measurements
Several previous studies have measured the performance of an Ethernet.
Schoch and Hupp [19] reported a number of measurements of the 3 Mbit/second experimental Ethernet. They confirmed that for 512-byte packets, the channel utilization at high offered load stayed near 100% even for 64 hosts, whereas for small packets, the utilization approached 1/e for large numbers of hosts. They also found that even for moderately short packets, the network is stable at high offered load: the throughput does not drop as the load increases.
Gonsalves [9] made additional measurements of the experimental Ethernet in order to evaluate its potential performance for packet voice applications. He measured both throughput and delay as a function of offered load; he also studied how load affects the rate at which packets must be discarded because they cannot be delivered before a specific deadline.
3.2. Measurement environment
All of the hosts used in this experiment are Titans, prototype RISC personal computers built by Digital Equipment Corporation’s Western Research Laboratory. The cycle time of a Titan is 45 nSec; during these tests the machines were executing about one instruction every 1.5 cycles, or about 15 million instructions per second.
The Titan Ethernet controller was designed by one of the authors. It uses the SEEQ 8023/8003 Ethernet chip set with a custom DMA interface to the Titan’s 400 MBit/second ECL backplane. The controller’s transmitter sends one packet and then must be serviced by interrupt code before it can send again. This means that the interrupt service latency puts an upper bound on the number of packets that can be generated per second.
Multiport Repeater Multiport
Repeater Multiport
Repeater
T T T T T T T T T T T T T T T T T T
Multiport Repeater
T T T T T T
Ethernet
1000 Feet 1000 Feet
[image:14.612.145.432.432.511.2]1000 Feet
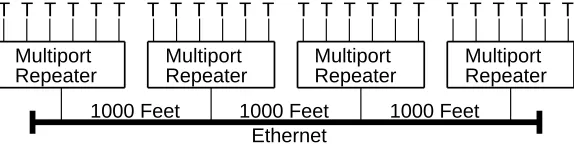
Figure 2: Experimental configuration
During the tests, equal numbers of Titans were connected to one of four DELNI multiport repeaters, whose transceivers were attached to a coaxial cable (see figure 2).
The test software runs in a light-weight operating system written for diagnostics and bootstrap loading. An Ethernet device interrupt takes about 100 microseconds from assertion of interrupt to resumption of user code; this is about 1500 machine instructions.
3.3. Methodology
A full series of tests with N transmitters requires N+1 Titans. One acts as the control machine, coordinating the N generator machines and collecting the data.
it waits 5 seconds, and then transmits packets of the specified length for 20 seconds. During the middle 10 seconds of a test, the Titan measures the performance of its Ethernet transmitter. Next, it waits 5 seconds for the dust to settle and then sends a packet to the control host reporting the statistics gathered during the test. Finally, it goes back and waits for another control packet.
Ethernet
Interrupt Process ProcessUser
[image:15.612.232.413.164.333.2]TQ OQ
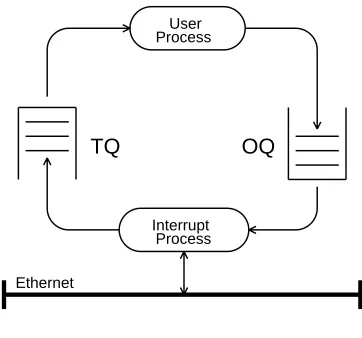
Figure 3: Packet generation process
The program that generates packets for the test load is depicted in figure 3. Each generator Titan allocates 15 packet buffers, builds Ethernet packets in them, and enqueues them on the
transmitted queue (TQ). A user-level process blocks while the TQ is empty. When a packet
buffer appears on the queue, the user process dequeues it, sets the packet length and enqueues it on the Ethernet output queue (OQ). If the transmitter is idle, it is started, otherwise nothing more happens until the next transmitter interrupt. When the hardware interrupts at the end of sending a packet, the interrupt routine dequeues the buffer from the OQ and enqueues it on the TQ. Next, if there is another packet buffer on the OQ, it restarts the transmitter. If the time to send a packet is longer than the time to generate one, then the OQ will usually be full, the TQ will usually be empty, and the user process will be idle some of the time. If the time to send a packet is shorter than the time to generate one, then the OQ will usually be empty, the TQ will usually be full, and the user process will be running all of the time.
During a test, each machine counts the number of bits and the number of packets it success-fully transmits, and accumulates the sum of the transmission delays and the sum of the delays squared. Each generator machine sends these four numbers to the control machine at the end of a test.
When calculating bit rate, each packet is charged with 24 extra byte times of overhead to account for the 9.6 microsecond interpacket gap (12 byte times), the 64-bit sync preamble (8 bytes), and the 32-bit cyclic redundancy checksum (4 bytes). This method of accounting yields a bit rate of 10.0 MBits/sec when the network is carrying back-to-back packets with no collisions.
The following statistics are computed from the data collected during a test:
•Standard deviation of bit rate: computed from the per-host bit rates, this is a measure of how unfair the network is.
•Packet rate: average rate of successful packet generation, summed over the entire network.
•Standard deviation of packet rate: computed from the per-host packet rates, this is another measure of unfairness.
•Transmission delay: average delay from beginning of first attempt to transmit a packet to the end of its successful transmission.
•Standard deviation of delay: computed from the per-packet delays, this indicates how closely one can predict the response time, for a given load.
•Excess delay: the difference between the measured average transmission delay and the ideal delay assuming no collisions, this is a measure of inefficiency.
A series of measurements, involving a test run for each of about 200 combinations of parameter values, takes about three hours. Tests are run after midnight because the Titans are the personal computers that lab members use during the day.
All of the graphs presented in this section show performance measures as a function of the number of hosts, N, involved in the test. For large N or for large packet sizes, the network is the bottleneck, and Q (offered load) is approximately equal to N. When N and the packet size are both small, we could not generate packets fast enough to overload the network, so Q is less than one in these cases.
3.4. Maximum rate attainable between a pair of hosts
We first measured the maximum throughput that could be used for a single ‘‘conversation’’ between a pair of hosts. This was done by setting up one transmitting host and one receiving host, counting the number of packets sent and received, and verifying that all got through. We found that, for all the packet sizes (and thus packet rates) we tried, the receiver could always keep up with the transmitter. In other words, the rate at which a single host can send packets is what limits the throughput between a single pair of hosts (in these tests).
Because receiver performance was not an issue, during subsequent tests each generator host addressed its packets to itself, and disabled its receiver so that it would not waste cycles receiv-ing its own packets.
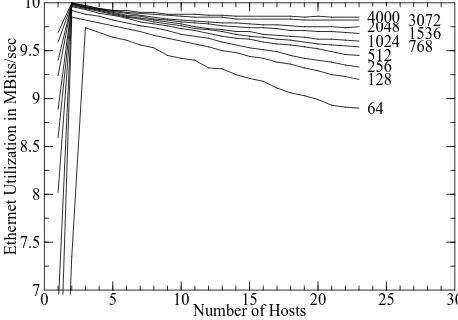
3.5. Fixed length packets on a long net
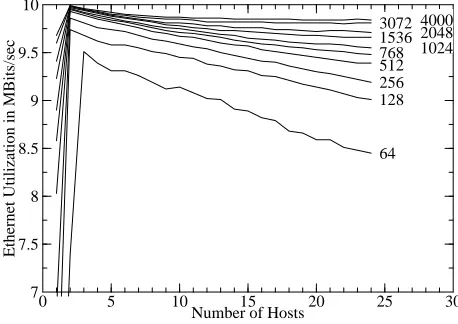
0 5 10 15 20 25 30 Number of Hosts
7 10
7.5 8 8.5 9 9.5
Ethernet Utilization in MBits/sec
[image:17.612.191.420.70.232.2]64 128 256 512 768 1024 1536 2048 3072 4000
Figure 4: Total bit rate
In figure 4, notice that the bit rate increases with increasing packet size. This is because for larger packets, there are fewer packets per second and so less time is lost at the beginning of packets colliding and backing off. Notice also that the bit rate decreases with increasing number of hosts. This is because for larger numbers of hosts, there are more collisions per packet. (For small numbers of hosts and small packet size, bit rate first increases until the offered load ex-ceeds the network capacity.)
Figure 5 is a measure of the variation in bit rate obtained by individual hosts during a test. (The curves are so hard to distinguish that labelling them would have been pointless.) As the number of hosts increases, the fairness increases. The unfairness for small N is due to the intrin-sic unfairness of the Ethernet backoff algorithm. As Almes and Lazowska [1] point out, the longer a host has already been waiting, the longer it is likely to delay before attempting to trans-mit. When N = 3, for example, there is a high probability that one host will continually defer to the other two for several collision resolution cycles, and the measured standard deviation be-comes a sizeable fraction of the mean bit rate.
0 5 10 15 20 25 29 Number of Hosts
0 500
100 200 300 400
[image:17.612.194.422.486.651.2]Std Dev of Utilization in KBits/sec
Figure 5: Standard deviation of bit rate
0 5 10 15 20 25 30 Number of Hosts
0 15000
1000 2000 3000 4000 5000 6000 7000 8000 9000 10000 11000 12000 13000 14000
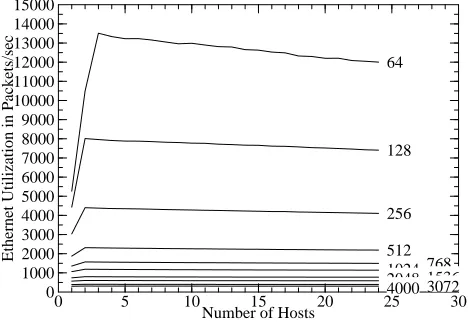
Ethernet Utilization in Packets/sec
64
128
256 512
[image:18.612.158.392.70.232.2]768 10241536 20483072 4000
Figure 6: Total packet rate
The theoretical maximum rate for 64 byte packets is about 14,200 packets per second. Figure 6 shows that we were able to achieve about 13,500 packets per second.
The packet rate peaks at two hosts; no collisions occur until at least three hosts are trans-mitting. There is obviously no contention for the Ethernet when only one host is sending. Be-cause transmitter interrupt service latency is longer than the interpacket gap, two hosts quickly synchronize: each defers to the other and then transmits without contention. When three or more hosts are sending, there are usually two or more hosts ready to transmit, so a collision will occur at the end of each packet.
0 5 10 15 20 25 29 Number of Hosts
0 500
100 200 300 400
Std Dev of Utilization in Packets/sec 64128
[image:18.612.166.397.403.563.2]256 >256
Figure 7: Standard deviation of packet rate
Figure 7 shows the variation in packet generation rate among the hosts in the tests. Note again that the unfairness decreases as the number of hosts increases. The high variance for 64-byte packets may be an experimental artifact.
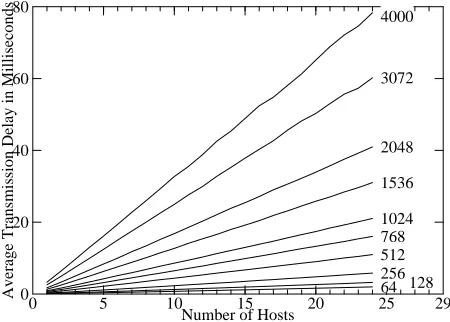
0 5 10 15 20 25 29 Number of Hosts
0 80
20 40 60
Average Transmission Delay in Milliseconds 64 128
[image:19.612.196.421.69.230.2]256 512 768 1024 1536 2048 3072 4000
Figure 8: Average transmission delay
The standard deviation of the packet delay, plotted in figure 9 increases linearly with number of hosts. If there are N hosts transmitting, then on average for each packet a host sends, it waits while N-1 other packets are sent. In the worst case, for large packets and many hosts, the stan-dard deviation is about twice the mean.
0 5 10 15 20 25 29 Number of Hosts
0 160
20 40 60 80 100 120 140
Std Dev of Transmission Delay in Milliseconds
[image:19.612.195.420.338.501.2]64 128 256 512 768 1024 1536 2048 3072 4000
Figure 9: Standard deviation of transmission delay
0 5 10 15 20 25 29 Number of Hosts
0 1200
100 200 300 400 500 600 700 800 900 1000 1100
Excess Transmission Delay in Microseconds
[image:20.612.163.395.69.232.2]64 128 256 512 768 1024 1536
Figure 10: Excess transmission delay
3.6. Fixed length packets on a short net
We also ran a set of tests with 23 hosts on a 20 foot Ethernet. Collision resolution time is a function of round trip propagation delay; the quicker that collisions get resolved, the more ef-ficient the net is. The round trip propagation delay for 3000 feet of coaxial cable is about 10 microseconds; it is essentially zero for 20 feet. The data for this experiment look very similar to the previous set; only the bit rate graph is shown.
0 5 10 15 20 25 30 Number of Hosts
7 10
7.5 8 8.5 9 9.5
Ethernet Utilization in MBits/sec
64 128 256 512 768 1024 1536 2048 3072 4000
Figure 11: Total bit rate (short net)
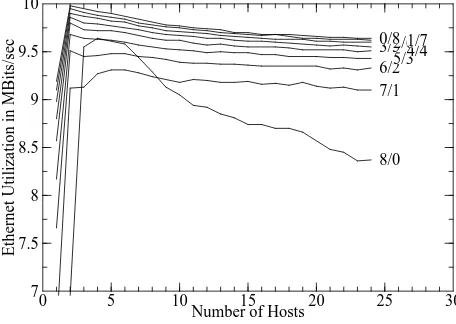
[image:20.612.165.394.381.541.2]3.7. Bimodal distribution of packet lengths
Because a fixed packet length is not characteristic of most actual Ethernet loads, we repeated our measurements using a number of bimodal length distributions. These distributions were composed of minimal-length (64-byte) and maximal-length (1536-byte) packets in varying ratios, with the packet size chosen randomly while preserving the overall ratio. This ap-proximates real Ethernet traffic, which usually consists of many minimum length packets, some maximum length packets, and a few of intermediate size [20, 11].
0 5 10 15 20 25 30 Number of Hosts
7 10
7.5 8 8.5 9 9.5
Ethernet Utilization in MBits/sec
[image:21.612.192.420.173.339.2]8/0 7/1 6/25/34/4 3/52/61/7 0/8
Figure 12: Total bit rate (long net; 4 clusters)
Figure 12 shows the utilizations obtained with bimodal length distributions. The curves are labeled with the ratio of short to long packets; for example, ‘‘6/2’’ means that there were six short packets for every two long packets.) Notice that when only one out of eight packets is long, the utilization is much higher than when all the packets are short. This is as predicted by Tobagi and Hunt [25].
0 5 10 15 20 25 30 Number of Hosts
7 10
7.5 8 8.5 9 9.5
Ethernet Utilization in MBits/sec
8/0 7/1 6/25/3
[image:21.612.191.419.458.620.2]4/4 3/52/61/7 0/8
Figure 13: Total bit rate (long net; 2 clusters)
delay is about 1.5% higher, and the total utilization, as shown in figure 13, is about 1.1% lower, in the two-cluster configuration. For maximal-length packets, there is no appreciable difference between the two configurations.
Gonsalves and Tobagi [10] showed, in their simulation, that unequal-sized clusters increase unfairness; we have not yet attempted to measure this effect.
4. Implications for Ethernet implementations
Between the theoretical analyses, which tell us how to operate the Ethernet as a whole, and our practical experience, which tells us how to obtain good performance from actual implemen-tations and on actual applications, we can draw a clearer picture of how to use Ethernets.
4.1. Lessons learned from theory
For the user who has already decided to install Ethernet technology, the theoretical results provide several guidelines:
•Don’t install long cables: to cover a large area, break up the cable with bridges or gateways (routers), not repeaters.
•Don’t put too many hosts on one cable: use gateways to break the network into communities of interest, trading higher delay for inter-community traffic for better intra-community response time and throughput.
•Implement the protocol correctly: proper collision detection and binary-exponential backoff in interface or host software is essential to good performance.
•Use the largest possible packet size: this keeps the packet count down, reducing the likelihood of collision and not incidentally reducing overheads internal to hosts.
•Don’t mix serious real-time and serious bulk-data applications: it is not possible to simultaneously guarantee the lowest delay and the highest throughput (although for moderate requirements both kinds of applications coexist well).
4.2. Prerequisites for high-performance implementations
It is actually fairly difficult to drive an Ethernet into the regime measured in section 3, let alone into the ‘‘unstable’’ regimes predicted by theory. In fact, it can be hard to get good perfor-mance even on a lightly-loaded Ethernet.
Some of the pessimism about Ethernet can be traced to poor implementations. For example, one study [18] found that a typical implementation of an Ethernet interface was unable to provide good performance. This study shows packet rates (for minimal-length packets) of 250 packets per second or less, and throughputs (using large packets) of about 150 Kbytes/second or lower. Although more recent implementations can do better than this, it takes careful design and hard work.
Networking performance can be limited by any of several weak links. For example, if the backplane or memory system bandwidth is too low, the bandwidth of the network itself becomes less visible. Also, host processor time is precious; per-packet processing time increases latency and, unless it can be completely overlapped with transmission or reception, decreases through-put. The latency costs of packet processing completely dominate the theoretical channel-access times in the light-load regimes typical of most Ethernet installations. Processor speed often has more influence than network bandwidth on useful throughput (see, for example, Lantz, Nowicki, and Theimer [14].)
When the processor, memory, and software are fast enough to support the full network bandwidth, the network interface can be the weak link. In a high-performance Ethernet inter-face,
•Transmitter and receiver performance should be matched: If the transmitter cannot keep up with the receiver, or vice versa, the ultimate performance suffers, as we found when measuring single-host short-packet rates (see section 3.4).
•The interface should be able to transmit, and to receive and store, several back-to-back packets without host intervention: otherwise, bandwidth is wasted on lost packets or on channel idle time.
•The interface should be able to transmit and receive several packets per interrupt: interrupt latency is often the bottleneck to efficient handling of packets. The ability to receive back-to-back packets implies the ability to handle them in a batch.
4.3. Problems with certain existing implementations
When Ethernets fail, it is almost never because they have been pushed into instability by a high load of useful traffic. This may be because most implementations are incapable of utilizing the bandwidth of the network. Instead, Ethernets usually fail for one of two reasons: hardware failure (including incorrect designs) or accidental high loads.
Transient hardware failures include open or shorted cables, to which all shared-medium LANs are vulnerable, and ‘‘jabbering’’ transmitters (those that send infinitely long packets). Careful hardware maintenance is the only protection against such failures, and it takes considerable preparation and diagnostic skill to locate them; Ethernets are not only ‘‘distributed packet switches’’ but ‘‘distributed single points of failure.’’
Accidental high loads, usually generated by software bugs, are the most common way that Ethernets are pushed into the overload regime analyzed by theoretical studies. One example of such a bug is distressingly common: a broadcast packet is sent but some of the hosts that receive it mistakenly believe that it should be forwarded, as a broadcast, back onto the cable. The recur-sive nature of this bug leads to exponential growth in the number of such packets, saturating the network. Unless there is a mechanism for aging packets (such as a hop-count field), it may be impossible to recover the network without shutting down every host.
rules. At high loads, an incorrect backoff algorithm can drive the network into instability, making it useless for everyone. For this and other reasons, all implementations should be tested at high offered loads, even if they normally would not be used that way.
Host software that assumes low congestion can also push an Ethernet from high load into overload by retransmitting data too aggressively, especially if acknowledgements are being delayed due to collisions. Retransmission delays in higher protocol levels should be backed off to avoid congestive collapse in any network, not just Ethernets. Hosts should not assume that delays on an Ethernet will always be short; even on a network that is normally lightly-loaded, brief intervals of overload are possible.
4.4. Suitability of Ethernet for specific applications
Both the theoretical studies and our measurements support the use of Ethernet for high-bandwidth applications, especially when response time is not closely constrained. Given that the aggregate bandwidth requirements do not frequently exceed 10 Mbits/second, the Ethernet should not be a bottleneck.
When response time is constrained, then Ethernet may still be a reasonable choice, especially if the number of hosts is relatively small and there are few high-bandwidth applications. For example, Gonsalves [9] found that the experimental (3 Mbit/second) Ethernet was ‘‘capable of supporting about 40 simultaneous 64-Kbps two-way voice conversations with acceptable quality.’’ Note that this application can accept occasional lost packets; some real-time applica-tions are more constraining.
The Ethernet may not be the appropriate medium for applications requiring low latency and involving a very large number of simultaneous hosts. One such application is distributed pro-gramming with fine-grained remote memory access. Spector [21] was able to obtain reasonable performance on an experimental Ethernet with a small number of hosts, but he suggests that only ring networks are able to support a large amount of parallelism.
5. Summary and conclusions
Acknowledgements
John DeTreville provided numerous perceptive comments on an early draft of this paper. Michael Fine, Joel Bartlett and Brian Reid also provided important suggestions. The authors are, of course, solely responsible for any errors in this paper.
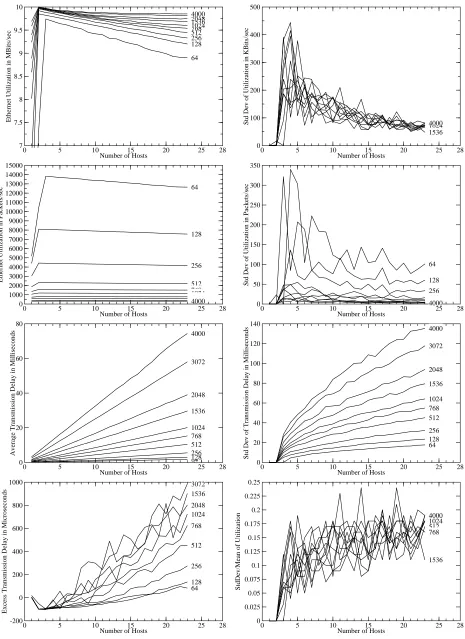
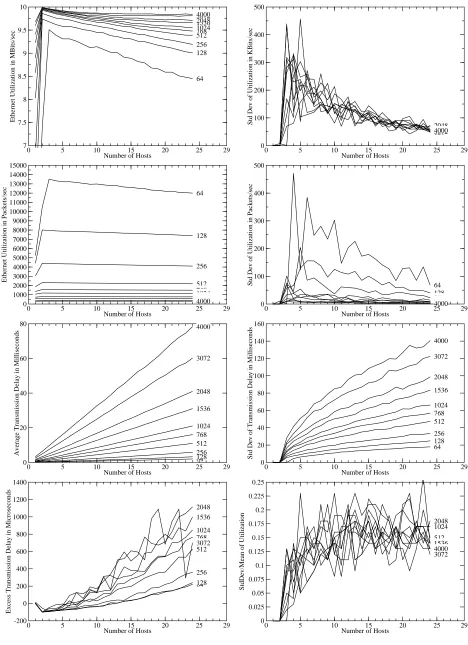
Appendix I. All of the Experiment Data
Here are all of the graphs for all of the experiments. Due to space constraints, the conference paper could include only selected graphs.
For completeness, we also include a set of graphs from an experiment on a maximum legal length (45 microsecond round trip delay) network. This experiment was conducted jointly with Robert L. Fink of the Lawrence Berkeley Laboratory. Technical notes describing our experi-ments with long networks are in preparation by LBL and WRL.
There were five experiements. The first three experiments used fixed length packets on net-works with round trip delays of 3, 12 and 45 microseconds. The last two experiments used bimodal length packets on a 12 microsecond net and varied the arrangement of hosts: one ex-periment with two clusters at the ends of the net, and another with four clusters equally spaced along the net.
0 5 10 15 20 25 28 Number of Hosts
7 10 7.5 8 8.5 9 9.5
Ethernet Utilization in MBits/sec
64 128 256 512 768 1024 1536 2048 3072 4000
0 5 10 15 20 25 28 Number of Hosts
0 500 100 200 300 400
Std Dev of Utilization in KBits/sec 64128256
512 768 1024 1536 2048 3072 4000
0 5 10 15 20 25 28 Number of Hosts
0 15000 1000 2000 3000 4000 5000 6000 7000 8000 9000 10000 11000 12000 13000 14000
Ethernet Utilization in Packets/sec
64 128 256 512 768 1024 1536 2048 3072 4000
0 5 10 15 20 25 28 Number of Hosts
0 350 50 100 150 200 250 300
Std Dev of Utilization in Packets/sec
64 128 256 512 768 1024 1536 2048 3072 4000
0 5 10 15 20 25 28 Number of Hosts
0 80
20 40 60
Average Transmission Delay in Milliseconds
64 128 256 512 768 1024 1536 2048 3072 4000
0 5 10 15 20 25 28 Number of Hosts
0 140 20 40 60 80 100 120
Std Dev of Transmission Delay in Milliseconds
64 128 256 512 768 1024 1536 2048 3072 4000
0 5 10 15 20 25 28 Number of Hosts
-200 1000 0 200 400 600 800
Excess Transmission Delay in Microseconds
64 128 256 512 768 1024 1536 2048 3072
0 5 10 15 20 25 28 Number of Hosts
0 0.25 0.025 0.05 0.075 0.1 0.125 0.15 0.175 0.2 0.225
StdDev/Mean of Utilization
[image:28.612.51.516.56.695.2]64 128 256 512 768 1024 1536 2048 3072 4000
0 5 10 15 20 25 29 Number of Hosts
7 10 7.5 8 8.5 9 9.5
Ethernet Utilization in MBits/sec
64 128 256 512 768 1024 1536 2048 3072 4000
0 5 10 15 20 25 29 Number of Hosts
0 500 100 200 300 400
Std Dev of Utilization in KBits/sec
64 128 256 512 768 1024 1536 2048 3072 4000
0 5 10 15 20 25 29 Number of Hosts
0 15000 1000 2000 3000 4000 5000 6000 7000 8000 9000 10000 11000 12000 13000 14000
Ethernet Utilization in Packets/sec
64 128 256 512 768 1024 1536 2048 3072 4000
0 5 10 15 20 25 29 Number of Hosts
0 500 100 200 300 400
Std Dev of Utilization in Packets/sec 64 128 256 512 768 1024 1536 2048 3072 4000
0 5 10 15 20 25 29 Number of Hosts
0 80
20 40 60
Average Transmission Delay in Milliseconds
64 128 256 512 768 1024 1536 2048 3072 4000
0 5 10 15 20 25 29 Number of Hosts
0 160 20 40 60 80 100 120 140
Std Dev of Transmission Delay in Milliseconds
64 128 256 512 768 1024 1536 2048 3072 4000
0 5 10 15 20 25 29 Number of Hosts
-200 1400 0 200 400 600 800 1000 1200
Excess Transmission Delay in Microseconds
64 128 256 512 768 1024 1536 2048 3072
0 5 10 15 20 25 29 Number of Hosts
0 0.25 0.025 0.05 0.075 0.1 0.125 0.15 0.175 0.2 0.225
StdDev/Mean of Utilization
[image:29.612.83.551.56.701.2]64 128 256 512 768 1024 1536 2048 3072 4000
0 5 10 15 20 25 28 Number of Hosts
7 10 7.5 8 8.5 9 9.5
Ethernet Utilization in MBits/sec
64 128 256 512 768 1024 1536 2048 3072 4000
0 5 10 15 20 25 28 Number of Hosts
0 1500 150 300 450 600 750 900 1050 1200 1350
Std Dev of Utilization in KBits/sec
64 128 256 512 768 1024 1536 2048 3072 4000
0 5 10 15 20 25 28 Number of Hosts
0 15000 1000 2000 3000 4000 5000 6000 7000 8000 9000 10000 11000 12000 13000 14000
Ethernet Utilization in Packets/sec
64 128 256 512 768 1024 1536 2048 3072 4000
0 5 10 15 20 25 28 Number of Hosts
0 2000
500 1000 1500
Std Dev of Utilization in Packets/sec
64 128 256 512 768 1024 1536 2048 3072 4000
0 5 10 15 20 25 28 Number of Hosts
0 80
20 40 60
Average Transmission Delay in Milliseconds
64 128 256 512 768 1024 1536 2048 3072 4000
0 5 10 15 20 25 28 Number of Hosts
0 160 20 40 60 80 100 120 140
Std Dev of Transmission Delay in Milliseconds
64 128 256 512 768 1024 1536 2048 3072 4000
0 5 10 15 20 25 28 Number of Hosts
-200 2000 0 200 400 600 800 1000 1200 1400 1600 1800
Excess Transmission Delay in Microseconds
64 128 256 512 768 1024 1536 2048
0 5 10 15 20 25 28 Number of Hosts
0 0.8 0.1 0.2 0.3 0.4 0.5 0.6 0.7
StdDev/Mean of Utilization
[image:30.612.48.518.52.704.2]64 128 256 512 768 1024 1536 2048 3072 4000
0 5 10 15 20 25 29 Number of Hosts
7 10 7.5 8 8.5 9 9.5
Ethernet Utilization in MBits/sec
8/0 7/1 6/2 5/3 4/4 3/5 2/6 1/7 0/8
0 5 10 15 20 25 29 Number of Hosts
0 500 100 200 300 400
Std Dev of Utilization in KBits/sec 8/0 7/1 6/2 5/3 4/4 3/5 2/6 1/7 0/8
0 5 10 15 20 25 29 Number of Hosts
0 15000 1000 2000 3000 4000 5000 6000 7000 8000 9000 10000 11000 12000 13000 14000
Ethernet Utilization in Packets/sec
8/0 7/1 6/2 5/3 4/4 3/5 2/6 1/7 0/8
0 5 10 15 20 25 29 Number of Hosts
0 500 100 200 300 400
Std Dev of Utilization in Packets/sec
8/0 7/1 6/2 5/3 4/4 3/5 2/6 1/7 0/8
0 5 10 15 20 25 29 Number of Hosts
0 35 5 10 15 20 25 30
Average Transmission Delay in Milliseconds 8/0 7/1 6/2 5/3 4/4 3/5 2/6 1/7 0/8
0 5 10 15 20 25 29 Number of Hosts
0 100 20 40 60 80
Std Dev of Transmission Delay in Milliseconds
8/0 7/1 6/2 5/3 4/4 3/5 2/6 1/7 0/8
0 5 10 15 20 25 29 Number of Hosts
-200 1400 0 200 400 600 800 1000 1200
Excess Transmission Delay in Microseconds
8/0 7/1 6/2 5/3 4/4 3/5 2/6 1/7 0/8
0 5 10 15 20 25 29 Number of Hosts
0 0.25 0.025 0.05 0.075 0.1 0.125 0.15 0.175 0.2 0.225
StdDev/Mean of Utilization
[image:31.612.86.550.56.700.2]8/0 7/1 6/2 5/3 4/4 3/5 2/6 1/7 0/8
0 5 10 15 20 25 29 Number of Hosts
7 10 7.5 8 8.5 9 9.5
Ethernet Utilization in MBits/sec
8/0 7/1 6/2 5/3 4/4 3/5 2/6 1/7 0/8
0 5 10 15 20 25 29 Number of Hosts
0 500 100 200 300 400
Std Dev of Utilization in KBits/sec
8/0 7/1 6/2 5/3 4/4 3/5 2/6 1/7 0/8
0 5 10 15 20 25 29 Number of Hosts
0 15000 1000 2000 3000 4000 5000 6000 7000 8000 9000 10000 11000 12000 13000 14000
Ethernet Utilization in Packets/sec
8/0 7/1 6/2 5/3 4/4 3/5 2/6 1/7 0/8
0 5 10 15 20 25 29 Number of Hosts
0 500 100 200 300 400
Std Dev of Utilization in Packets/sec
8/0 7/1 6/2 5/3 4/4 3/5 2/6 1/7 0/8
0 5 10 15 20 25 29 Number of Hosts
0 35 5 10 15 20 25 30
Average Transmission Delay in Milliseconds 8/0 7/1 6/2 5/3 4/4 3/5 2/6 1/7 0/8
0 5 10 15 20 25 29 Number of Hosts
0 100 20 40 60 80
Std Dev of Transmission Delay in Milliseconds
8/0 7/1 6/2 5/3 4/4 3/5 2/6 1/7 0/8
0 5 10 15 20 25 29 Number of Hosts
-200 1400 0 200 400 600 800 1000 1200
Excess Transmission Delay in Microseconds
8/0 7/1 6/2 5/3 4/4 3/5 2/6 1/7 0/8
0 5 10 15 20 25 29 Number of Hosts
0 0.25 0.025 0.05 0.075 0.1 0.125 0.15 0.175 0.2 0.225
StdDev/Mean of Utilization
[image:32.612.50.515.55.692.2]8/0 7/1 6/2 5/3 4/4 3/5 2/6 1/7 0/8
References
[1] Guy T. Almes and Edward D. Lazowska.
The Behaviour of Ethernet-Like Computer Communications Networks.
In Proceedings of the 7th Symposium on Operating Systems Principles, pages 66-81. ACM SIGCOMM, Asilomar, California, December, 1979.
[2] Theodore K. Apostolopoulos and Emmanuel N. Protonotarios.
Queueing Analysis of Buffered CSMA/CD Protocols.
IEEE Transactions On Communications COM-34(9):898-905, September, 1986.
[3] Andrew D. Birrell and Bruce Jay Nelson.
Implementing Remote Procedure Calls.
ACM Transactions on Computer Systems 2(1):39-59, February, 1984.
[4] David R. Boggs, John F. Shoch, Edward A. Taft, and Robert M. Metcalfe.
Pup: An internetwork architecture.
IEEE Transactions On Communications COM-28(4):612-624, April, 1980.
[5] Werner Bux.
Local-Area Subnetworks: A Performance Comparison.
IEEE Transactions On Communications COM-29(10):1465-1473, October, 1981.
[6] Edward J. Coyle and Bede Liu.
Finite Population CSMA/CD Networks.
IEEE Transactions On Communications COM-31(11):1247-1251, November, 1983.
[7] Edward J. Coyle and Bede Liu.
A Matrix Representation of CSMA/CD Networks.
IEEE Transactions On Communications COM-33(1):53-64, January, 1985.
[8] The Ethernet, A Local Area Network: Data Link Layer and Physical Layer Specifications (Version 1.0).
Digital Equipment Corporation, Intel, Xerox, 1980.
[9] Timothy A. Gonsalves.
Packet-Voice Communications on an Ethernet Local Computer Network: an Experimen-tal Study.
In Proceedings of SIGCOMM ’83, pages 178-185. ACM SIGCOMM, March, 1983.
[10] Timothy A. Gonsalves and Fouad A. Tobagi.
On The Performance Effects of Station Locations And Access Protocol Parameters In Ethernet Networks.
IEEE Transactions on Communications 36(4):441-449, April, 1988.
Originally published as Stanford University SEL Technical Report 86-292, January, 1986.
[11] Riccardo Gusella.
The Analysis of Diskless Workstation Traffic on an Ethernet.
[12] Van Jacobson.
Maximum Ethernet Throughput.
Electronic distribution of the TCP-IP Discussion Group, Message-ID <[email protected]>.
[13] Leonard Kleinrock and Fouad A. Tobagi.
Packet Switching in Radio Channels: Part I -- Carrier Sense Multiple Access Modes and their Throughput-delay characteristics.
TRANSCOM COM-23(12):1400-1416, December, 1975.
[14] Keith A. Lantz, William I. Nowicki, and Marvin M. Theimer.
Factors affecting the performance of distributed applications.
In Proceedings of SIGCOMM ’84 Symposium on Communications Architectures and
Protocols, pages 116-123. ACM, June, 1984.
[15] Robert M. Metcalfe.
Steady-State Analysis of a Slotted and Controlled Aloha System with Blocking. In Proceedings of the Sixth Hawaii Conference on System Sciences. January, 1973. Reprinted in the SIGCOMM Review, January, 1975.
[16] Robert M. Metcalfe.
Packet Communication.
PhD thesis, Harvard University, December, 1973.
Massachusetts Institute of Technology Project MAC TR-114.
[17] Robert M. Metcalfe and David R. Boggs.
Ethernet: Distributed Packet Switching for Local Computer Networks.
Communications of the ACM 19(7):395-404, July, 1976.
[18] Jose Nabielsky.
Interfacing To The 10Mbps Ethernet: Observations and Conclusions.
In Proceedings of SIGCOMM ’84, pages 124-131. ACM SIGCOMM, June, 1984.
[19] John F. Schoch and Jon A. Hupp.
Measured Performance of an Ethernet Local Network.
In Proceedings of the Local Area Communications Network Symposium. Mitre/NBS, Boston, May, 1979.
Reprinted in the Proceedings of the 20th IEEE Computer Society International
Conference (Compcon ’80 Spring), San Francisco, February 1980.
[20] John F. Schoch and Jon A. Hupp.
Measured Performance of an Ethernet Local Network.
Communications of the ACM 23(12):711-721, December, 1980.
[21] Alfred Z. Spector.
Multiprocessing Architectures for Local Computer Networks.
Technical Report STAN-CS-81-874, Stanford University, Department of Computer Science, August, 1981.
[22] Hideaki Takagi and Leonard Kleinrock.
Throughput Analysis for Persistent CSMA Systems.
[23] Shuji Tasaka.
Dynamic Behaviour of a CSMA-CD System with a Finite Population of Buffered Users.
IEEE Transactions On Communications COM-34(6):576-586, June, 1986.
[24] Fouad A. Tobagi and Leonard Kleinrock.
Packet Switching in Radio Channels: Part IV -- Stability Considerations and Dynamic Control in Carrier Sense Multiple Access.
IEEE Transactions on Communications COM-23(12):1400-1416, December, 1977.
[25] Fouad A. Tobagi and V. Bruce Hunt.
Performance Analysis of Carrier Sense Multiple Access with Collision Detection.
Table of Contents
1. Introduction 1
2. What theoretical studies really say 2
2.1. Parameters affecting performance 2
2.2. How performance is measured 4
2.3. Definitions of offered load 4
2.4. A brief guide to the theoretical studies 5
2.4.1. Metcalfe and Boggs, 1976 6
2.4.2. Almes and Lazowska, 1979 6
2.4.3. Tobagi and Hunt, 1980 6
2.4.4. Bux, 1981 7
2.4.5. Coyle and Liu, 1983 and 1985 7
2.4.6. Takagi and Kleinrock, 1985 8
2.4.7. Gonsalves and Tobagi, 1986 8
2.4.8. Tasaka, 1986 8
2.5. Myths and reality 8
3. Measurements of a real Ethernet 9
3.1. Previous measurements 10
3.2. Measurement environment 10
3.3. Methodology 10
3.4. Maximum rate attainable between a pair of hosts 12
3.5. Fixed length packets on a long net 12
3.6. Fixed length packets on a short net 16
3.7. Bimodal distribution of packet lengths 17
4. Implications for Ethernet implementations 18
4.1. Lessons learned from theory 18
4.2. Prerequisites for high-performance implementations 18
4.3. Problems with certain existing implementations 19
4.4. Suitability of Ethernet for specific applications 20
5. Summary and conclusions 20
Acknowledgements 21
Appendix I. All of the Experiment Data 23
List of Figures
Figure 1: Points for measuring load 5
Figure 2: Experimental configuration 10
Figure 3: Packet generation process 11
Figure 4: Total bit rate 13
Figure 5: Standard deviation of bit rate 13
Figure 6: Total packet rate 14
Figure 7: Standard deviation of packet rate 14
Figure 8: Average transmission delay 15
Figure 9: Standard deviation of transmission delay 15
Figure 10: Excess transmission delay 16
Figure 11: Total bit rate (short net) 16
Figure 12: Total bit rate (long net; 4 clusters) 17
Figure 13: Total bit rate (long net; 2 clusters) 17
Figure I-1: 3 microsecond net, fixed packet sizes, 1 cluster 24