Technology (IJRASET)
Plant Image Retrieval System Using Color &
Shape Feature
Mr. Vinay S. Mandlik 1, Mr. Unmesh Sagare 2 1,2
Assistant Professor, Department of Electronics & Telecommunication Engineering, Bharati Vidyapeeth’s College of Engineering, Kolhapur, Maharashtra, India.416013
Abstract— Image retrieval techniques have not been deployed significantly for plant in Agriculture sector. Agricultural sector of Indian Economy is one of the most significant parts of India. About 75% people are living in rural areas and are still dependent on Agriculture. About 43% of India’s geographical area is used for agricultural activity. Image retrieval system is use full for the agricultural field to determine growth and insect attack of plant. Also it can be use for the Detecting weeds in the field, whether or not a plant is damage by a specified illness and distinguish weeds form soil regions. We are going to use color and shape features image retrival. Feature extraction like color and shape, is done by the different color techniques with SIFT for shape.
Index Terms— SIFT (Scale-invariant feature transform), nRGB, HVS, YCrCb color models, GMM.
I. INTRODUCTION
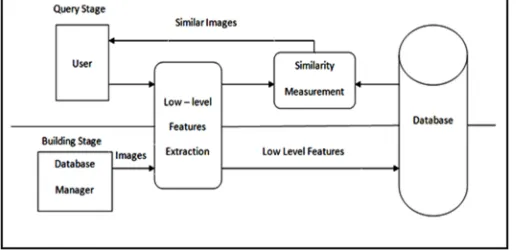
[image:2.612.179.437.452.577.2]MAGE Image retrieval system is effective technique in obtaining the exact image from the given database by inputting the features of image. This technique if deployed for plant in the agriculture application will be helpful in solving problems in agriculture field. Many retrieval systems have been developed, but the problem of retrieving images on the basis of their pixel content remains largely unsolved number of querying techniques like query by example, semantic retrieval, browsing for example images, navigating customized/hierarchical categories, querying by image region (rather than the entire image), querying by multiple example images, querying by visual sketch, querying by direct specification of image features, and multimodal queries (e.g. combining touch, voice, etc.) can be used to retrieve exact image. Content comparison can be done using image distance measurement, color, shape, texture manipulation.
Fig 1.1: Block diagram of Image Retrieval System
II. SEGMANTEDIMAGE
Technology (IJRASET)
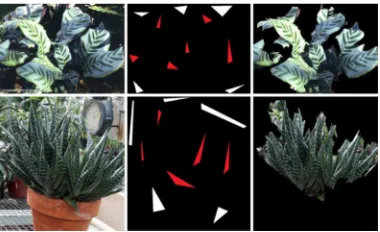
region that could be the foreground, giving a total 2K components.Fig 2.1: Segmentation examples the input image, the seed points shown as white (background) and red (foreground) regions and the segmented images are shown in a row.
III. FEATUREEXTRACTION
In the developed system, images are analyzed using various color, and shape features. The use of color in plant retrieval is more complicated compared with most other Retrieval system applications, since most plants have green tones as their main color. Furthermore, the color of the flowers also poses a challenge: two flowering plants should be matched despite differences in flower colors. For instance, given a hyacinth of a certain color, ideally one should find its exact match from the database, as well as other hyacinth plants with different lower colors like the ones. We currently use some basic color features consisting of color histograms and color co- occurrence matrices obtained from the segmented image, to represent the color information. Probably the most important aspect of an object is its shape, and the same applies to plants as well. In the plant identification problem, both the leaf shape and the overall shape of the plant are important. We use the SIFT features to extract the local shape features of the plant and some newly proposed features extracted from the plant’s outer contour, to describe the overall plant shape.
A. Color Feature
We used color histograms and color co-occurrence matrices to assess the similarity between two images [10–13]. If the overall color or color pair distributions of two images are close, they are matched as similar in terms of their colors. Three different color spaces are used to produce color histograms; namely RGB, normalized RGB (nRGB) and HIS color spaces [8,14]. In the RGB color space, each color is represented as a combination of the three primary color channels (Red, Green and Blue). In fact, different color spaces may be suitable in different applications. For instance, the nRGB and the HSI color spaces are often used in order to obtain robustness against illumination differences. The normalization process effectively normalizes for different illumination conditions. The colors are represented by three normalized color values (nR, nG, nB), which indicate the red, green and blue color ratio in a specific pixel. The normalization computation for red and green channels is formulated as follows:
= /( + + )& = /( + + )
Technology (IJRASET)
B. Shape Feature
The features the SIFT algorithm detects represent minima and maxima in scale space of these difference-of-Gaussian images. local features such as scale-invariant feature transform (SIFT) descriptors [1,2] are used for this problem, in locating objects within complex scenes At each of these minima and maxima, a detailed model is fit to determine location, scale and contrast, during which some features are discarded based on measures of their (in) stability [6]. Once a stable feature has been detected, its dominant gradient orientation is obtained, and a key-point descriptor vector is formed from a grid of gradient histograms constructed from the gradients in the neighborhood of the feature. Key-point matching between images is performed using a nearest-neighbor indexing method, followed by a Hough transform that finds key-points that agree on potential object poses, and finally a solution for affine parameters, which determines the specific location and orientation of each recognized object.
IV. MATCHING
The dissimilarity between a query image Q and a database image I is assessed according to the extracted feature(s). The metrics used in matching different features are explained in his section.
A. Color Matching
The RGB color dissimilarity score of two images Q and I is calculated using the Kullback–Leibler divergence (KL divergence) measure of the corresponding histograms hQ and hI :
( , ) = − ℎ ( ) ℎ( ) + ℎ ( ) ℎ ( )
Where ℎ ( )and ℎ( )are the values of ith bin of Q’s and I ’s
histograms, respectively. The KL-divergence of two histograms can be expressed using the concept of entropy; specifically how many bits are needed to represent the histogram of I by using the histogram of Q as the reference:
( , ) = ℎ ,ℎ − ℎ . Here H(hQ, hI ) is called cross entropy of hQ and hI , while
H(hQ) is the entropy of Q’s histogram.
B. Shape Matching
When using SIFT features, the similarity of two images is measured by the number of matching SIFT keypoints [2]. We use the following normalized SIFT dissimilarity score, for two
images Q and I:
( , ) = 1− ( + 1)
Where m is the number of matching SIFT keypoints, α is a normalization constant with a current value of 0.25 and a logarithmic scale is used since the number of matching points range between 0 and possibly several hundreds. Note that sing the unnormalized number of matching SIFT points is sufficient for retrieval, if SIFT features are used alone. Normalization is necessary when combining the SIFT dissimilarity with the dissimilarity scores obtained from the other features.
V. DATABASE
Technology (IJRASET)
VI. EXPERIMENTALRESULTS
The performance of the system is evaluated by running tests over our plant image database. Each test is done as a one-versus-the-rest test, by querying each image in the database against the remainder. The main metric used in assessing performance is the top-N retrieval rates indicating whether the correct plant type is among the top N returned images. We used top-10 and top-15 retrieval rates, assuming that a user can easily and quickly identify the correct image among 10–15 returned images. In addition, we present the average minimum rank value which indicates the rank of the best matching correct plant, averaged over all queries. All three feature classes (color, shape and texture) are tested with all possible parameters and retrieval methods that we proposed. In addition to these individual tests, several combined methods are tested as well. In summary, test results show that the most useful individual feature class is color, followed by texture and global shape, and that the performance of the system is increased when combining several features. Since the performance of the proposed method is still relatively low, we also include the performance of a dummy engine, which randomly selects the retrieved images, in the overall result tables. The following sections present test results with comments on the performance of the retrieval methods
A. Results Using Color & Shape Combine
Shape Color Top-10% Top-15%
SIFT
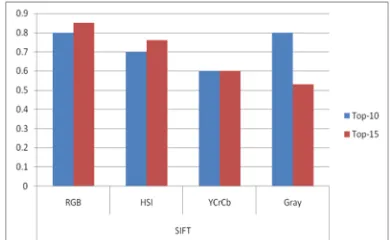
RGB 0.80 0.85
HSI 0.70 0.76
YCrCb 0.60 0.60
[image:5.612.197.415.274.345.2]Gray 0.80 0.53
Table 6.1 Accuracies of System for Shape + Color features
Figure 6.1 Result for the image retrieval system using combining Color & Shape feature
VII. CONCLUSION
We present a plant image retrieval system, with a segmentation preprocessing step. Extracting plant regions from images by the MFMC segmentation technique has given us an opportunity to focus solely on the plant, which increased consistency of the retrieved global features. Furthermore, combining different color and shape features extracted from the images enhance the accuracy of the system. Common techniques are used in color feature extraction steps: color histograms and color co-occurrence matrices on different color models. For shape-based retrieval, we used SIFT features that capture local characteristics of the plant, as well as newly proposed global shape descriptors that are based on the outer contour of the plant. The new global shape descriptors provided improvements over the existing methods. While there is clearly room for improvement, the proposed approach got promising results for the plant retrieval problem. Using color, and shape features in combination have improved the system performance.
REFERENCES
[1] Lowe, D.G. (1999) Object Recognition from Local Scale-Invariant Features. ICCV, pp. 1150–1157.
[2] Lowe, D.G. (2004) Distinctive image features from scaleinvariant keypoints. Int. J. Comp. Vis., 60, 91–110.
[3] Ma,W. and Manjunath, B. (1996) Texture Features and Learning Similarity. Proc. Conf. Computer Vis. Pattern Recognition (CVPR), June, pp. 425–430..
[image:5.612.208.403.373.493.2]Technology (IJRASET)
[5] Tomas Malmer, Image segmentation using GrabCut. May 12, 2010.
[6] David G. Lowe, Object Recognition from Local Scale-Invariant Features. Computer Science Department, University of British Columbia Vancouver, B.C., V6T 1Z4, Canada
[7] A. Vadivel , Shamik Sural , A.K. Majumdar, “An Integrated Color and Intensity Co-occurrence Matrix”, January 2007.
[8] P.S.SUHASINI , Dr. K.SRI RAMA KRISHNA, Dr. I. V. MURALI KRISHNA ,“CBIR USING COLOR HISTOGRAM PROCESSING” , 2005 - 2009 JATIT,
Vol6. No1. (pp 116 - 122)
[9] Yuri Boykov and Vladimir Kolmogorov, “An Experimental Comparison of Min-Cut/Max-Flow Algorithms for Energy Minimization in Vision ”, IEEE Transactions on PAMI, Vol. 26, No. 9, pp. 1124-1137, Sept. 2004.
[10] Tico, M., Haverinen, T. and Kuosmanen, P. (2000) A Method of Color Histogram Creation for Image Retrieval. Proc. Nordic Signal Processing Symp. (NORSIG’2000), Kolmarden, Sweden, June, pp. 157–160.
[11]Zarit, B., Super, B. and Quek, F. (1999) Comparison of Five Color Models in Skin Pixel Classification. Proc. Int. Workshop on Recognition, Analysis, and Tracking of Faces and Gestures in Real-Time Systems, pp. 58–63.
[12]Sural, S., Qian, G. and Pramanik, S. (2002) Segmentation and Histogram Generation Using the HSV Color Space for Image Retrieval. ICIP, Vol. 2, pp. II-589– II-592.
[13]Shim, S.-O. and Choi, T.-S. (2003) Image Indexing by Modified Color Co-occurrence Matrix. ICIP, September, Vol. 2, pp. III- 493–III-496.