Technology (IJRASET)
Flow visualisation at the nozzle fitted in a square
section test duct by Particle Image Velocimetry
system
Omprakash Yadav1, Kushalendra Kumar Dubey2, Saigeeta Priyadarshini3
1,2,3
Department of Mechanical and Automobile Engineering, Sharda University
Abstract—The objective of this experimental work is to investigate the flow at the nozzle in a square section test duct by Particle Image Velocimetry system. The two components of the velocity i.e. velocity field in a plane, vorticity, strain rate, are visualize by Particle Image Velocimetry (PIV) system. A new setup for swirling flow in a square section test duct in the PIV laboratory is designed which is four feet long with height D=1 foot and width H=1 foot. The aspect ratio of test duct is defined as ratio of larger dimension to smaller dimension of the cross section of the test duct. Hence aspect ratio of this test duct is one. Venturimeter is used to measure the discharge through four nozzles. Pump is used to supply water to the nozzles through pvc pipe. The swirling in the test duct is created by the nozzles incorporated at four faces with the help of supply of water tangentially into the section. But in this paper objective is to flow visualize at the nozzle only. Pure water loaded with seeding particle known as tracer is used to trace the path of flow. The PIV system consists of laser, CCD camera, synchronizer, computer etc. Two pulses of laser illuminate the seed particle at the section and two photographs are taken by high speed CCD camera which is analyze by PIV using INSIGHT3G software to get one velocity vector. The laser and CCD camera are perpendicular to each other. INSIGHT software measures velocity using one of three correlation processes: Autocorrelation, 1-Frame Cross-Correlation and 2-Frame Cross-Cross-Correlation.
Keywords— Velocity, Particle Image Velocimetry (PIV), square section test duct, venturimeter, nozzle etc.
I. INTRODUCTION
PIV is a planer measurement technique wherein a pulse laser light sheet is used to illuminate a flow field seeded with tracer particle small enough to follow the flow. The position of particle are recorded on CCD camera at each instant the light sheet is pulsed. The data processing consists of either determining the average displacement of the particle over the small interrogation region in the image or the individual particle displacement between the pulse of light sheet. Knowledge of time interval between light sheet pulses then permits computation of velocity field. While the method of adding particles or objects to a fluid in order to observe its flow is likely to have been used from time to time through the ages no sustained application of the method is known. The objective of this experiment is to find out velocity field, vorticity, shear strain rate at the nozzle-1 in square section duct by particle image velocimetry system.
Particle image velocimetry (PIV) is a two-dimensional quantitative instantaneous velocity measurement technique. In contrast to single-point measurements, a two-dimensional velocity distribution can provide local velocity gradients. In the PIV technique, a
light sheet i.e. pulse from the laser is passed through a seeded flow field, illuminating the particles at time, t. At a time t + Δt, a
second sheet of light i.e. pulse is sent through the same plane in the flow field. The images of the particles from both laser sheets are saved on a recording medium. Measurement of the separation between two images of the same particle throughout the field of view by autocorrelation can provide the local fluid velocities as depicted in figure-1.
, , , ,x x t u x t
t y y t v y t
Technology (IJRASET)
Figure:1. Principle of Particle Image Velocimetry
The velocity vector field is given by,
V
u i v j
.
.
By knowing the displacement in known time, velocity field, vorticity, shear strain etc can be finding by the piv software.
II.PARTICLEIMAGEVELOCIMETRY(PIV)SYSTEM
Particle image velocimetry (PIV) system is a two-dimensional quantitative instantaneous velocity measurement technique. In contrast to single-point measurements, a two-dimensional velocity distribution can provide local velocity gradients.
The main component of Particle Image Velocimetry system are following. Light sources i.e. Laser.
High speed CCD Camera. Synchronizer.
Computer.
Technology (IJRASET)
2) Camera starts exposure and triggers the Synchronizer that the shutter is open with the flash sync output.
3) Synchronizer sends fire signals to the laser for the first pulse.
4) Synchronizer waits the selected pulse separation time.
5) Synchronizer sends signals for the second pulse of light.
6) The camera shutter closes at the end of the exposure time.
7) Camera outputs the video data.
8) Repeat the sequence for the number of frame to capture. The camera must be ready for the next exposure trigger before the
[image:4.612.146.464.189.330.2]frame rate time or an error will occur.
Figure:3 Capture timing diagram.
III.EXPERIMENTALSETUP
A. EXPERIMENTAL TEST DUCT
The whole of test duct is made of Flexi glass sheet (transparent) to enable visualization of the flow as well as PIV measurements at the section 1 and nozzle-1. The other side of chamber is vertical and open to the atmosphere. The test duct is full of water loaded with seeding particle. The test duct is fitted with 4 nozzles at section 1 and 4 nozzles at section 2 tangentially to supply the water into test duct such that the flow is swirling. The experimental test duct is as shown in figures -4 and figure-5.
[image:4.612.73.543.447.706.2]Technology (IJRASET)
Figure 5. Section-1 showing the Nozzle -1
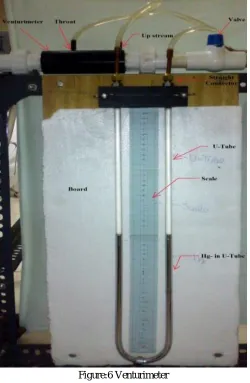
B. VENTURIMETER
[image:5.612.183.433.289.672.2]Technology (IJRASET)
Re=38217.42 (from venturimeter reading). To visualise the flow field at nozzle-1, CCD Camera is set 20mm bellow the nozzle-1
exit. The above is average of 300 frames and taken at speed of 15frames/s. The maximum velocity measure by venturimeter and measure by PIV are approximately same i.e Result is correct.
Figure: 7 Average velocity vectors
B. STREAM LINE
Technology (IJRASET)
C. AVERAGE RATE OF STRAIN VECTORFIGURE:9AVERAGE RATE OF STRAIN VECTOR
Technology (IJRASET)
PIV resulting maximum velocity of 4.79m/s and maximum velocity measured by venturimeter is 6.08m/s. The maximum velocity measured from two approaches is approximately same. Small error is due to density of seed particle, calibration, light etc. Density of seeding particle must be equal to the density of fluid but in my experiment density of seeding particle is little bit more which gives the lower velocity compared to venturimeter.
REFERENCES
[1] Jan Visscher, Helge I. Andersson, Mustafa Barri, Henri Didelle, Samuel Viboud, Damien Sous and Joel Sommeria. A new set-up for PIV measurements in rotating turbulent duct flows. Flow measurement and instrumentation, 22:71-80, (2011).
[2] Fude Guo, Bin Chen, Liejin Guo and Ximin Zhang. Investigation of turbulent mixing layer flow in water channel by piv. The Canadian journal of chemical engineering, Vol.88:919-928, (2010).
[3] M. Pashtrapanska, J. Jovanovic, H. Lienhart and F. Durst. Turbulence measurements in a swirling pipe flow. Journal of experimental fluids, 41: 813-827,(2006).
[4] S.V.Alekseenko, P.A Kuibin, V.L Okulov and S.I Shtork. Helical vortices in swirl flow. Journal of fluid mechanics, Vol. 382:195-243, (1999).
[5] Yehia A. Eldrainy, Hossam S. Aly, Khalid M. Saqr, and Mohammad Nazri Mohd Jaafar. A multiple inlet Swirler for Gas Turbine Combustors. World Academy of Science, Engineering and Technology Vol: 53,( 2009).
[6] Dr.R.K.Bansal. A text book of “Fluid mechanics and Hydraulic machine” (2003).