International Journal of Emerging Technology and Advanced Engineering
Website: www.ijetae.com (ISSN 2250-2459,ISO 9001:2008 Certified Journal, Volume 5, Issue 5, May 2015)
271
Thrombus Detection from Echocardiographic Images
Using Image Processing Techniques.
Maulik A Chaudhary
1, Dr. N. M. Patel
2, Prof. M. J. Joshi
31,2,3Department of Computer Engineering, Birla Vishvakarma Mahavidyalaya Vallabh Vidyanagar, India
Abstract— Image processing is a powerful tool for
increasing the reliability and reproducibility of disease diagnostics. In the hands of pathologists, image processing provides quantitative data from histological images which supplement the qualitative data currently used by specialists. This paper presents the method for analysing digitized images of echocardiography and detect some of the basic diseases which can cause the Heart Attack. This paper presents the method for detecting the diseases like thrombus related to heart. Methods presented in this paper for detection of thrombus include steps like noise removal, feature extraction, segmentation and thrombus detection. At first the speckle noise is been removed using Lee Filter. Image is segmented using active contour method to detect LV (Left Ventricular). From LV chamber thrombus is detected using operations like thresholding, intersection, morphological opening, finding largest connected component and edge detection.
Keywords—Echo, Histogram, Contour, Threshold, Hough.
I. INTRODUCTION
Today medical imaging offers the support for major advances in medicine as higher fidelity images are created. It has developed into one of the most important fields within scientific imaging due to the rapid and continuing progress in computerized medical image visualization and advances in analysis methods and computer-aided diagnosis, and is now, for example, a vital part of the early detection, diagnosis, and treatment of cancer. The challenge is to effectively diagnosis the images in order to extract information to understand the structure and function of the organs being imaged. The main goal is to get the information and put it into practical use. Recently, heart disease became one of the major reason for the deaths of the people in the world. Heart diseases are one of the most risky and have high mortality rate. The diagnosis of the heart diseases requires the examination through many different methods. One of the popular techniques is Echocardiogram.
II. MEDICAL BACKGROUND
Myocardium infarction (MI) is one of the most serious and dangerous disease that effects the health of the human heart. MI usually attacks and damages the heart muscle by blocking the path of coronary artery.
A. Some basic heart diseases
Heart Attack: - A heart attack occurs when the blood flow to a part of the heart is blocked by a blood clot or thrombus [7].
Coronary heart disease: - Coronary heart disease is the term that describes what happens when your heart's blood supply is interrupted by a build-up of fatty substances in the coronary arteries [7].
Arrhythmia: -This is an abnormal rhythm of the heart. Bradycardia is when the heart rate is less than 60 beats per minute. Tachycardia is when the heart rate is more than 100 beats per minute [7].
Heart valve problems: - When heart valves don't open enough to allow the blood to flow through as it should, it's called stenosis. When the heart valves don't close properly and allow blood to leak through, it's called regurgitation [7].
Ventricular septal defect (VSD): -Ventricular septal defect (VSD) is the heart defect from birth, here there is a hole in the wall between ventricular chambers of heart [7].
Thrombus: -Thrombus is the unwanted portion of muscle or clot of blood inside the chambers of heart that blocks the flow of blood through heart which cause heart attack at further stage [7].
International Journal of Emerging Technology and Advanced Engineering
Website: www.ijetae.com (ISSN 2250-2459,ISO 9001:2008 Certified Journal, Volume 5, Issue 5, May 2015)
272
B. Basics of echocardiographyEchocardiography or echo, is a painless test that uses sound waves to create moving pictures of your heart. The pictures show the size and shape of your heart. They also show how well your heart's chambers and valves are working [3] [18]. Echo also can pinpoint areas of heart muscle that aren't contracting well because of poor blood flow or injury from a previous heart attack. A type of echo called Doppler ultrasound shows how well blood flows through your heart's chambers and valves [18].Echo can detect possible blood clots inside the heart, fluid build-up in the pericardium (the sac around the heart), and problems with the aorta. The aorta is the main artery that carries oxygen-rich blood from your heart to your body [18].
C. Structure of Heart
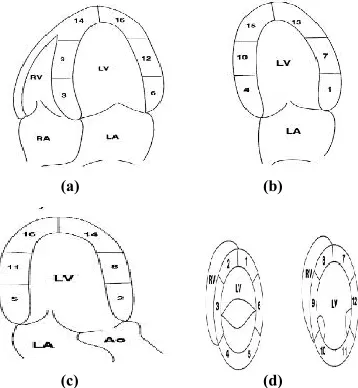
Echo images are collected from four standard views apical 4 chamber representation, apical 2 chamber representation, parasternal long axis (PLAX) or apical 3 chamber representation, and represents parasternal short axis (PSAX) [3] as shown in the Fig. I below.
(a) (b)
(c) (d)
Fig. I: - Representations of heart a) apical 4 chamber representation, b) apical 2 chamber representation, c) parasternal long axis (PLAX) or apical 3 chamber representation, d) represents parasternal short
axis (PSAX) [3].
III. PROPOSED METHOD
Thrombus detection process is divided in to three steps. Preprocessing, LV segmentation and Detection of thrombus form LV. In preprocessing step the frames are extracted and then Lee Filter [13] is been applied on them to remove speckle noise.
[image:2.612.322.590.243.561.2] [image:2.612.90.269.389.583.2]In second step the region of interest (ROI) is been detected using Hough transformation [14] and then LV is been detected using active contour model [12]. In last step the intensity based segmentation [1] is been performed on the LV region and some other operations like morphological opening, largest connected component and edge detection to detect thrombus and plot it in original video. The flow about the proposed method is shown in the Fig. II.
Fig. II: - Flow of Proposed Method
A. Preprocessing
This is the first part of our method. At this stage the input video is been extracted to frames. This frames are then further processed so to remove the speckle noise from them. So the well-known Lee Filter is been applied on the frames for the removal of speckle noise and also preserves the edges. Mathematical equation for the Lee Filter [13] is:
International Journal of Emerging Technology and Advanced Engineering
Website: www.ijetae.com (ISSN 2250-2459,ISO 9001:2008 Certified Journal, Volume 5, Issue 5, May 2015)
273
Where the variance of the pixel value and is the additive noise variance of the image.B. Detection of Left Ventrical
This is the second step of the proposed method where LV is been detected. First of all the Hough Transformation [14] is applied on the frames to detect the region of interest (ROI). Then the active contour model [12] is applied on the first frame to segment the wall of the heart. The active contour model is based on two major energy (internal and external) effecting. The energy is defined as [12]:
Where
and
is a parametric curve for s є [0, 1], and are first and second order derivatives and
.
A very popular gradient-based edge estimator is sensitive to image noise. Moreover, its application possibly leads to large segmentation errors, when object boundaries are not well defined (not sharp enough). In such cases methods based on the image area intensity value like the one proposed by Chan and Vese [12] [17] are more appropriate. The algorithm proposed by Chan-Vese [12] [17] tries to divide the image I into two disjointed parts that are represented by two constants c1 and c2.The segmentation problem as described by Chan-Vese can be stated as an energy minimization problem [12] [17]:
Then the morphological opening and largest connected component operations are applied to detect the wall of LV chamber.
C. Detection of Thrombus
This is the last stage where the thrombus is been detected. Here the LV portion of the heart is been segmented from all the frames and histogram is been generated. Now using this histogram the images are been threshold [1] by equation
Where MinColor is the minimum intensity of pixels in histogram and distance is been calculated with respect to maximum intensity of pixels. Next the morphological opening operation is been performed on the frames. Then the largest connected component operation is applied to find the thrombus. Now the Edge is detected using Sobel gradient and plotted in the original frames. At last these frames are again converted back to the video.
IV. IMPLEMENTATION &RESULTS
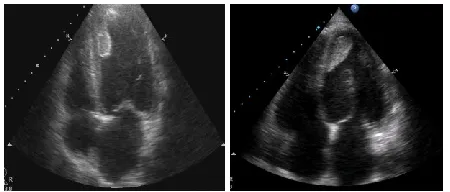
[image:3.612.332.557.433.529.2]The described algorithm has been tested on a few real echocardiography videos obtained from the Kedar Clinic, Mehsana, Gujarat, India as shown in Fig. III. In this figure, there are two different cases of thrombus in LV from two different patients.
Fig. III: -Sample input videos of thrombus
A. Preprocessing
International Journal of Emerging Technology and Advanced Engineering
Website: www.ijetae.com (ISSN 2250-2459,ISO 9001:2008 Certified Journal, Volume 5, Issue 5, May 2015)
[image:4.612.55.280.134.269.2]274
Fig. IV: - Output after the preprocessing
B. Detection of LV
After preprocessing one of the frame is further processed to detect the region of interest using Hough Transform [14]. Here 250 Hough peaks are considered and the endpoints of the line segments plotting this Hough peaks are used to detect the region of interest (ROI). Now this frame is further processed for the detection of LV using active contour model [12] as stated before. Here in our all
experiments the parameters are set to: ,
, and .Here the size of frame is
387x571 and number of iterations is 2000. This can be seen in the Fig. V.
(a) (b)
Fig. V: - (a) Walls of the chambers of heart, (b) Wall of LV.
C. Detection of Thrombus
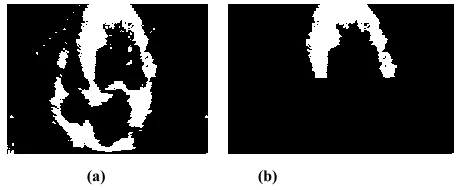
At this stage first of all the region of LV is been detected from the original frames. Then the histogram of every frame is been calculated and by using it we get distance which is 90% of maximum intensity of pixels. Next the thresholding is performed on all the frames. Now each frame is been intersected with next 5 frames to find the common region between them. After this the opening operation is performed and then the largest connected component is found. This will give the thrombus as we can see in Fig. VI (a). At last the edge detection is performed using sobel gradient [1] with fudge factor 0.3 which is shown in Fig. VI(b).
This edge is further plotted in original frames and been converted again back to videos as a result as seen in Fig. VI(c) & VI(d).
(a) (b)
(c) (d)
Fig. VI: - (a) Thrombus detected, (b) Edges of thrombus, (c) Thrombus plotted in original frame, (d) Thrombus plotting in video
of another patient.
V. CONCLUSION AND FURTHER WORK
After the demonstration and application of the above stated procedure which is the objective of the study, the method showed good potential. Thus from the experiment we can conclude that the proposed method is able to detect the thrombus from the given video and is reliable compared to the visual method as the hidden information can be detected using image processing.
In the further work other diseases like Arrhythmia, VSD and ASD which are causes for heart attack also can be detected by processing echocardiographic images.
REFERENCES
[1] E Boonchieng, W Boonchieng, R Kanjanavanit. Edge-Detection and Segmentation Methods for Two-Dimensional Echocardiograms. Proceeding of Computers in Cardiology u104; 31:541-544. 2004 IEEE
[image:4.612.330.556.173.360.2] [image:4.612.53.282.438.533.2]International Journal of Emerging Technology and Advanced Engineering
Website: www.ijetae.com (ISSN 2250-2459,ISO 9001:2008 Certified Journal, Volume 5, Issue 5, May 2015)
275
[4] Parisa Gifani, Hamid Behnam, and Zahra alizadeh sani. Noise Reduction of Echocardiographic Images Based on Temporal Information. IEEE Transactions on Ultrasonics, Ferroelectrics, and Frequency control, vol. 61, no. 4, april 2014.
[5] Panachakel, Jerrin Thomas. "Contourlet transform and iterative noise free filtering based bilayer filter for enhancing echocardiogram." Green Technologies (ICGT), 2012 International Conference on. IEEE, 2012.
[6] URL: - http://www.echojournal.org/video/.
[7] URL:-http://www.nhlbi.nih.gov/health/health-topics/topics/echo/ [8]
URL:http://healthcare.utah.edu/cardiovascular/treatments/septal-defect.php? resetcache=1.
[9] URL:-http://www.mathworks.in/discovery/image-segmentation.html [10] URL:http://en.wikipedia.org/wiki/Image_segmentation
[11] Dongju Liu ; Dept. of Comput. Sci., Beijing Jiaotong Univ., Beijing, China ; Jian Yu. Otsu Method and K-means.Hybrid Intelligent Systems, 2009. HIS '09. Ninth International Conference on (Volume:1 ).12-14 Aug. 2009.IEEE.
[12] Andrzej Skalski, Pawel Turcza. Heart Segmentation in Echo Images, 2011. Metrol. Meas. Syst., Vol.XVIII(2011), No. 2 ,pp. 305-314. [13] L.K.Jeyashree, P.V.Pramila. Robust Identification and Measurement
of Intima Media Thickness in Ultrasound Carotid Artery Images. [14] Richard O. Duda, Peter E. Hart. Use of the Hough Transform To
Detect Lines and Curves in Pictures. Comm. ACM, 15, 11-15. [15] Ye Naing Oo, Aung Soe Khaing. Left Ventricle Segmentation from
Heart ECHO Image Unsing Image Processing Tecniques. IJSETR, Volume 3, Issues 6, June 2014.
[16] J.B.Santos, D. Celorico, J. Varandas, J. Dias. Automatic segmentation of echocardiography Left Ventricular images by windows adaptive thresholds. International Congress on Ultrasonics, Vienna April 9-13, 2007.
[17] Chan, T.F., Vese, L.A. (2001). Active contours without edges, IEEE Transactions on Image Processing, 10(2), 266-277.