International Journal of Emerging Technology and Advanced Engineering
Website: www.ijetae.com (ISSN 2250-2459, ISO 9001:2008 Certified Journal, Volume 7, Issue 12, December 2017)
302
Comparison of Hollow Spherical and Solid Spherical
Connectors Used In Guyed Tower
Paras M. Patel
1, V. R. Panchal
2, V. A. Arekar
3, Vikki K. Shah
41 Post Graduate Student (Structural Engineering), Department of Civil Engineering, Chandubhai S. Patel Institute
of Technology, Charotar University of Science and Technology, Changa, Gujarat, India
2
Professor and Head, Department of Civil Engineering, Chandubhai S. Patel Institute of Technology, Charotar University of Science and Technology, Changa, Gujarat, India
3Assistant Professor, Department of Civil Engineering, Birla Vishvakarma Mahavidyalaya, Vidhyanagar,Anand,
Gujarat, India
4
Assistant Professor, Department of Civil Engineering, Apollo Institute of Engineering and Technology, Ahmedabad, Gujarat, India
Abstract— Transmission line tower is important in the operation of a reliable electrical power system that is considered as a lifeline system. The erection time for angle section with bolted connection is more. The connector connecting the members of transmission line tower plays an important role in designing the tower. So in this study tubular circular section with different spherical connector are used to develop more effective connector by comparing hollow spherical and solid spherical connector. Analysis of the tower is carried out in STAAD.Pro V8i software using tubular circular section and axial forces obtained from these software is used for the analysis of connector. Modeling of these connectors is done in Creo. Four different diameters 120, 130, 140 and 150 mm are used to compare the results of the principal and shear stresses of hollow and solid spherical connectors from ANSYS. It is observed that by using hollow spherical connector stresses of connector is increased while weight of the connector decreases.
Keywords— Hollow Spherical Connector, Solid Spherical Connector, Guyed Tower, ANSYS, STAAD.Pro V8i,CREO
I. INTRODUCTION
Electricity is most versatile and convenient form of energy. Per capita consumption of electricity is considered to be yard stick for assessing the growth of economy of any state or a country. Power generation, transmission and distribution system is therefore growing exponentially all over the world. The guyed tower have become the dominant type for use on transmission lines remote from urban areas or where land use restrictions are prohibitive. Generally the erection time of bolted connection is more, so by using tubular pipe section and spherical connectors makes work more rapid.
There have been many studies for different types of
connectors. Koushky et al. [1] investigated the behavior of
connector at composite nodes for space structures. They found out the stresses at joints and concluded that length of end flattening in members is important. Luo et al. [2] developed the flexible connector for the plane truss structures based on finite element method. Sheth and Arekar [3] developed the THH 150 connector for the 3D space structures and compared the maximum principal stresses of both the connectors. They concluded that, in the top layer of the structure compressive forces are predominant. Patil and Arekar [4] observed that the critical connector for the double layer grid structures. They found that the THH connector due to its uncomplicated geometry and ease of fabrication are the alternative option of the double layer grid structures.
In this present study, hollow spherical and solid spherical Connectors are used in guyed tower and compared on the
basis of maximum principal stress, minimum principal stress and maximum shear stress.
II. ANALYSISOFTHEGUYEDTOWER
International Journal of Emerging Technology and Advanced Engineering
Website: www.ijetae.com (ISSN 2250-2459, ISO 9001:2008 Certified Journal, Volume 7, Issue 12, December 2017)
[image:2.612.319.568.129.314.2]303
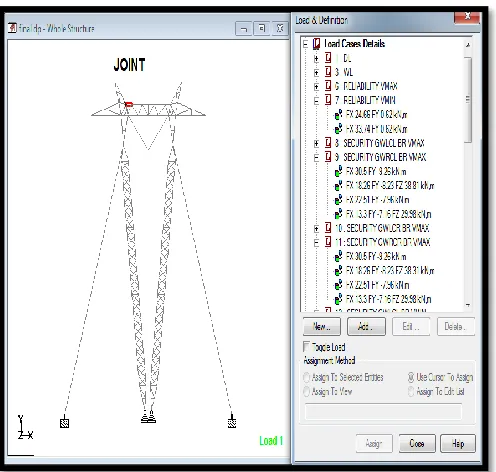
Figure 1 Analysis of the guyed tower as per IS 802-2015III. MODELLINGANDANALYSISOFSPHERICAL
CONNECTORS
In present study, solid spherical connector and hollow spherical connector of different diameters (120mm, 130mm, 140mm and 150mm) in which hollow connector has constant 20mm thickness are modelled in CREO and
analysed in ANSYS to calculate the stresses. Analysis of
the guyed tower is carried out with pipe sections in STAAD.Pro V8i. and the axial forces from these software is used to design the spherical connector at all joints. In present study, the spherical connectors are used at the joint shown in Figure 1.
In present study the theory adopted to calculate permissible stress is maximum shear stress theory which is shown in equation 1.
(σ
1- σ
3)
σ
y (1)where,
σ
1=
Maximum principal stressσ
3=
Minimum principal stressσ
y=
Maximum shear stressFigure 2 shows solid spherical and hollow spherical connector.
Figure 2 Solid spherical and hollow spherical connector
[image:2.612.49.297.133.369.2]Different forces applied on spherical connector are shown in Figure 3.
Figure 3 Forces acting on connector
IV. RESULTOFHOLLOWSPHERICAL
CONNECTORS
[image:2.612.321.569.369.558.2]International Journal of Emerging Technology and Advanced Engineering
Website: www.ijetae.com (ISSN 2250-2459, ISO 9001:2008 Certified Journal, Volume 7, Issue 12, December 2017)
[image:3.612.52.560.85.711.2]304
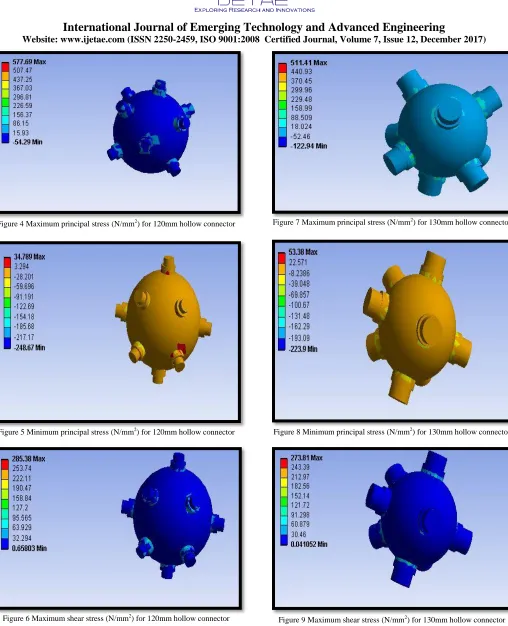
Figure 4 Maximum principal stress (N/mm2) for 120mm hollow connectorFigure 5 Minimum principal stress (N/mm2) for 120mm hollow connector
[image:3.612.50.285.133.299.2]Figure 6 Maximum shear stress (N/mm2) for 120mm hollow connector
Figure 7 Maximum principal stress (N/mm2) for 130mm hollow connector
Figure 8 Minimum principal stress (N/mm2) for 130mm hollow connector
[image:3.612.321.569.321.508.2]International Journal of Emerging Technology and Advanced Engineering
Website: www.ijetae.com (ISSN 2250-2459, ISO 9001:2008 Certified Journal, Volume 7, Issue 12, December 2017)
305
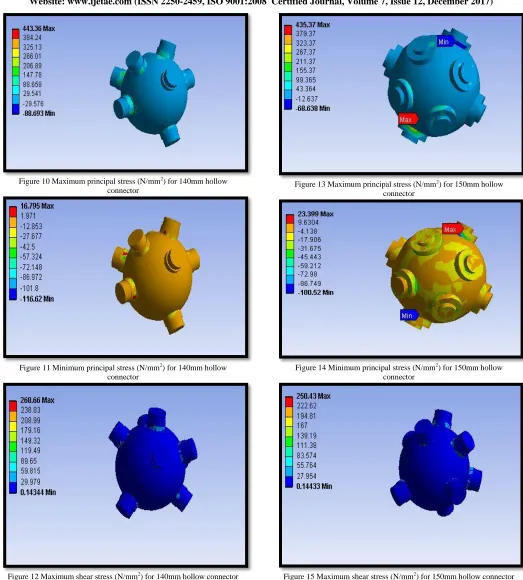
Figure 10 Maximum principal stress (N/mm2) for 140mm hollowconnector
Figure 11 Minimum principal stress (N/mm2) for 140mm hollow
connector
Figure 12 Maximum shear stress (N/mm2) for 140mm hollow connector
Figure 13 Maximum principal stress (N/mm2) for 150mm hollow
connector
Figure 14 Minimum principal stress (N/mm2) for 150mm hollow
[image:4.612.45.568.123.703.2]connector
International Journal of Emerging Technology and Advanced Engineering
Website: www.ijetae.com (ISSN 2250-2459, ISO 9001:2008 Certified Journal, Volume 7, Issue 12, December 2017)
306
V. RESULTOFSOLIDSPHERICALCONNECTORS
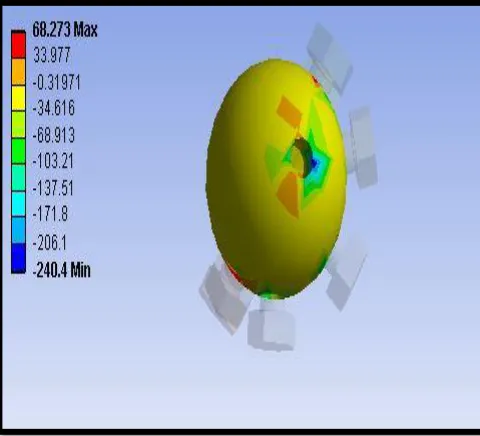
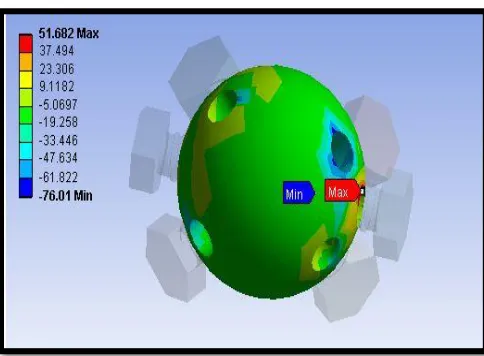
[image:5.612.324.570.136.298.2]The analysis of solid spherical connectors carried out from finite element software ANSYS, the maximum principal stress (tension), minimum principal stress (compression) and maximum shear stress are respectively shown in Figures 16 to 27 for different diameters are 120mm, 130mm, 140mm and 150mm.
[image:5.612.325.569.326.488.2]Figure 16 Maximum principal stress (N/mm2) for 120mm solid connector
Figure 17 Minimum principal stress (N/mm2) for 120mm solid connector
[image:5.612.50.290.461.679.2]Figure 18 Maximum shear stress (N/mm2) for 120mm solid connector
Figure 19 Maximum principal stress (N/mm2) for 130mm solid connector
[image:5.612.324.570.518.679.2]International Journal of Emerging Technology and Advanced Engineering
Website: www.ijetae.com (ISSN 2250-2459, ISO 9001:2008 Certified Journal, Volume 7, Issue 12, December 2017)
[image:6.612.59.570.105.706.2] [image:6.612.326.568.132.301.2]307
Figure 21 Maximum shear stress (N/mm2) for 130mm solid connectorFigure 22 Maximum principal stress (N/mm2) for 140mm solid connector
[image:6.612.47.296.136.300.2] [image:6.612.50.293.326.494.2]Figure 23 Minimum principal stress (N/mm2) for 140mm solid connector
Figure 24 Maximum shear stress (N/mm2) for 140mm solid connector
Figure 25 Maximum principal stress (N/mm2) for 150mm solid connector
[image:6.612.320.572.328.492.2] [image:6.612.325.567.513.691.2] [image:6.612.48.287.519.691.2]International Journal of Emerging Technology and Advanced Engineering
Website: www.ijetae.com (ISSN 2250-2459, ISO 9001:2008 Certified Journal, Volume 7, Issue 12, December 2017)
308
Figure 27 Maximum shear stress (N/mm2) for 150mm solid connectorVI. COMPARISIONOFHOLLOWSPHERICALAND
SOLIDSPHERICALCONNECTORS
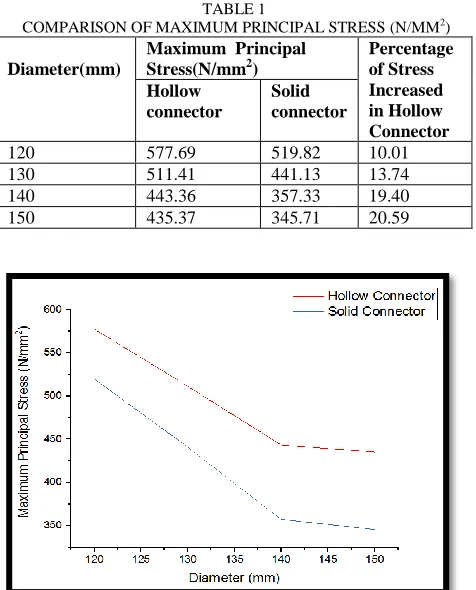
[image:7.612.288.561.126.704.2]Tables 1, 2 and 3 shows result of maximum principal stress, minimum principal stress and maximum shear stress of hollow connector and solid connector. Figures 28, 29 and 30 shows the graphical comparison of these results.
TABLE 1
COMPARISON OF MAXIMUM PRINCIPAL STRESS (N/MM2)
Diameter(mm)
Maximum Principal
Stress(N/mm2)
Percentage of Stress Increased in Hollow Connector Hollow connector Solid connector
120 577.69 519.82 10.01
130 511.41 441.13 13.74
140 443.36 357.33 19.40
150 435.37 345.71 20.59
[image:7.612.49.293.135.298.2]Figure 28 Comparison of maximum principal stress N/mm2)
TABLE 2
COMPARISON OF MINIMUM PRINCIPAL STRESS (N/MM2)
Diameter(mm)
Minimum Principal
Stress(N/mm2)
Percentage of Stress Increased in Hollow Connector Hollow connector Solid connector
120 248.67 240.4 3.32
130 223.69 203.82 8.88
140 116.62 92.13 20.99
150 100.52 76.01 24.38
Figure 29 Comparison of minimum principal stress (N/mm2)
TABLE 3
COMPARISON OF MAXIMUM SHEAR STRESS (N/MM2)
Diameter(mm)
Maximum Shear
Stress(N/mm2)
Percentage of Stress Increased in Hollow Connector Hollow connector Solid connector
120 285.38 260.6 8.68
130 273.81 222.04 18.90
140 268.66 172.53 35.68
150 250.43 156.83 37.37
[image:7.612.51.289.407.702.2]International Journal of Emerging Technology and Advanced Engineering
Website: www.ijetae.com (ISSN 2250-2459, ISO 9001:2008 Certified Journal, Volume 7, Issue 12, December 2017)
[image:8.612.50.288.186.313.2]309
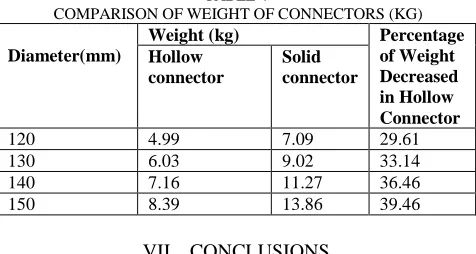
Table 4 shows the comparison between weight of hollow spherical and solid spherical connector. This weight is obtained from CREO software.TABLE 4
COMPARISON OF WEIGHT OF CONNECTORS (KG)
Diameter(mm)
Weight (kg) Percentage
of Weight Decreased in Hollow Connector Hollow connector Solid connector
120 4.99 7.09 29.61
130 6.03 9.02 33.14
140 7.16 11.27 36.46
150 8.39 13.86 39.46
VII. CONCLUSIONS
Conclusions are derived from this comparative study are as follow:
1) The value of both principal stress and shear stress
decreases with increase in diameter for spherical connector.
2) The value of maximum principal stress, minimum
principal stress and maximum shear stress are increased from 10% to 21%, 3% to 24% and 8% to 37% respectively as diameters of connector are increased from range of 120 to 150 while using hollow spherical connector instead of solid spherical connector.
3) The value of weight decreased from 30% to 40%
as hollow spherical connector is used instead of solid spherical connector.
4) From above results it is observed that hollow
spherical connector is more effective than solid spherical connector.
References
[1] Koushky, A.L, Dehdashti, G. and Fiouz, A. (2007), “Nonlinear analysis of double layer grid with compositive nodes under symmetric and unsymmetrical gravity loads, International journal of space structures”, 22(2), pp 133-140.
[2] Luo, Y., Xu, M and Zhang, X. (2010), “nonlinear self-defined truss element based on the plane truss structure with flexible connector, Elsevier journal”, pp 3156-3169.
[3] Sheth, N. D and Arekar, V. A., (2014), “comparison of principal stresses in space structure connectors”, International journal of Latest Technology in Engineering, Management & Applied Science, 3(5), pp 42-45.
[4] Patil, D. Y., Patil, H. S. and Arekar, V. A., (2016), “Development of new connector for double layer space grids”, pp 1-4.