! " # $#$ !% & &$
' ( ))) *
An Efficient K-Means with Microarray Gene Expression Using Affinity Propagation
for Cancer Dataset
D. Napoleon Assistant Professor Department of Computer Science School of Computer Science and Engineering
Bharathiar University School of Computer Science and Engineering
Bharathiar University Coimbatore, Tamil Nadu, India
Abstract: Clustering is an important topic in data mining research. Clustering attributes, the search dimension of a data mining algorithm .K-means algorithm is one of the basic and most simple partitioning clustering techniques. The main strength of the algorithm is that it can quickly determine Clustering’s of the same point set for many values of k This paper presents an clustering method which is able to group genes based on their interdependence so as to mine meaningful patterns from the gene expression data on leukemia dataset .Here the algorithm used is Efficient K-Means, X-Means, and Affinity Propagation.
Keyword: Data Mining, Efficient K-Means, X-Means, Affinity Propagation, leukemia.
I. INTRODUCTION
Data mining is the process of discovering useful information that is patterns underlying the data Powerful techniques are needed to extract patterns from large data because traditional statistical tools are not efficient enough any more Clustering has been a widely studied problem in a variety of application domains The k-means method has been shown to be effective in producing good clustering results for many practical applications. However, a direct algorithm of k-means method requires time proportional to the product of number of patterns and number of clusters per iteration. This is computationally very expensive especially for large datasets. Clustering can be considered the most important unsupervised learningproblem; so, as every other problem of this kind, it deals with finding a structure in a collection Of unlabeled data. A loose definition of clustering could be “the process of organizing objects into groups whose members are similar in some way”. Clustering could be “the process of organizing objects into groups whose members are similar in some way”. A clusteris therefore a collection of objects which are “similar” between them and are “dissimilar” to the objects belonging to other clusters.[8]
Affinity Propagation has several advantages over alternative clustering and topic modeling approaches. K-means clustering algorithms assign each object to the best cluster. AP, on the other
hand, is a clustering algorithm that finds the best assignment of all objects to clusters at the same time. Moreover, AP produces an exemplar that can best “summarize” the cluster. In colon and leukemia data, can effectively compress the stream of data,. Affinity propagation make hard decisions on the cluster centers at each iteration. Affinity propagation is a low error, high speed, flexible, and remarkably simple clustering algorithm.
Data mining techniques have been used over gene expression data a common aim is to identify groups of genes
or samples in which the members behave in similar ways. the data set used in this paper is leukemia (a cancer dataset) Golub et al (Golub, 1999), Alizadeh et al (Alizadeh, 2000), Bittner et al (Bittner,2000) and Nielsen et al (Nielsen,2002) have considered the classification of cancer types using gene expression datasets. We compare the clustering algorithm in this paper.
II. EFFICIENT K-MEANS
Efficient K-Means Algorithm (Zhang et al., 2003) is an improved version of k-means which can avoid getting into locally optimal solution in some degree, and reduce the probability of dividing one big cluster into two or more ones owing to the adoption of squared-error criterion.
Algorithm: Improved K-Means Algorithm
(S, k), S={x1,x2,…,xn }
j
C¸ [
1, k1]6. Now apply K-Means algorithm again on dataset S for k1 clusters.
7. Combine two nearest clusters into one cluster and recalculate the new cluster center for the combined cluster until the number of clusters reduces into k.
III. X- MEANS ALGORITHM
X-means algorithm (Dan Pelleg and Andre Moore, 2000) searches the space of cluster locations and number of clusters efficiently to optimize the Bayesian Information Criterion (BIC) or The Akaike Information Criterion (AIC) measure. The technique is used to improve the speed for the algorithm. In this algorithm, number of clusters is computed algorithm initially for k clusters till convergence. Where k is equal to lower bound supplied by the user.
Step2:(Improve -Structure) This structure improvement step begins by splitting the each cluster center into two children in opposite directions along a randomly chosen vector. After that we run k-means locally within each cluster for two clusters. The decision between the children of each center and itself is done comparing the BIC-values of the two structures.
Step 3: if k> =kmax (upper bound) stop and report to Best scoring model found during search otherwise Go to step 1.
IV. AFFINITY PROPAGATION
Clusters gradually emerge during the message-passing procedure. Affinity propagation takes as input a collection of real-valued similarities between data points, where the similarity s(i,k) indicates how well the data point with index k is suited to be the exemplar for data point i. When the goal is to minimize squared error, each similarity is set to a negative squared error (Euclidean distance):
For points xi and xk, s(i,k) = −||xi − xk||2.z
s(i, k): the similarity of point i to point k.
p(j): the preferences array which indicates the preference that data point j is chosen as a cluster center.
idx(j): the index of the cluster center for data point j.
dpsim: the sum of the similarities of the data points to their cluster centers.
netsim: the net similarity (sum of the data point similarities and preferences).
expref: the sum of the preferences of the identified cluster centers
netsim: the net similarity (sum of the data point similarities and preference)
There are two kinds of message exchanged between data points, and each takes into account a different kind of competition. Messages can be combined at any stage to decide which points are exemplars and, for every other point, which exemplar it belongs to. The responsibility r(i,k),
k, reflects the accumulated evidence for how well-suited point k is to serve as the exemplar for point i, taking into account other potential exemplars for point i . The “availability” a(i,k), sent from candidate exemplar point k to point i, reflects the accumulated evidence for how appropriate it would be for point i to choose point k as its exemplar, taking into account the support from other points that point k should be an exemplar . r(i,k) and a(i,k) can be viewed as log-probability ratios. To begin with, the availabilities are initialized to zero: a(i,k) = 0. Then, the responsibilities are computed using [3]
Steps:
Step1: Initialization the availability a (i.k) to zero
a (i, k)=0 (1)
Step2: update the responsibility using rule
r(i,k) s(i ,k) – max {a(i, k'). s(i, k' )}.
k's.t. k' k (2)
Step3: update the availability using the rule
a (i , k ) min{0, r (k ,k) max{0,r(i' ,k)}}
i' s.t. i' i ,k (3) The self-availability is updated differently a (k, k ) max{0, r (i' , k)}. (4)
i' s.t. i' k
Step 4: The message-passing procedure may be terminated after a fixed number of iterations, after changes in the messages fall below a threshold or after the local decisions stay constant for some number of iterations. Availabilities and responsibilities can be combined to make the exemplar decisions. For point i, the value of k that maximizes a(i, k)+r(i, k) either identifies point i as an exemplar if k=i or identifies the data point thatis the exemplar for point i. When updating the messages, numerical Oscillations must be taken into consideration. As a result,
clustering.
A
Figure 1. Affinity propagation message passing between data point
The emergence of exemplars during each iteration of affinity propagation are shown. We use leukemia dataset with 50-genes Average accuracy rate of these variants of K-Means are shown below in table
Figure 2.Cluster Formation in Matlab
V. DATASET
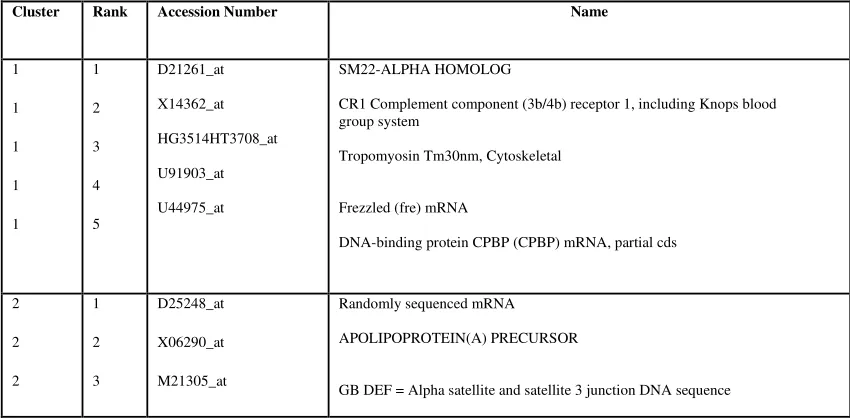
Table 1: Result Over Clustering Algorithm Using 50 Gene leukemia Dataset (Total Number of Records Present In Data Set =72)
Cluster Rank Accession Number Name
1
1
1
1
1
1
2
3
4
5
D21261_at
X14362_at
HG3514HT3708_at
U91903_at
U44975_at
SM22-ALPHA HOMOLOG
CR1 Complement component (3b/4b) receptor 1, including Knops blood group system
Tropomyosin Tm30nm, Cytoskeletal
Frezzled (fre) mRNA
DNA-binding protein CPBP (CPBP) mRNA, partial cds
2
2
2
1
2
3
D25248_at
X06290_at
M21305_at
Randomly sequenced mRNA
APOLIPOPROTEIN(A) PRECURSOR
2
Myelin Proteolipid Protein, Alt. Splice 2
HLA-G MHC class I protein HLA-G
3
GB DEF = Class IV alcohol dehydrogenase 7 (ADH7) gene, 5' flanking region
VI. CONCLUSION
The leukemia dataset is compare with clustering algorithm the K-Means use in this study is efficient k-Means, X-k-Means, and Affinity Propagation. Analysis of 50 gene leukemia .the average accuracy of affinity propagation is better than efficient K-Means and X-Means. The convergence rate is also higher and speed of execution time is good.
However the variations of k-means required more trails to reach at a stable and good clustering solution. Performance of this algorithm can be improved with the help of variants clustering algorithm, k-mediods, and fuzzy logic to get better quality of cluster. So these algorithm help to get good result in future.
Table 2
Clustering Algorithm Correctly Classified clustering large data sets with categorical values,” Data Mining and Knowledge Discovery, 1998,
[2] Frey, B.J., Dueck, D., 2006. Mixture Modeling by Affinity Propagation. Neural Information Processing neural information processing system
[3] Brendan j.Frey and Delbert Duec clustering passing message between data point science, 315(5814):972{976} [4] G.W. Milligan, M.C. Cooper, An examination of
procedures for determining the number of clusters in a data set, Psychometrika 50 (1985) 159–179.
[5] Anjan Goswami. Department of Computer Science and Engineering” Fast and Exact Out of-Core and Distributed K-Means Clustering 2001
[6] Bagirov, A.M.[ Adil M.], Modified global k-means algorithm for minimum sum-of-squares clustering problems, October 2008
[7] E. Papageorgiou, I. Kotsioni, A. Linos, “Data Mining: A New Technique In Medical Research”, Hormones 2005, 4(4):189-191
[8] Jaiwei Han, Michelinne Kamber, “Data Mining: Concepts and Techniques “, 2001, II Edition
[9] Jason Shasha (EDS), “Data mining in bioinformatics” Pg. no: 654,
[10] MacQueen, J.B. (1967). Some Methods for Classification and Analysis of Multivariate Observations. In Proc. of 5th Berkley Symposium on Mathematical Statistics and Probability, Volume I: Statistics, pp. 281– 297.
[11]Pawlak. Z. Rough Sets International Journal of Computer and Information Sciences, (1982), 341-356. [12] P awan Lingras, Chad West. Interval set Clustering of
Web users with Rough k-Means, submitted to the Journal of Intelligent Information System in 2002
[13] Yeung K.Y, Haynor D.R, Ruzzo W.L. Validating clustering for gene expression data. Bioinformatics. 2001. [14] Zhang Y. , Mao J. and Xiong Z.: An
efficientClustering algorithm, In Proceedings of Second International Conference on Machine Learning and Cyber netics, November 2003.
[15] L. Kaufman and P. J. Rousseeuw, Finding Groups in Data: an Introduction to Cluster Analysis, John Wiley & Sons, 1990.
[16] Springer T.L. Wang, Mohammed J. Zaki, Hannu T.T Toivonen and Dennis International Edition tumours: a gene expression study. Lancet2002
[17] Jason T.L. Wang, Mohammed J. Zaki, Hannu T.T Toivonen and Dennis Shasha (EDS), “Data mining in bioinformatics” Pg. no: 65
AUTHOR PROFILE
D. Napoleon received the Master’s Degree in Computer Applications from Madurai Kamaraj University, Tamil Nadu, India in 2002, and the M.Phil degree in Computer Science from Periyar University, Salem, Tamil Nadu, India in 2007. He has published articles in National and International Journals. He has presented papers both in National and International Conferences. His Current research interest includes: Knowledge discovery in Data Mining and Computer Networks.
![Table 2 Correctly Average 4(4):189-191 [8]](https://thumb-us.123doks.com/thumbv2/123dok_us/707258.1078873/4.612.64.287.386.629/table-correctly-average.webp)
