University of South Carolina
Scholar Commons
Theses and Dissertations
2017
Development of Novel Catalysts for Air Pollution
Control
Chao Wang
University of South Carolina
Follow this and additional works at:https://scholarcommons.sc.edu/etd
Part of theChemical Engineering Commons
This Open Access Dissertation is brought to you by Scholar Commons. It has been accepted for inclusion in Theses and Dissertations by an authorized administrator of Scholar Commons. For more information, please [email protected].
Recommended Citation
Wang, C.(2017).Development of Novel Catalysts for Air Pollution Control.(Doctoral dissertation). Retrieved from
D
EVELOPMENT OF NOVEL CATALYSTS FORA
IR POLLUTION CONTROLby
Chao Wang
Bachelor of Science Fudan University, 2012
Submitted in Partial Fulfillment of the Requirements
For the Degree of Doctor of Philosophy in
Chemical Engineering
College of Engineering and Computing
University of South Carolina
2017
Accepted by:
Jochen Lauterbach, Major Professor
Christopher T. Williams, Committee Member
Bihter Padak, Committee Member
Thomas Vogt, Committee Member
John W. Weidner, Committee Member
Dedication
I would like to dedicate this work to my parents Youliang Wang and Fang Li, for
Acknowledgements
First, I would like to thank my advisor Professor Jochen Lauterbach for his solid
support and constructive training in my PhD study. Jochen provided very free research
space for me to do whatever I wanted to, which cultivated my independent research skills
a lot. My critical thinking was greatly improved by his training as well. In addition, I
would like to thank Jochen for providing me so many valuable opportunities to develop
my research, which include attending multiple national and international conferences,
collaborating with national labs, scholarship/grant recommendations and application of
industry trainings. In all, I appreciate his guide in my PhD research and he changed the
way I look at science.
Second, I would like to acknowledge Research Assistant Professor Erdem Sasmaz
and Cun Wen for their valuable advice on my research. Discussions with them helped me
built up a more careful and responsible attitude on science.
I would like to thank Dr. Oleg Alexeevfor his assistance and teaching for XAS
experiment and data analysis. I also thank Dr. Andrew Binder, Dr. Todd Toops, and Dr.
Michael J. Lance from Oak Ridge National Lab for their help on reaction tests and
catalysts characterization. I would like to acknowledge my PhD committee Dr.
Christopher T. Williams, Dr. Bihter Padak and Dr. Thomas Vogt, for providing me
At last, thanks to my dear lab mates and friends at Columbia, Aixa Del Valle,
Zhiyong Wang, Emily Freeman, Katie McCullough, Sungtak Kim, Shahriar Salim, Kai
Mayeda, Kate Mingle, Calvin Tomas, Elisabeth Barrow, Juan Jimenez, Shuguo Ma,
Yunya Zhang, Weijian Diao, Yue Dai, Donald Allen Caughman, Yating Mao, Qiuli Liu,
Xin Li, Xiaoming Chen, Ye Lin, Libin Lei, Fahad Almalki, you all made my journey in
Abstract
The development of economy strongly related with increased consumption of
fossil fuels, which causes severe air pollution issue. With more and more strict
environmental regulations implemented all over the world, robust and efficient emission
control technologies need to be innovated and applied to overcome the pollution
challenge. This dissertation focuses on utilizing heterogeneous catalysis to eliminate
carbon monoxide (CO), hydrocarbons (CHx) and nitric oxides (NOx) emissions produced
from fossil fuel combustion.
The first type of catalyst is Pd supported on Mn-Ce solid solution. It achieves 100%
CO conversion at room temperature. The high activity is attributed to superior lattice
oxygen transfer interaction between Pd and support, which is discovered by multiple in
situ and ex situ characterizations. When tested under practical simulated diesel exhaust
condition, including extra water, CHx and NOx, the CO light-off temperature increased to
170oC due to competitive adsorption of CHx and NOx. The comparison of structure
characterization before and after hydrothermal aging shows that the Pd is attempting to
aggregate and solid solution support is tending to segregate. However, such minor change
is not significant enough to change catalysts activity. Doping additional Sn into MC
The second type of catalyst is Pd supported on shape and surface facet controlled
Fe and Mn-Fe nanorods. Mn can be successfully doped into Fe nanorod and form solid
solution. The Pd/Mn-Fe catalyst shows over 90% CO conversion at 50oC which is much
higher than the inactive Pd/Fe catalyst. The Pd structure and reactivity change on doped
oxide surface with controlled facet will be elucidated. The goal of this study is to provide
new fundamental insight on metal-support interaction and active sites design approach.
The third type is SSZ-13 zeolite based catalyst, which has small pore structure
and excellent hydrothermal stability. By ion exchange method, metal cations can be
introduced into the zeolite pores and function as active sites. The active sites can be used
in the ammonia selective catalytic reduction (NH3-SCR) of NOx, which is a major NOx
reduction technology in heavy duty trucks and coal power plants. Cu-SSZ-13 zeolite
catalysts show the best NO conversion (over 95%) from 150-450oC when compared with
Fe and Ce based SSZ-13. Moreover, in the presence of SO2 and H2O, which usually can
poison SCR catalysts, Cu-SSZ-13 still keeps a relatively high sulfur resistance at
Table of Contents
Dedication ... iii
Acknowledgements ... iv
Abstract ... vi
List of Figures ... x
Chapter 1 Introduction ... 1
1.1 Environmental catalysis ... 1
1.2 Diesel engine exhaust emission control ... 2
1.3 NOx emission control from stationary source ... 6
Chapter 2 Experimental and Techniques ... 10
2.1 Catalyst preparation... 10
2.2 Characterization ... 13
2.3 Reactor and catalyst evaluation ... 20
Chapter 3 Superior oxygen transfer ability of Pd/MnOx-CeO2 for enhanced low temperature CO oxidation activity ... 33
3.1 Introduction ... 33
3.2 Experimental ... 36
3.3 Results and discussion ... 40
3.4Conclusion ... 67
Chapter 4 Evaluation of Mn and Sn modified Pd-Ce based catalysts for low-temperature diesel exhaust oxidation ... 68
4.1 Introduction ... 68
4.2 Experimental ... 69
4.3 Results and discussion ... 72
4.4 Conclusion ... 93
Chapter 5 Investigation of the Pd structure and reactivity on Mn doped α-Fe2O3 nanorod with controlled facet ... 95
5.1 Introduction ... 95
5.3 Results and discussion ... 97
5.4 Conclusion ... 104
Chapter 6 Evaluation of sulfur effect on SSZ-13 zeolite catalysts for NOx reduction ... 105
6.1 Introduction ... 105
6.2Experimental ... 106
6.3 Results and discussion ... 107
6.4 Conclusion ... 112
Chapter 7 Conclusions and future work ... 113
7.1 Conclusions ... 113
7.2 Future work ... 115
References ... 117
Appendix A – List of publication ... 131
List of Figures
Figure 2.1 Pd concentration calibration curve measured from AAS. ... 20
Figure 2.2 Illustration of reactor system. ... 22
Figure 2.3 Thermocouple setup. ... 23
Figure2.4 Mass Spectrometer sample line set schematic... 27
Figure 2.5 CO concentration calibration on MS. ... 29
Figure 2.6 C3H6 concentration calibration on MS. ... 30
Figure 2.7 CO oxidation activity of benchmark 0.5% Pt/Al2O3 catalyst. CO/O2 ratio of 2:5 and GHSV = 40,000 h−1 ... 32
Figure. 3.1 XRD of the calcined 1 wt% and 5 wt% Pd catalysts. ... 41
Figure 3.2 XRD analysis of reduced Pd/CeO2 and Pd/MC ... 42
Figure 3.3 STEM images of fresh 1wt% Pd/CeO2 and Pd/MC ... 43
Figure 3.4 STEM images and high-resolution elemental mapping of the calcined 1 wt% Pd/MC. The STEM mapping was conducted by Dr. Michael J. Lance. ... 44
Figure 3.5 Pd 3d core-level XPS of the calcined Pd catalysts ... 46
Figure 3.6 Pd K-edge XANES spectra of 1 wt% Pd/CeO2 and 1 wt% Pd/MC recorded in He flow at room temperature. PdO and Pd foil are shown as a reference. ... 47
Figure 3.7 CO oxidation activity of CeO2, MC and 1wt% Pd supported catalysts: CO/O2 ratio of 2:5 and GHSV = 40,000 h−1 ... 49
Figure 3.9 Pd K-edge XANES spectra of 1 wt% Pd supported catalysts during CO
oxidation. ... 52
Figure 3.10 The FT of k3-weighted of Pd K-edge EXAFS spectra of Pd/CeO2 (top) and
Pd/MC (bottom) during CO oxidation. The EXAFS data is analyzed by Dr. Erdem Sasmaz. ... 53
Figure 3.11 Pd 3d core-level XPS of 1wt% Pd supported catalysts after in-situ XAS experiment... 55
Figure 3.12 a,b) Baseline corrected in-situ DRIFT spectra of CO chemisorption over Pd
catalysts. c,d) Peak area integral of CO adsorption sites and CO2. Gas phase CO band was
subtracted from atop Pd0-CO sites. ... 57
Figure 3.13 a,b)Baseline corrected in-situ DRIFT spectra of CO chemisorption over Pd catalysts. c) Peak area integral of peaks range from 1800 to 1100cm-1. ... 58
Figure 3.14 H2-TPR profiles of the CeO2, MC, and 1 wt% Pd catalysts. ... 60
Figure 3.15 CO/O2 transient reaction profile of 1 wt % Pd/CeO2 and Pd/MC. Evolution of
CO2, O2, CO signals were monitored as a function of time. ... 61
Figure 3.16 Ce 3d core-level XPS of the calcined Pd catalysts ... 64
Figure 3.17 Effect of reaction time on CO conversion of Pd/MC without heating by furnace... 65
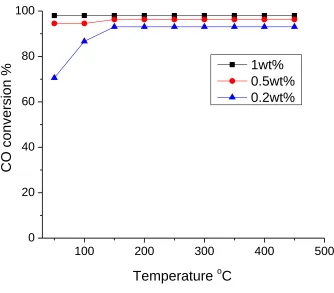
Figure 3.18 Pd loading effect on CO conversion. CO/O2 ratio of 2:5 ... 66
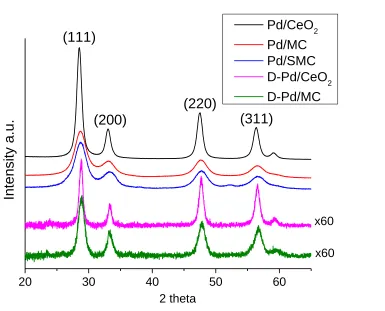
Figure 4.1 Wide-angle XRD profiles of the fresh supported Pd catalysts and degreened Pd/CeO2 (D-Pd/CeO2) and Pd/MC (D-Pd/MC). ... 73
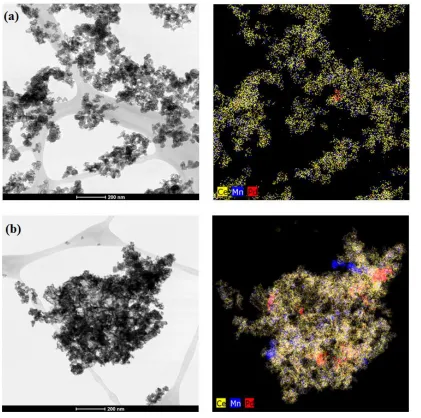
Figure 4.2 STEM images and EDX maps of 1 wt% Pd/MC before (a) and after (b)
degreening. The STEM mapping was conducted by Dr. Michael J. Lance. ... 75
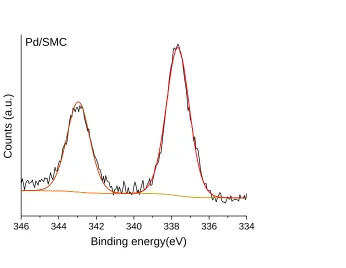
Figure 4.3 Pd 3d core-level XPS spectra of fresh Pd/SMC catalyst. ... 76
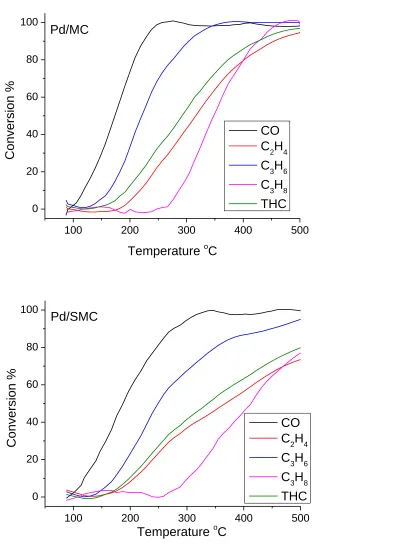
Figure 4.4 Catalytic performance of the degreened Pd/CeO2, Pd/MC, and Pd/SMC
catalysts under simulated diesel exhaust oxidation. ... 78
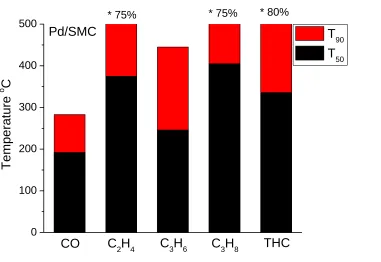
Figure 4.5 T50 and T90 of Pd catalysts for CO and HC conversion. * represents the
maximum conversion if it is under 90%. ... 80
Figure 4.6 CO and C3H6 oxidation activity of 1wt% Pd/CeO2 and Pd/MC catalysts. 2%
Figure 4.7 Oxidation of accumulated C3H6 on Pd/MC surface during temperature ramp
from 100oC to 150oC. 2% CO, 1000ppm C3H6, 5% O2 and GHSV = 40,000 h−1. ... 84
Figure 4.8 Pd 3d core-level XPS spectra of fresh and degreened Pd/MC ... 85
Figure 4.9 CO and C3H6 oxidation activity of degreened Pd/MC catalysts. 2% CO, 1000ppm C3H6 (when used), 5% O2 and GHSV = 40,000 h−1. ... 85
Figure 4.10 Baseline corrected in-situ DRIFT spectra of oxidation reactions over Pd catalysts. ... 88
Figure 4.11 CO oxidation activity of Pd/SMC. CO/O2 ratio of 2:5 ... 89
Figure 4.12 CO oxidation activity of Pd-MC and Pd-SMC catalysts at room temperature with additional 200 ppm SO2. ... 91
Figure 4.13 CO conversion in the prence of 200ppm SO2 with temperature ramp from room temperature to 450oC. CO:O2=2:5, GHSV=40,000h-1 ... 91
Figure 4.14 Effect of H2O and hydrothermal aging on Pd/SMC for CO conversion. CO: O2=2:5, 8% H2O (when used), Ar balance. ... 92
Figure 4.15 Effect of GHSV on Pd/SMC for CO conversion. CO: O2=2:5, Ar balance. . 93
Figure 5.1 XRD of XRD patterns of α-FeOOH, Mn-doped α-FeOOH, α- Fe2O3, Mn doped α- Fe2O3, and 1 wt% Pd catalysts. ... 99
Figure 5.2 SEM image of Fe based nanorod supports and Pd loaded nanorods after calcination. ... 99
Figure 5.3 STEM image of Pd/Fe2O3 catalyst. ... 100
Figure 5.4 CO oxidation activity of Pd catalysts. CO/O2 ratio of 2:5 ... 101
Figure 5.5 Pd 3d core-level XPS of Pd-Fe based catalysts and PdO reference. ... 102
Figure 5.6 H2-TPR profiles of Pd catalysts and supports. ... 103
Figure 6.1 XRD patterns of SSZ-13 based catalysts... 107
Figure 6.2 SEM images of SSZ-13 before (top) and after (bottom) SCR reaction with SO2 and H2O. ... 109
Figure 6.4 NH3-SCR activity a) without H2O or SO2, b) with H2O and SO2. NO: 500
ppm, NH3: 500 ppm, O2:5%, CO2: 5%, SO2 (when used): 500ppm, H2O(when used): 8%,
N2 balance, GHSV: 40,000 h-1. ... 111
Chapter 1
Introduction
1.1 Environmental catalysis
Environmental catalysis refers to catalytic technologies for reducing emissions of
environmentally unacceptable compounds [1]. It includes a broad range of catalytic
technologies. The first typical type of technology is directly converting pollutions to
harmless product. This category includes mobile emission control, NOx reduction from
stationary sources (e.g. power plants), sulfur compounds and VOC (volatile organic
compound) conversion, conversion of ozone, formaldehyde and other organic indoor
pollutants, photocatalytic antibacterial air purification, liquid and solid waste treatment
(polymers and other solid waste), and greenhouse gas abatement or conversion. The
second type of environmental catalysis is improving chemical reaction process and
reduces the production of pollution from the process. This category contains the
application of catalysis for eco-compatible refinery, chemical catalytic processes, and
new catalytic routes to valuable products without forming undesirable pollutants.
Energy-efficient catalytic technologies are the third type. It includes catalytic combustion,
catalysis in fuel cells, catalytic devices for using renewable energy sources like solar
energy or biomass. Finally, the reduction of the environmental impact in the use or
disposal of catalysts should also be cited as part of the objectives of environmental
Among various environmental catalysis applications, this dissertation focuses on
researching two specific directions for air pollution control. The investigation of new
catalysts for low temperature diesel engine exhaust control was first explored. Next
screening for sulfur resistant catalysts for NOx reduction in coal power plants was
investigated.
1.2 Diesel engine exhaust emission control
The emissions from a diesel engine are composed of solids, liquids and gases. The
combined solids and liquids are called total particulate matter (PM) and are composed of
soot, sulfates and soluble organic fractions (SOFs). Gaseous hydrocarbons (HC), carbon
monoxide, nitrogen oxides, and sulfur dioxide make up the gas phase emissions. Several
strategies have been developed in order to reduce the quantity of pollutants emitted to the
atmosphere. The diesel oxidation catalysts (DOC) are used to oxidize CO and HC to CO2
and water before release to the atmosphere. Another potential role of the DOC is to
oxidize NO to NO2 for the passive regeneration of the diesel particulate filter (DPF). This
is located downstream of the DOC in the engine exhaust. DOC can also be used to
enhance NOx reduction in the selective catalytic reduction (SCR) process. The limiting
factor for the DOC efficiency is its light off temperature (the temperature below which
oxidation is kinetically limited), which can reduce its efficiency, especially during urban
operating conditions [2]. Up to 80% of CO and hydrocarbon emission can emit during the
automobile cold start phase [3-5].
Many categories of catalysts were developed for low temperature oxidation of CO.
Cobalt oxide (Co3O4) shows very high CO oxidation activity at and below ambient
been reported. Cunningham et al. [7] found a T50 of −54◦C for pure Co3O4 and
Thormahlen et al. [8] reported a T50 of −63◦C for Co3O4 supported on Al2O3. It was only
the pre-oxidized cobalt oxide catalyst that showed activity at these low temperatures.
Upon adding Pt or Pd to a Co3O4/Al2O3 catalyst, Meng et al. [9] found that the
temperature required for full conversion in CO oxidation could be decreased by -213oC.
However, in the complex diesel exhaust gas conditions, the low-temperature
activity of Co3O4 is inhibited by the presence of water [7, 10], hydrocarbons, and NO
[10]. Moreover, even without these inhibitors, a slow decrease in activity was observed
during steady-state CO oxidation at low temperature due to accumulation of carbonates
on the catalyst surface [7]. Like Co3O4 catalysts, the discovery of gold catalyst for low
temperature CO oxidation [11] made by Haruta and colleagues motivated a considerable
amount of research on the activity of gold-based catalysts. Gold catalysts supported on
transition metal oxides exhibited high CO oxidation activities at very low temperatures
below the freezing point (0° C) when the gold particles are smaller than about 10 nm
[12, 13]. Specifically, small gold particles (2-4 nm in diameter) have an activity at 273 K
that is more than 2 orders of magnitude larger than larger gold particles (20-40 nm in
diameter) regardless of the support being reducible or irreducible oxide [14]. Even
though gold catalysts preform good CO oxidation activity at low temperature its
applications are limited. This is due to catalyst deactivation and low stability under
reaction conditions which is caused by accumulation of carbonates on the surface and the
agglomeration of Au particles [15,16].
In practical automobile CO and hydrocarbon oxidation, the current DOC typically
on high surface area supports and oxygen storage materials [17-19]. Among them, Pd
catalysts drew much attention due to the low cost, fast light-off performance, high
oxidation capability, and sintering resistance compared to Pt and Rh catalysts [20-24].
Despite the high performance of Pd catalysts, Pd has poor CO oxidation activity at low
exhaust temperatures and deactivates by the presence of sulfur compounds in the exhaust
gas [25-26]. For instance, Pd based DOCs can emit up to 80% of CO at temperatures
below 200oC during the cold-start stage of a vehicle [20,27-28]. For diesel and efficient
lean-burn internal combustion engines, the average exhaust temperature is low, which
ultimately affects the CO oxidation performance of the catalyst [17, 29-30]. The low CO
oxidation activity of DOCs at low exhaust temperatures is typically explained with the
blocking of active sites by HCs [30-31]. Thus, novel catalysts that can maintain a high
oxidation performance at low exhaust temperatures while resisting inhibition by HCs are
desired.
CeO2 is a widely used component in DOCs due to the Ce3+/Ce4+ redox cycle.
CeO2 can store and release oxygen, depending on the exhaust gas composition. This
ability is known as oxygen storage capacity (OSC), and improves oxidation of CO and
HCs during lean and rich cycles [32]. Ceria promoted Pd catalysts exhibit high catalytic
activity for CO oxidation at low-temperatures (100oC-200oC) due to the OSC and
strong-metal support interaction (SMSI) [33-35]. In addition, CeO2 promotes noble metal
dispersion [36] and increases the activity for water-gas shift and steam reforming
reactions [37-38]. Despite the high performance of CeO2, it has low thermal stability and
tends to deactivate at temperatures above 800oC [39]. The incorporation of a secondary
The development of automobile catalysts meanwhile facilitates the fundamental
reaction mechanism study. For CO oxidation, the most cited mechanism over metal or
supported metal are the Eley-Rideal(E-R), Langmuir-Hinshelwood(L-H), and Mars-van
Krevelen(MvK) mechanisms. The E-R mechanism is based on two reaction steps in
which one reactant (e.g. O2) is first adsorbed to the surface and the second reactant
directly reacts with it in the gas phase without an adsorption step. For example, Manuel et
al. proposed an E-R reaction mechanism in which CO(g) would react on a Rhx+ site
surrounded by two O vacancies partially filled with oxygen species[42]. On the other
hand, the L-H mechanism includes the adsorption of both CO and O2 on the catalyst
surface. For example, it is widely accepted that the reaction of CO oxidation over
unsupported Pt proceeds according to an L-H mechanism, in which the determining steps
occur in the adsorbed phase. CO is not dissociated whereas O2 is generally dissociated
above 170 K[42]. The adsorbed CO then reacts with O to produce CO2. Such mechanism
is also suitable to be employed in alumina- or silica-supported catalysts, which are
considered as inert supports. It is important to note that in L-H mechanism, CO with -1
kinetic order has a strong inhibiting effect on metal sites, whereas the reaction is first
order with respect to oxygen on all the studied metals[42].
In MvK mechanism, CO reacts with lattice oxygen directly at the surface of metal
oxide catalysts leaving an oxygen vacancy. The vacancy then can be replenished by gas
phase oxygen or by mobile bulk oxygen. For instance, ceria allows the metals to work in
transient conditions when the oxygen pressure in gas phase decreases much below the
stoichiometry[ 43, 44]. Yu Yao investigated the impact of ceria on the kinetics of CO
respect to oxygen decreases and is close to zero when ceria is added to the support. Still
more remarkable, the kinetic orders with respect to CO become positive, whereas they
were negative over metal/Al2O3 catalysts. This finding was interpreted as the result of a
cooperative effect between metals and ceria (dual-site mechanism). Carbon monoxide
would be adsorbed on metal sites whereas oxygen could be adsorbed and activated on
ceria sites in close vicinity of metal particles. The kinetic orders with respect to CO and
O2 are both between 0 and 1.
1.3 NOx emission control from stationary source
The major source of nitric oxides (NOx) emission is combustion of fuels in
engines and power plants. NOx emission and SOx emissions are components of acid rain.
Furthermore, NOx and hydrocarbons can react in atmosphere and form photochemical
ozone (smog). NOx is formed in the combustion process by combination of the N2 and O2
in the air.
NH3-SCR reaction is a widely used technology for the reduction of NOx
emissions in stationary sources (e.g. gas-, oil-, and coal-power plants) and mobile sources
(e.g., diesel engines). It was discovered that NH3 can react selectively with NOx,
producing N2 and H2O. When sulfur is present in the flue gas, the oxidation from SO2 to
SO3 results in formation of H2SO4 on reaction with H2O, which can cause corrosion of
equipment. The reaction of NH3 and SO3 results in formation of (NH4)2SO3 and
NH4HSO4, which can deposits on SCR catalysts and cause the deactivation of catalysts.
Nowadays, the commercial catalysts used for SCR units in industry are mainly
TiO2-supported V2O5, promoted with WO3, with operation temperature window at 350–
as well. However, with higher reaction temperature 550oC, the catalyst loses selectivity
leading to NH3 oxidation. In addition, the active anatase structure of TiO2 with a surface
area of 80-120 m2/g irreversibly converts to rutile with a surface area of less than 10 m2/g,
which can deactivate the catalyst. Addition of WO3 and MoO3 can improve the redox
properties and activity. Although vanadium catalysts have been introduced into the
market for power plants and diesel vehicles, some problems still need to be solved, such
as rapid catalyst activity decrease above 550 ◦C due to the high activity for oxidation of
SO2 to SO3, and the toxicity of the vanadium species to the environment [51–53].
Many studies have shown that zeolites are promising catalysts for coal
combustion flue gas conditions due to their wide working temperature from 200oC to
600oC[54-60]. Zeolites comprises of tetrahedra units (TO4) through corner sharing to
form a three dimensional microporous framework. Framework TO4 generally refers to
[SiO4]4- and [AlO4]5-. Isomorphous substitution of Si4+ with Al3+ renders the zeolite
framework negatively charged. This charge is neutralized by exchangeable cations, such
as Cu2+, Na+, and K+ located in the channels or cages of the structure. Cations will try to
maximize their coordination number through interacting with O ions from the zeolite.
The O ions around the tetrahedral Al3+ are preferential anchor sites for Cu2+ cations due
to the electron neutralization [51, 54]. Compare to V-Ti based catalysts, commercially
available zeolites can keep good activity at 600oC without oxidizing NH3 to NOx. While
in a high water concentration stream from coal power plant or automobile sources, zeolite
tend to deactivate by a process called dealumination, where Al3+ in the zeolite framework
migrates out of the structure. This leads to irreversible change and, in the extreme case,
Aqueous ion exchange is the most commonly used method for preparing zeolites
with transition metal ions located at exchange sites. For instance, Cu ion-exchanged
zeolite contains aqueous Cu in the pores and cavities of the zeolite. Upon
high-temperature treatment, water is removed and the Cu cations coordinate to the surface
oxygen of the exchange sites. Cu active sites formation depends on the Si to Al ratio and
Cu loading in the zeolite framework [51]. For example, in Cu-SSZ-13 with Chabazite
structure, isolated Cu2+ in coordinated in a 6-member ring is generally considered as
active site for selective catalytic reduction of NO by NH3 (NH3-SCR). Complexes of
Cu2+ can also be ion-exchanged in the cages and channels of zeolites and can also be
synthesized in situ by ligand adsorption. The coordination chemistry of Cu2+ with
extra-framework ligands is different from the coordination chemistry in aqueous solution. This
is due to the geometric constraints in the cages. Even if the complex is similar with
regard to its ligands, encapsulation in zeolite cages and pores may also impose additional
constraints in the complex, inducing significant changes in bond lengths and angles. Such
variations could substantially influence their reactivity in activating molecules [54].
Different ion exchanged zeolites were reported to be active for NH3-SCR
reaction, such as Fe [54,55], Cu[56,57], Mn [58], and Ce [59,60]. Among such a wide
family of catalysts, iron and copper zeolites are particularly active in NH3-SCR and have
been extensively studied. Yang et al reported a Fe-ZSM-5 catalysts, with surprisingly
high NO conversions in a broad temperature window (375-600 °C) under a high gas
hourly space velocity (GHSV) of 4.6 × 10⁵ 1/h. However, at high temperatures, in the
presence of water vapor (steam), the catalyst deactivates and exhibits greatly diminished
temperatures, the aluminum in the framework becomes unstable and detaches from the
tetrahedral framework positions [61–66]. Previous work from our group indicates that
Cu-SSZ-13 zeolite catalyst exhibits higher hydrothermal stability and NOx conversion
than other Cu loaded zeolite catalysts, such as ZSM-5, in an ideal flue gas condition (NO,
NH3, O2 and N2) [67]. Moreover, Cu-SSZ-13 has found as a NH3-SCR game changing
catalyst due to its high catalytic activity, N2 selectivity compared to other ion-exchanged
SSZ-13 catalyst [68, 69]. Active sites and reaction mechanisms on Cu-SSZ-13 have been
reported in many recent papers [70-73].
Co-cations, i.e. alkali, alkaline-earth elements and rare earth metal, can direct the
Cu species and change the location of Cu species, which can further change the Cu site
structure and activity. The coordination chemistry of Cu2+ in zeolites is well established
[74]. Cu2+ preferentially coordinates in 6 membered rings with 1, 2 or 3 Al tetrahedra. It
coordinates preferentially with the oxygen atoms of the Al-tetrahedra, which are more
basic than those of the Si-tetrahedra. Some research has been performed with Ni on FAU
zeolite, where the Na+ co-cations are competing and hindering the migration of the metal
to the 6-MR channels from the super cages during thermal treatment [75]. In Cu-SSZ-13
zeolite, on the other hand, a recent study shows that Na+ cannot change the location of
Cu2+ in 6-MR, but only weaken the interaction between Cu and SSZ-13 framework,
while other larger alkali metals, such as K+ and Cs+, can limit the number of Cu2+ ions
Chapter 2
Experimental and Techniques
2.1 Catalyst preparation
2.1.1Precipitation
Precipitation method is one of the most widely used catalyst preparation
methods in industry. A common procedure for precipitation method is mixing an aqueous
metal salt solution with an aqueous alkali or ammonium carbonate. This results in the
precipitation of an insoluble metal hydroxide or metal carbonate, which is followed by
filtration, washing, drying and calcination. In the calcination step at high temperature,
these insoluble sediments can be converted to metal oxides. The metal precursors and
precipitant are generally chosen because of their high water solubility and easy removal
of unwanted elements at high temperature (e.g. NO3-, Cl-).
The final particle size and shape of catalysts can be controlled by a variety of
factors, such as solution pH, metal precursor/precipitant type, temperature and stirring
rate, surfactant e.g. PVP. Some advantages of the precipitation methods make it the most
widely and simply used methods. First, it generally provides a relatively uniform particle
size and shape distribution. In addition, pore size and distribution of catalysts can be well
If two or more metal compounds are present, they may precipitate at different
rates or in sequence, which will cause final phase separation of the catalysts. However, if
two metal or more metal compounds can precipitate simultaneously and could finally
form uniform crystal structure, such solid might have special chemical properties in
catalytic reactions due to its unique structure and components. The solid is unusually
called solid solution. More detailed synthesis steps are explained in the experimental
section of chapter 3 and 4.
2.1.2 Wet impregnation method
A carrier or support is contacted with aqueous solution of one or more metal
precursors. The water present from solution must be removed from the support through
drying in order to release the metal precursor. When most of the moisture is removed by
evaporation of liquid water, the result is that a substantial fraction of dissolved precursor
is deposited on the surface or/and pores of the support. The mixture is then dried and
calcined at high temperature to crystalize or stabilize the catalyst and removal unwanted
elements. In this step, the metal precursor decomposed to metal oxide and gas. For
example, Pd(NO3)2 precursor can decompose to PdO and NO2at 550oC.
This method is preferred in preparing supported noble metal catalysts. Because it
can spread out the metal in a finely divided a form without washing and filtering
compared to precipitation method that may cause the loss of precious metal. The noble
metal is unusually used 1wt% or less. This could greatly reduce the consumption of
expensive ingredient meanwhile maintain the active components on the surface or in the
pores of support. More detailed synthesis steps are explained in the experimental section
2.1.3 Zeolite synthesis
A general route for zeolite synthesis is the hydrothermal synthesis method that
converts a mixture of silicon and aluminum compounds, alkali metal cation (optional),
organic molecules and water through supersaturated solution into a microporous
crystalline aluminosilicate. Colloidal silica, waterglass, pyrogenic silica or silicon
alkoxides are common sources of silicon. Gibbsite, pseudo-boehmite, aluminate salts,
aluminum alkoxides are unusually used as aluminum source. Cationic and neutral organic
molecules are added as structure-directing agents or so called templates to construct Si/Al
framework.
The presence of OH ions solubilizes the gel and de-polimerizes the precursors
into silica and alumina, directing them around the cation of the structure-directing agent
(organic template). This step is known as primary nucleation and is driven by
micro-processes such as the pH of the solution and macro-micro-processes such as stirring of the gel.
After the primary nucleation, the primary structural units form polyhedra and join to form
the zeolite crystal, produced mostly by the driving force caused by the stirring of the
solution. This process is known as secondary nucleation. Once the polyhedral is formed,
it is combined with other polyhedral and multiplied; performing the crystallization
process. For this process, higher temperatures are required to promote the formation of
larger crystals.
By definition, the primary nucleation is governed by the driving force caused by
the super saturation of the solution. In other words, if the solution is too diluted in water,
no driving force exists to incorporate atoms into the zeolite framework. The primary
process when the nucleation is driven by the solution components itself (e.g. silicon and
aluminum precursors, organic template). On the other hand, it is a heterogeneous process
when it is driven by a material that will not become part of the framework. An example
for this process is the use of mineralizers such as fluorine sources or the addition of seeds.
The crystallization step is carried out in a Teflon-lined autoclave reactor under
autogenous pressures and temperatures above 140˚C. The antogenous pressure is
produced by the vapor generated by the gel inside the Teflon autoclave when it is heated.
Various parameters can affect the formation and growth of zeolites, such as molar
composition, pH, temperature and time, precursor specious and templates. More detailed
synthesis steps are explained in the experimental section of chapter 6.
2.2 Characterization
2.2.1 X-ray powder diffraction (XRD)
X-ray powder diffraction (XRD) is a quick analytical technique primarily used for
phase identification of a crystalline material and can give information on unit cell
dimensions. X-ray diffraction is a bulk technique. XRD is based on constructive
interference of monochromatic X-rays and a crystalline sample. The X-ray is generated
by a cathode ray tube. The interaction of the incident rays with the sample produces
constructive interference when conditions fulfill Bragg's Law (nλ=2dsinθ). This law
connects the wavelength of electromagnetic radiation to the diffraction angle and the
lattice spacing in a crystalline sample. Because of the random orientation of the powdered
material all possible diffraction directions of the lattice can be obtained. Conversion of
mineral has a set of unique d-spacings, which can be by compared with standard
reference patterns.
The mean crystallite size of a catalyst can be determined from the broadening of a
diffraction peak, measured at one-half the height, which is called full half maximum
width. The line broadening is inversely proportional to the crystallite size and can be used
to provide an approximation of particle size with same crystal structure. The numerical
particle size calculation can be calculated by Scherrer Equation:
Where τ is the mean size of the ordered (crystalline) domains, which may be smaller or
equal to the grain size; K is a dimensionless shape factor, with a typical value of about
0.9, but varies with the actual shape of the crystallite; λ is the X-ray wavelength; β is the
line broadening at half the maximum intensity (FWHM); θ is the Bragg angle (in
degrees). It is important to note that the lattice strain, the instrumental broadening and
other factors that can cause peak width change are simplified and neglected. To
determine the absolute particle size of a catalyst, electron microscopy imaging should be
utilized as compensate technique.
2.2.2 Electron Microscopy
Catalysts morphology, composition, surface structure and particle size are factors
that can affect reaction activity. Electron microscopy allows for imaging the surface to a
resolution of at least the nanometer scale. Two main electron microscopy techniques
were used in this dissertation are scanning electron microscopy (SEM) and scanning
SEM is used to obtain image by rastering a beam of high-energy electrons across
a sample surface of varying topography. The most commonly used imaging mode
employs secondary electrons that are emitted when the sample is excited by the electron
beam. These electrons have low energy and ensure that the signal comes from the surface
region of the specimen. The number of emitted electrons greatly depends on the angle of
the sample surface with respect to the electron beam and the detector, which construct
differences in brightness and therefore reveal the sample topography. Another imaging
mode is based on backscattered electrons, which has higher energy. This mode is
sensitive to the image intensity depends on the composition of sample, which can provide
good atomic number contrast. SEM imaging allows for viewing of a large area of sample
and it is very useful for identification of particle morphology.
Species identification is accomplished by collecting the characteristic X-rays
emitted from the sample, in a technique known as Energy Dispersive X-ray Spectroscopy
(EDS). Electron excitation causes ionization within the sample leading to X-Ray
emission which can be analyzed by solid state energy dispersive detector. Before imaging,
powder catalyst samples were placed on carbon tape adhered on an aluminum stub
without conductive coatings. SEM images were obtained using a Zeiss Ultraplus Thermal
Field Emission Scanning Electron Microscope.
While SEM provides a topographical image of a sample surface using
backscattered and secondary electrons, STEM uses a focused beam of high-energy
electrons to form a small spot that is raster-scanned over a thin sample to image the entire
depth by detecting scattered or transmitted electrons. One useful imaging mode in STEM
angles follows approximately a Z1.85 dependence corresponding to the Reutherford
scattering cross-section. Due to the incoherent scattering the HAADF-STEM images
refers to as Z-contrast images and are very useful to study catalysts containing small
metal particles. However, when the Z of the support is higher than metal particle, there is
no good contrast and thus cannot distinguish the small particle from support. In this case,
spectroscopic imaging utilizing the inelastic scattered electrons for EDS can be exploited
to generate elemental maps.
2.2.3 X-Ray Photoelectron Spectroscopy (XPS)
X-Ray Photoelectron Spectroscopy (XPS) is a surface sensitive technique to
analyze catalysts surface elemental composition and elemental oxidation states. The
physical principle is based on the photoelectric effect, which was first discovered by
Albert Einstein in 1905. Photons of a specific energy are used to excite the electronic
states of atoms below the surface of the sample. Electrons ejected from the surface are
energy filtered via a hemispherical analyzer before the intensity for a defined energy is
recorded by a detector. Since core level electrons in solid-state atoms are quantized, the
resulting energy spectra exhibit resonance peaks characteristic of the electronic structure
for atoms at the sample surface. While the X-ray may penetrate deep into the sample, the
escape depth of the ejected electrons is limited to less than10nm for energies around 1400
eV. The photoemission process, obeys the following energy conservation rule:
hν = Eb+Ek
Where hν is the photon energy, Eb is the electron binding energy, and Ek is the kinetic
energy of the photoelectron. Conventional sources typically exploit the Kα radiation
respectively. The chemical environment in which the core electron is found prior to the
photoemission event (the type of bonding, the oxidation state, the possible presence of
adsorbates) results in distinctive BE shift.
2.2.4 X-ray absorption spectroscopy (XAS)
Synchrotron-based x-ray absorption spectroscopy (XAS) has proven to be a
versatile structural probe for studying the local environments of atom in catalysts. It is a
bulk characterization method and gives averaged results.
When a beam of X-ray photons passes through a material, the incident intensity
will be decreased due to the adsorption of the material being irradiated. For a path length
dx of the radiation through the material, the decrease dI is given by:
dI=-u(E)I dx
where the linear absorption coefficient u(E) is a function of the photon energy. Integral
form of the equation is called Lambert’s law:
It=I0e-u(E)x
When the energy of the incoming photons is large enough to excite an electron from a
deeper core level to a vacant excited state, a sharp rise in the adsorption intensity appears.
This sharp rise is denoted as absorption edge.
An ray absorption spectrum is typically divided into two energy regions: the
X-ray Absorption Near-Edge Structure (XANES) region, which extends from a few eV
below an element's absorption edge to about 50 eV above the edge, and the Extended
X-ray Absorption Fine Structure or EXAFS region, which extends from about 50 eV to as
much as 1000 eV above the edge. The EXAFS region can be used to resolve structural
number of a selected atom species, while the XANES region can be used to indicate
oxidation states of the selected element.
2.2.5 Diffuse reflectance infrared Fourier transform spectroscopy (DRIFTs)
DRIFTs is a technique for analyzing surface catalytic reaction, adsorbate,
adsorption sites and reaction intermediate. It offers the advantages of easy sample
preparation. The electromagnetic radiation reflected by roughened surfaces is collected
and analyzed in IR region, which is termed as diffuse reflectance infrared Fourier
transform spectroscopy (DRIFTS). IR beam incident onto a solid sample surface can
have specular reflection, diffuse reflection, and partly penetrates into the sample. The
beam penetrated the sample can be absorbed within the particles or be diffracted at grain
boundaries, giving rise to diffusely scattered light in all directions. In diffuse reflectance
spectroscopy, there is no linear relation between the reflected light intensity (band
intensity) and concentration, in contrast to traditional transmission spectroscopy in which
the band intensity is directly proportional to concentration.
2.2.6 Temperature programmed reduction (TPR)
TPR is widely used to determine catalysts reducibility, which is greatly correlated
with catalysts activity in redox reactions. The basic chemistry is utilizing H2 to reduce
lattice oxygen of catalysts and forming H2O. The A typical process of TPR is flowing H2
in an inert gas with fixed flow rate over a catalysts in furnace. Then the catalyst is heated
up with a constant temperature ramping rate. The outlet gas passing catalysts is detected
by a mass spectrometer, from which we could tell the H2 consumption peak at certain
temperature. A H2 concentration calibration is employed to quantify the H2 consumption
reaction. The lower temperature the peak occurs, the more likely the catalysts can work at
lower temperature.
2.2.7 Atomic adsorption spectroscopy (AAS)
Atomic absorption spectroscopy (AAS) is used to determine the elemental
composition of catalyst samples. Here, AAS is used to quantify the amount of Pd loading
present in prepared catalysts. It is known that ground state atoms strongly absorb light at
a characteristic wavelength and that the amount of light absorbed at low atomic
concentrations is linearly related to the concentration of the element. In AAS, samples are
atomized and exposed to the path of a light source emitting at the characteristic
wavelength of the material. To calculate the concentration of an unknown sample, the
absorbance at the characteristic wavelength is measured and compared with a calibration
curve prepared using standards of known concentrations.
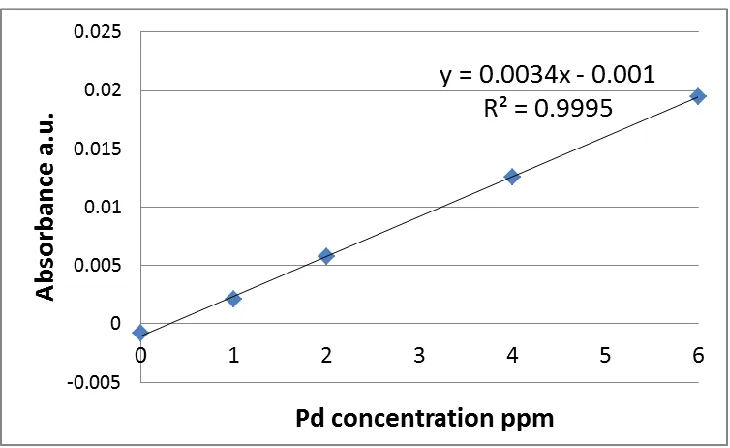
For each analysis, the calibration samples were diluted to five different
concentrations, which cover the expected concentration of the metal of interest. An
example procedure for Pd samples is described as follows. Standard solutions of 0, 1, 2, 4,
and 6 ppm Pd were prepared by diluting appropriate fractions of a stock solution of 1
mg/mL Pd in 10% HCl (Acros Organics). In the diluting procedure, 10 vol% HCl and 0.5%
LaCl3 were added to the samples for better sensitivity and accuracy. The Pd-containing
samples and the five standard solutions were nebulized into an air/acetylene flame. A Pd
hollow cathode lamp (Hamamatsu Photonics K.K.) was used as a light source. An
example of AAS calibration curve is shown in figure 2.1, which gives the absorbance as a
linear fit over the 0-6 ppm range. This calibration was applied to the synthesized Pd
catalyst samples in order to measure the actual Pd weight loadings on those samples.
Figure 2.1 Pd concentration calibration curve measured from AAS.
2.3 Reactor and catalyst evaluation
2.3.1 Reactor design
A schematic diagram of the reactor system is shown in figure 2.2. The design
consists of two tube furnaces with temperature controllers, H2O injection system, carrier
gas, mass flow controller. 1/2” stainless steel tube coated with inert silicon coating
(Silcoalloy 1000) or 3/8” quartz tube is used to load the powder catalyst sample.
Swagelok Teflon front and back ferrules are used to seal the reactor. The maximum
temperature limit for these ferrules is ca. 250oC. Since they are more than 3 inches far
away from the heating part of the reactor, the real temperature of is much lower than the
soap is necessary for each reaction test. If there is a leak, then the old ferrules should be
changed. The reactor operated at near ambient pressure over a temperature range from
25-800°C. Industrial grade flue gases including 1%NH3/N2, 1%NO/N2, 2%SO2/N2, O2,
CO, 2%C3H6/He and balanced N2 or Ar that simulate coal and automobile emission
conditions are each connected to mass flow controllers (Brooks 5850E). H2O is combined
with the carrier gas feed into a heated evaporator. The product stream was sent directly to
a mass spectrometer (MS, Hiden HAL IV RC) for analysis. One reactor is used for
catalysts reaction test, while the other is a blank one used for gas concentration
calibration during the reaction. The reason for this design is because catalyst in a single
reactor can covert reactant during temperature ramp and the MS reading of outlet gas
concentration is unknown. In the blank reactor, there is no reaction occur. So the known
concentration of a gas passing the blank reactor will not change between inlet and outlet,
which is representative for real gas concentration and can be used for calibration.
Flow rate ratio of these two reactors w adjusted by a needle valve before the blank
reactor. The flow rate is measured by a Sensidyne 800266-1 Gilibrator. Each flow rate is
measured at least 3 times in steady state to make sure the reading is repeatable and
accurate. The total flow is maintained at 800 sccm. The amount and volume of both
catalysts and quartz wool could change in different tests, so the needle valve needs to be
Figure 2.2 Illustration of reactor system.
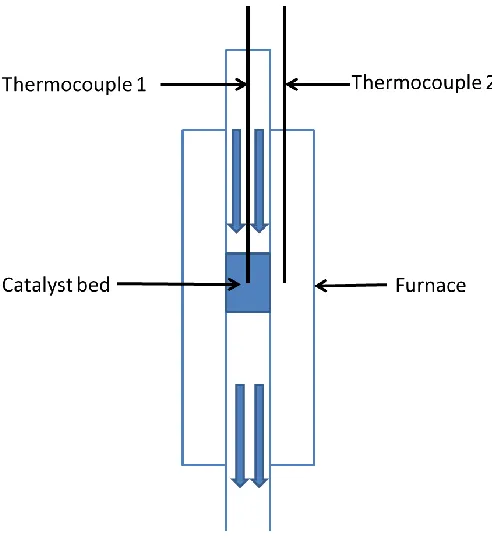
2.3.2 Temperature control
The thermocouple setup is shown in figure 2.3 K-type thermocouple 1 (Omega
Engineering, Inc., KMQ316SS-032U-12) was fitted into catalyst bed for reactor
temperature monitoring. An additional thermocouple 2 is fitted into furnace for the
purpose of interfacing with the temperature proportional integral derivative controller
(PID controller, Omega Engineering, Inc., part number CN760000). The thermocouple 1
is placed into the catalyst bed to evaluate the impact of exothermic or endothermic
catalytic reactions. The catalysts reaction temperature is reported by using the catalysts
bed temperature. Since the furnace is not openable, the catalysts actual location in it is
not visible. The length between the catalysts bed and the top of quartz tube is measure
before loading the reactor. Then the length of thermocouple is marked as the same length
Figure 2.3 Thermocouple setup.
The process of temperature control is based on following steps: read the
temperature using a K-type thermocouple (Omega), set the desired temperature, and
control via a PID controller using LabView software. The reactor furnace is a high
temperature ceramic radiant heater, supplied by Omega Engineering
(CRFC-112/120-C-A). These furnaces are insulated with ceramic fiber and can go up to 900˚C (requiring a
maximum of 5 Amps). A K-type thermocouple transmits signal to the chassis from
National Instruments (NI CDAQ-9174), which sends an input signal to the PID controller
in the PC. Once the temperature is set in the PC, the PC sends an output-triggering signal
(ON-OFF command) to the 4-channel relay module (NI-9481), placed in the second slot
range of 90-280 V for operation and a circuit prior the SSR was added to obtain the
needed power and voltage (120 V).
The final section of the temperature control system is the loop that allows the
powering of the furnaces. Each furnace requires a 500 W (4.16 Amp, 120 V) for long
furnaces. A variac autotransformer allows to step-up or step-down the voltage needed by
the furnace. In the case of this temperature control system, the variacs are set at around
50%-70% of 120 V. For cases when the furnace’s loop is overpowered, a 5 Amp fuse
would work as a safety device, shutting down the circuit to prevent the breakdown of the
furnace or the solid-state relay. During a reaction, the temperatures of blank reactor and
the reactor with catalyst are set the same to maintain the similar flow distribution.
2.3.3 Mass spectrometer
A quadruple mass Spectrometry (Hiden Analytical (HAL 201-RC), operated with
the MasSoft software) is used to analyze the outlet gas from reactors. The gas molecules
entering the ultra-high vacuum(UHV) chamber are ionized via electron ionization to be
converted majorly into positive charges. Then, the ionized molecules are accelerated
from the ion source through a set of 4 rods with a hyperbolic electric field.
A UHV chamber for the mass spectrometry was built-in-house using vacuum
components obtained from Kurt J. Lesker and/or Duniway Company. The chamber
includes one 4-way reducing cross (C-0275) with 2 ¾” conflat flanges at two ends of 4
¼”conflate flanges. At one end, the cross has a 45˚ elbow (L45-0275) and a 979 Series
Pressure Transducer (Kurt J. Lesker) used to monitor the pressure of the chamber. The
transducer is capable of obtaining pressure measurements in a wide range of conditions
Hyden Analytical, while the third end has a LVM Series Leak Valve (Kurt J. Lesker),
which provides molecular gas flow into the chamber (leak rate: 3.0*10-5 torr/s).
Generally, the achievable leak rate for leak valves are as small as 1*10-10 torr /s and they
are bake-able up to T = 450˚C. The last end of the 4-way standard cross has a conical
reducer nipple (Kurt J. Lesker: CRN600X450) and a turbo molecular pump (TurboVac
151, SN: 20900101555). The turbo molecular pump has a similar appearance to a turbine
compressor in jet engines; i.e. it uses rotating blades mounted on a shaft to direct gas
molecules into the vacuum chamber in the molecular flow regime.
In order to start the turbo molecular pump, the chamber needs to be at rough
vacuum conditions first; therefore, a 2-stage rotary vane mechanical pump (Varian
SD-451) was attached to the turbo pump exhaust to initially pull gas from the chamber and
achieve the rough vacuum conditions. The pulled gas from the chamber goes into the
roughing pump’s low-pressure stage, then to its high-pressure stage, compresses it and
then sends it to the exhaust at atmospheric pressure. It should be noted that oil is used in
the internals of the roughing pump to lubricate the pump’s mechanical components (e.g.
bearings, seals, rotor and vanes). Any failure in the roughing pump’s operation (e.g. not
enough oil, oil leaks, power outage etc.) will cause malfunction of the turbo molecular
pump and eventually damage it. Also, a valve was added to the mechanical pump (rough
pump) to prevent back-diffusion of oil vapors to the vacuum chamber in cases when the
turbo is turned off.
In order to achieve UHV conditions it is also necessary to bake-out the chamber.
The baking procedure will remove any contaminants in the UHV chamber (e.g. water and
around 110-130˚C, while the elbow around the pressure transducer is baked at lower
temperatures (ca. 80˚C) due to the transducer’s temperature limitations. The ultimate
pressure achieved with this turbo pump is 8*10-10 torr. (The maximum baking
temperature during operation at conflat flange of turbo pump is 55˚C).
The mass/charge (m/z) ratio of the ions is detected either with the Faraday or
SEM detectors in the 100 amu mass range. Maximum operable pressure of the Faraday
detector is 1*10-4 torr. The disadvantage of this detector is the low sensitivity and delay
time in the amplification system, which would explain why the signals vs. time appear
noisy compared with the signals acquired with SEM detector. On the contrary, maximum
operable pressure of the SEM detector is 5*10-6 torr and can give higher sensitivity than
the Faraday. Both of detectors are used in the experiments depending on the
concentration range of the gases.
The reference mass to charge ratios that needs to be monitored were obtained
from the NIST chemistry web book. The detectors used for each gas component depend
on the concentration that needed to be analyzed. For trace level(ppm) concentrations, the
SEM was selected due to its higher sensitivity, accuracy and lower noise level. Carrier
gases like Ar and N2 were analyzed by Faraday detector. When the MS operation
pressure is within 3*10-7 torr, all gasses will be detected by SEM.
The volumetric flow of the gas sample going to MS was reduced from 100 sccm
to 20 sccm using a 50 µm orifice provided by Swagelok. Reducing the volumetric flow to
20 sccm allows a steady pressure in the UHV chamber, which is convenient when
the orifice and leak valve is still very high compared to the volumetric flow that goes into
the MS when we open the leak valve. This is the so called “dead volume”, which can
cause longer response time in the MS. In order to shorten the response time, a vacuum
was created between the orifice and the leak valve using a roughing pump
(Varian-SD-40) to improve the flow rate in such “dead volume”, as shown in figure 2.4. With this
design, the MS can catch the composition change in seconds and enables
characterizations like H2-TPR and CO-O2 pulse reaction.
Figure 2.4 Mass Spectrometer sample line set schematic.
The operation sequence of this vacuum system is critically important. When gas
flows are introduced into the system, valve 1 and 2 should be opened first, and then the
leak valve can be opened slowly. After the reaction and calibration tests, the leak valve
should be closed first, and then valve 1 and 2 can be closed. The reason is that the
pressure in the MS is in 10-6 to 10-10 torr, which is much lower than the roughing pump
(10-1 to 10-2 torr). If valve 2 is closed while valve 1 and the leak valve are open, the
pressure difference can easily suck pump oil from the roughing pump to the MS chamber.
This can cause contamination, which is a disaster for the high vacuum system and may
For a typical reaction test, a MID mode in the MS is used to monitor the pressure
change of each gas component as a function of time. The MS is turned on for 30 min,
then Ar or N2 inert gas flow is started and the leak valve is opened until the chamber
pressure reaches 3*10-7 torr. Then the other gas flows and the temperature ramp are
started. After the temperature and MS signal reach steady state, the reaction data is taken
for analysis. Gas concentration calibration is done after each temperature ramp.
In the CO oxidation reaction, the m/z ratio for each gas is selected as follows:
CO=28, O2=32, Ar=40, H2O=18, CO2=44. It is important to note that CO2 has ca. 10%
fraction of m/z=28, which is overlapped with the m/z of CO. Hence, to calculate the CO
conversion, such CO2 contribution is subtracted from the CO signal. In the NH3-SCR
reaction, the m/z ratio of each gas is selected as follows: NO=30, NH3=17, H2O=18,
O2=32, N2=28, CO2=44, SO2=64. The NO conversion is calculated by the formula:
(NOinlet-NOoutlet)/NOinlet, where NO inlet and NO outlet represent the concentration of NO
inlet and outlet of the reactor, respectively.
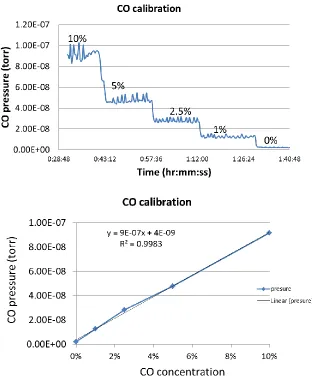
2.3.4 Gas concentration calibration
MS is sensitive to a wide variety of gas concentrations. Prior to the reaction
experiments, the mass spectrometer was calibrated at different concentrations to obtain a
calibration curve for each respective gas component of interest. The concentration of the
gas components were determined by back-calculating the calibration trend-line equation,
shown in figure 2.5. The calibration experiments demonstrated a mass spec response time
of 10 min every time a different concentration is selected. It would take more than around
the lines. Figure 2.5 shows the raw spectra and the calibration curve of CO in the range of
0% to 10% diluted in Ar. The concentration of CO is linear to the MS signal intensity
(CO pressure).
Figure 2.5 CO concentration calibration on the MS.
C3H6 has a much lower concentration than CO in diesel oxidation reactions,
which is in the ppm level. The C3H6 calibration was carried out to make sure it is
detectable by the MS, shown in figure 2.6. The calibration curve shows good linear
case, the C3H6 pressure is normalized by the Ar pressure, which is the carrier gas. This is
because the Ar pressure may fluctuate during the test and can lead to C3H6 pressure or
signal fluctuation in the MS. Through normalization, the pressure fluctuation effect can
be greatly reduced and the data quality was improved.
2.3.5 Benchmark catalyst tests
The commercial 0.5% Pt/Al2O3 catalyst (Alfa Aesar) was used as a benchmark
sample to validate traction and analysis systems. The catalyst was tested for CO oxidation
under 150, 250, 350, and 450oC for one hour at each temperature and the reactivity
corresponds to steady state activity. A gas mixture of 2.0% CO (99.999% CO, Airgas),
5% O2 (99.9999% O2, Airgas) and balance Ar (99.9999% Ar, Airgas) was fed to the
reactor via mass flow controllers. 200 mg of catalyst supported with quartz wool, was
placed in the reactor for each run and no pretreatment was performed before the reaction.
The corresponding gas hourly space velocity (GHSV) is 40,000 h-1. CO conversion is
calculated by the formula: (COinlet-COoutlet)/COinlet, where CO inlet and CO outlet
represent the concentration of CO inlet and outlet of the reactor, respectively. Calibration
of the CO concentration was carried out by switching to the blank reactor with known
inlet concentrations, which generates 4 calibration curves at each temperature. One of the
disadvantages of using mass spectrometry as analytical technique is the occurrence of
spectral skewing. By definition, spectral skewing is the term used to describe how the
relative intensities of mass spectral peaks vary due to the change in concentration of the
analyte in the ion source. In addition, the intensity of signal in the MS can gradually
decrease as running time increases. Hence, multiple calibrations could improve the data
accuracy. The CO concentration was achieved by using the calibration function and
averaged CO pressure during the reaction at each temperature.
In figure 2.7, the benchmark Pt/Al2O3 catalyst shows almost 0% CO conversion at
150oC and over 95% conversion from 250oC to 450oC. The ramp up and ramp down
consistency. The conversion curves fit quite well with many reported Pt/Al2O3 catalysts.
These tests validate the function and accuracy of the reactor and the MS. Most of the
catalytic reaction experiments in this dissertation are based on this reactor system.
Figure 2.7 CO oxidation activity of benchmark 0.5% Pt/Al2O3 catalyst. CO/O2 ratio of
Chapter 3
Superior oxygen transfer ability of Pd/MnO
x-CeO
2for enhanced low
temperature CO oxidation activity
3.1 Introduction
Carbon monoxide is a toxic pollutant and produced due to the incomplete
combustion of carbon-containing fuels [77-78]. The majority of CO emissions come from
mobile sources and catalytic oxidation of CO is the most widely used control technology
to remediate CO emissions [78]. Even though the current commercialized platinum group
metal (PGM) catalysts can reduce most of the CO content at temperatures above 200oC,
up to 80% of CO is still emitted during the cold-start stage of a vehicle due to the low
operating temperature of the catalyst [78-80].
CeO2 is a widely used component in mobile emission control catalysts due to the
Ce3+/ Ce4+ redox cycle [81-93]. CeO2 can utilize lattice oxygen reversibly for CO
oxidation depending on the exhaust gas composition, improve the dispersion of noble
metals and enhance catalyst stability at high temperatures [81]. All these promoting
effects shift the light-off temperature for CO oxidation to lower operating temperatures
and provide a stable catalyst structure [82-93]. Addition of a PGM on CeO2 as an active
phase can create adsorption sites for CO and promote CO oxidation [88,92]. Among the
oxidation capability, and better sintering resistance [93]. Recently, the effect of synthesis
methods, incorporation of a different metal oxide into CeO2, and the structural change of
pure CeO2 support have all been investigated to promote the low temperature activity
(LTA) of the Pd/CeO2-based catalysts for CO oxidation at reaction temperatures below
150°C [94]. Generally, LTA can be determined by T90, which denotes the temperature at
which 90% CO conversion occurs. For instance, Meng et al. [95] reported a PdO/Ce
1-xPdxO2-δ catalyst prepared by solution-combustion method, which showed a T90 of 130oC.
This catalyst exhibited a CO oxidation rate 100 times higher than PdOx (x=1,2) species
on pure CeO2 at 130oC and its increased activity was mainly attributed to a synergetic
effect between the PdOx species and the Ce1-xPdxO2-δ solid solution. In addition, another
Ce1-xPdxO2-δ solid solution catalyst prepared via a plasma-arc method showed a lower T90
of 75oC due to its high specific surface area and high defects concentration on the catalyst
[96]. On the other hand, highly ordered mesoporous CeO2 supported Pd catalyst showed
excellent LTA for CO oxidation. For example, Jin et al. [97] reported that Pd supported
on mesoporous CeO2 synthesized by a KIT-6 silica hard template method showed a T90 of
90oC. After H2 reduction at 150oC for 1 h, the T90 decreased to 50oC. Moreover, Pd
supported on mesoporous Co3O4-CeO2 prepared by a surfactant-template method resulted
in a T90 of 75oC without performing a H2 pretreatment [98]. A T90 of room temperature
was also reported over Pd/CeO2-TiO2 catalysts, synthesized by sol-gel precipitation and
subsequent application of supercritical fluid drying [99]. However, the LTA over
Pd/CeO2-TiO2 did not remain stable at room temperature and the CO conversion dropped