ABSTRACT
LEE, JUNG MYOUNG. An Atomic Force Microscopy Study of the Local
Hygro-expansion Behavior of Cellulose Microfibrils. (Under the direction of Dr. Joel J. Pawlak and Dr. John A. Heitmann.)
Structure-property relationships of cellulose-based materials including paper, micro-
and nano-fiber composites are often strongly influenced by environmental variables. The interaction of polymeric and crystalline structure in cellulose bio-based materials is of high technological importance. Therefore, understanding the underlying mechanism of environmental/material interactions is crucial for engineering products from bio-based
materials. This study was undertaken in an effort to develop a technique for the assessment of dimensional stability of cellulose microfibrils as a function of different relative humidity. Analysis of atomic force microscopy images showed that the local dimensional properties of cellulose microfibrils are highly responsive to variable relative humidity, and their
hygro-expansive behavior depends on the relative humidity history, and their method of preparation. The results obtained suggested that dimensional and hygro-expansive behaviors of cellulose microfibrils are related to their ultra-structural arrangements and their origin, either directly or indirectly. These findings, hopefully, will prompt an open discussion regarding the
AN ATOMIC FORCE MICROSCOPY STUDY
OF THE LOCAL HYGRO-EXPANSION BEHAVIOR
OF CELLULOSE MICROFIBRILS
by
JUNG MYOUNG LEE
A dissertation submitted to the Graduate Faculty of North Carolina State University
In partial fulfillment of the Requirements for the degree of
Doctor of Philosophy
WOOD AND PAPER SCIENCE
Raleigh, NC October 2006
To the memories of my father who belongs to heaven three months ago…,
To my mother and my wife,
BIOGRAPHY
ACKNOWLEDGMENTS
I wish to express the deepest gratitude and thanks to many people who have inspired, challenged, and assisted in this demanding journey. The completion of the journey could not have been possible without the support, patient, and generosity of everyone who has crossed my path during this time. I would especially like to thank my advisor, Dr. Joel J. Pawlak, for ideas, inspiration, and support throughout this work. He always encourages me to get through the dark tunnel by telling stories of “T-letter theory”, “a dwarf on the giant shoulder”, and “a mouse living inside a ball”. Great appreciation is also extended to my co-advisor, Dr. John A. Heitmann, for providing sound advice, fruitful discussions, and direction during this study. I also express my sincere appreciation to my committee, Dr. Dimitris S. Argyropoulos and Dr. Martin A. Hubbe, who assisted in the completion of this study and the preparation of this dissertation. Above all, your willingness to help with both my academic and personal life will always be remembered. Throughout five years I have worked together with wonderful postdoctoral associates and graduate students. Birol Uner, Yong Sik Kim, Hemant Gupta, Ved Naithani, Ana Maria Maciel, Young Jun Lee, Neeraj Sharma, Jeff Wallace, Sa Yong Lee, Sun kyu Park, Chang Woo Jeong, and Qirong Fu have all provided intellectual input or experimental assistance with various aspects of this study. I would like to thank the rest of the faculty and staff of the Wood and Paper Science Department.
TABLE OF CONTENTS
LIST OF FIGURES ... ix
LIST OF TABLES ... xvii
LIST OF ABBREVIATIONS AND SYMBOLS ... xviii
CHAPTER ONE: INTRODUCTION ... 1
A. Background ... 2
B. High resolution microscopy techniques ... 4
1. Fundamental principles of AFM... 6
2. Tip geometry and step height... 10
3. AFM applications in characterization research... 11
C. Ultrastructure in cell wall... 12
1. Wood polymers... 12
2. Organization in the cell wall ... 14
3. Physicochemical properties of cellulose microfibrils ... 15
4. The relation between a single fiber and paper ... 23
D. Enzyme technology... 24
E. References ... 29
CHAPTER TWO: RESEARCH OBJECTIVE... 41
CHAPTER THREE: TECHNIQUES FOR THE MEASUREMENT OF DIMENSIONAL CHANGES OF NATURAL MICROFIBRIL MATERIALS UNDER VARIABLE HUMIDITY ENVIRONMENTS ... 43
A. Summary ... 44
B. Introduction ... 44
C. Experimental ... 48
1. Experimental set-up ... 48
2. Reference grating ... 50
3. Preparation of cellulose aggregate fibrils (CAFs) ... 50
5. Processing algorithm to detect edges and calculate the step width, height, and
cross-sectional area ... 52
D. Results and discussion ... 55
1. Comparison of two analysis techniques... 55
2. Optimization of scanning parameter... 57
3. Effect of image pre-processing procedure ... 59
4. Effect of scan rate ... 61
5. Effect of setpoint ratio ... 62
6. Repeatability of measurements ... 64
7. Dimensional changes of CAFs at variable humidity ... 67
E. Conclusions ... 69
F. References... 70
CHAPTER FOUR: AFM OBSERVATIONS LONGITUDINAL CONTRACTION AND ITS CONCURRENT DIMENSIONAL CHANGES OF CELLULOSE AGGREGATE FIBRILS DURING DESORPTION AND ADSORPTION ... 72
A. Summary ... 73
B. Introduction ... 74
C. Experimental ... 78
1. Preparation of cellulose aggregate fibrils (CAFs) ... 78
2. Apparatus and measurement ... 80
3. Preparation of CAFs sheet ... 80
4. Moisture change... 81
5. Dimensional measurement... 82
D. Results and discussion ... 83
1. Moisture content in the CAFs sheet as a function of time elapsed... 83
2. Experimental variations ... 84
3. Dimensional behaviors at desorption stage... 87
4. Dimensional behaviors at adsorption stage... 97
5. Possible explanations of the dimensional behaviors of the CAFs ... 98
E. Conclusions ... 103
F. References... 104
CHAPTER FIVE: DIMENSIONAL AND HYGRO-EXPANSIVE BEHAVIORS OF CELLULOSE AGGREGATE FIBRILS FROM KRAFT PULP-BASED FIBERS .... 108
A. Summary ... 109
B. Introduction ... 110
C. Experimental section ... 113
1. Pulp samples ... 113
2. Preparation of CAFs ... 114
4. Dimensional measurement by image processing... 115
D. Results and discussion ... 116
1. Cellulose aggregates fibrils (CAFs) as a cellulose model material ... 116
2. Initial dimensions of CAFs ... 118
3. Morphology of CAFs as function of RH ... 120
4. Dimensional changes of CAFs as function of RHs ... 124
5. Relationship between behaviors of each dimension as a function of RHs ... 130
6. Hygro-expansion behavior of each CAFs sample ... 132
E. Conclusions ... 134
F. References... 134
CHAPTER SIX: HYGRO-EXPANSIVE PROPERTIES OF ENZYME DEGRADED CELLULOSE AGGREGATE FIBRILS ... 139
A. Summary ... 140
B. Introduction ... 140
C. Experimental section ... 142
1. Preparation of cellulose aggregate fibrils (CAFs) ... 142
2. Enzymatic treatment of the CAFs... 143
3. Preparation of sample glass slide... 143
4. Experimental set-up ... 144
5. Dimensional measurement by image processing... 145
D. Results and discussion ... 146
1. Mass reductions and the morphology of CAFs... 146
2. Initial dimensions of isolated CAFs... 148
3. Morphology of isolated CAFs as function of RHs ... 149
4. Dimensional changes of isolated CAFs as function of RHs... 161
E. Conclusions ... 168
F. References... 168
CHAPTER SEVEN: RHEOLOGY OF CARBOXYMETHYL CELLULOSE SOLUTIONS TREATED WITH CELLULASES ... 171
A. Summary ... 172
B. Introduction ... 172
C. Experimental ... 176
1. Materials ... 176
2. Methods... 177
a) Preparation of CMC solutions ... 177
b) Enzymatic hydrolysis and its viscosity measurement ... 178
c) Reducing sugar measurement ... 178
D. Results and discussion ... 178
2. Effect of cationic polymer ... 180
3. Effect of CMCs with different DS ... 182
4. Changes of intrinsic viscosity ... 183
5. Effect of Shear rate on viscosity ... 189
E. Conclusions ... 189
F. References... 190
CHAPTER EIGHT: FUTURE ASPECTS ... 194
A. Multiple humidity schedule systems with different sequences... 195
B. Cyclic pre-conditions with CAFs... 199
C. Nanocrystals from acid hydrolysis and enzymatic hydrolysis ... 199
D. Cast microfibril film as a model cellulose surface... 200
E. References ... 201
CHAPTER NINE: APPENDIX ... 202
A. Appendix 1... 203
B. Appendix 2 ... 205
C. Appendix 3 ... 206
LIST OF FIGURES
Figure 1.1 Amplitude-wavelength plot of the working range of 3-D surface
measurement instruments... 5
Figure 1.2 Schematic representation of the principle of atomic force microscopy... 7
Figure 1.3 Schematic description of the tip-sample interaction... 8
Figure 1.4 Artifacts caused by AFM tip and cone angle. E is artificial enlargement, R is tip radius, W is the real sample width, H is the real sample height, and A is cone angle. ... 11
Figure 1.5 Chemical structure of cellulose... 13
Figure 1.6 Schematic illustration of a typical softwood fiber. ... 15
Figure 1.7 Schematic illustration of a cross-section of S2 layer in spruce wood (left)
and its corresponding chemical pulp (right). ... 16
Figure 1.8 Symmetry and directions of hydrogen bonding in cellulose. (a) Cellulose Iα, (b) Cellulose Iβ. ... 17
Figure 1.9 Schematic descriptions of several theories of component structures in fibers. ... 18
Figure 1.10 Developing a two-phase structure in cell wall with processing variables. .. 19
Figure 1.12 A model demonstrating the action mode of two different types of cellulase. ... 25
Figure 3.1 Diagram of the equipment used to control the humidity within the AFM test chamber. Each of saturated potassium acetate solution and saturated
potassium sulfate gives ca. 28 % and 80 % RHs, respectively, in the AFM chamber for 1 hour after pumping. This setup allowed for the imaging of samples over a wide range of relative humidity from ca. 28 % to ca. 80 %. ... ….49
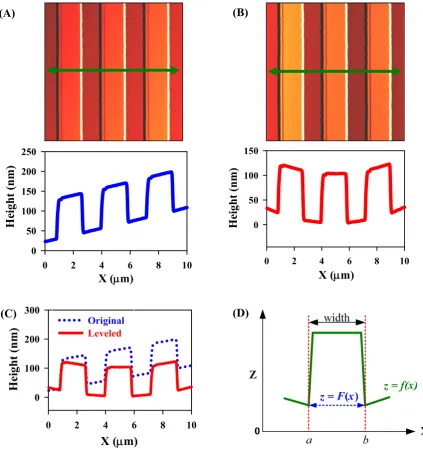
Figure 3.2 AFM images and associated line scans of TGZ 02 grating. (A) Original image (top) and a line profile (bottom) ; (B) The same image after parabolic baseline correction (top) and a line profile (bottom); (C) Line profiles of original and leveled images from A and B; (D) Geometry definition in a line profile. The arrow in (A) and (B) indicates a line segment out of 400 line segment at each image. ... 53
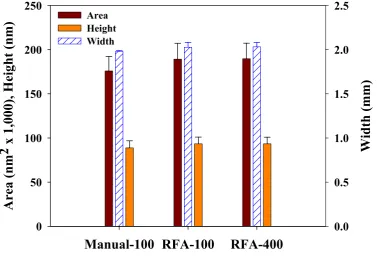
Figure 3.3 Comparison between the manual point-to-point and computational algorithm for the analysis of images of the TGZ 02 standard grating (102 nm in
nominal height). ... 56
Figure 3.4 Line profiles of standard gratings with different nominal step heights after leveling (A) TGZ 01 with 20 μm × 20 μm scanned area; (B) TGZ 01 with 4 μm × 4 μm; (C) TGZ 02 with 10 μm × 10 μm; (D) TGZ 03 with 10 μm × 10 μm. The dotted line indicates the original line profile and the solid line indicates the leveled line profile at each image. ... 58
Figure 3.5 Effect of different scan area sizes on the measured height of step gratings (TGZ 01, TGZ 02, and TGZ 03). The insert re-plots the result of TGZ 01 with 4 µm × 4 µm scan size. ... 60
Figure 3.6 Effect of scan rate on the measured dimensions of the 102 nm standard grating (TGZ 02) with 10 μm × 10 μm scan area. ... 61
Figure 3.7 Dimensions of the 102 nm standard grating (TGZ 02) with a fixed drive Amplitude (A0) of 0.187 V and three different setpoints (Asetpoint); (left) 0.15
Figure 3.8 Dimensions of the 102 nm standard grating (TGZ 02) with three different drive amplitudes; (left) 0.14 V, (middle) 0.187 V, (right) 0.3 V and 50 % dampening... 64
Figure 3.9 AFM image of a CAFs (top) and dimensional profiles (bottom) of each fresh engagement of the tip and sample with constant scanning parameter in 50 % RH, 23 ºC. The rectangular area in the AFM image was analyzed by the RFA algorithm... ... 65
Figure 3.10 Profile changes in width and height of 102 nm standard grating (TGZ 02) as a function of relative humidity... 66
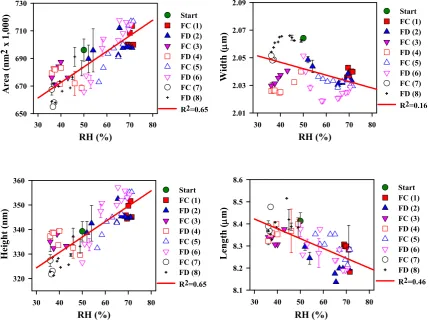
Figure 3.11 Four plots showing the change in dimensions of a CAFs from a bleached softwood pulp. The R2 values for the regressed lines are shown on each plot. It is worth noting that the length of the CAFs is found to reduce as humidity increases... 68
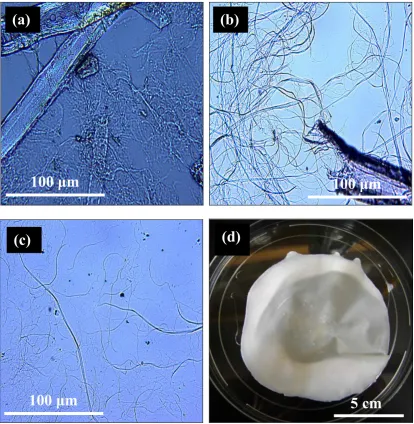
Figure 4.1 Optical microscopy images of each preparation step (a to c) and CAFs sheet (d). (a) Valley beater, (b) PFI milling filtercake, (c) PFI milling filtrate (CAFs), (d) CAFs sheet. ... 79
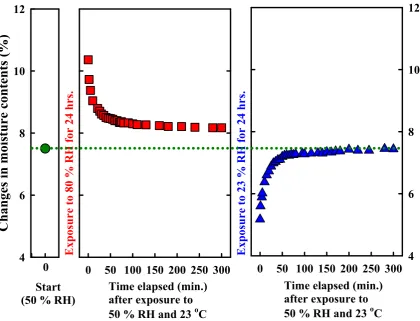
Figure 4.2 Sorption isotherms of CAFs sheet from kraft pulps as a function of time elapsed. The dotted-line in the figure shows moisture content (7.5 %) of the sheet at ambient condition of 50 % RH and 23 °C measured by TGA... 84
Figure 4.3 Tapping mode (TM)-AFM images of two different trials ((a) to (c) and (d) to (f)) of the reference grating (TGZ 02, 10 µm × 10 µm scan area) as a function of time elapsed under the ambient condition of 50 % RH and 23 °C for 24 hours. First trial (a) to (c), (a) 0 minute elapsed, (b) 30 minutes, (c) 1400 minutes; Second trial (d) to (f), (d) 0 minute, (e) 38 minutes, (f) 1320 minutes elapsed... 85
Figure 4.5 Tapping mode (TM)-AFM images of an area 10 µm × 10 µm of the CAFs
(Sample A) as a function of elapsed time under desorption stage. (a) before
the sample subjected to the 80 % RH, (b) 20 minutes elapsed after exposure to the ambient condition of 50 % RH and 23 °C, (c) 40 minutes, (d) 70 minutes, (e) 150 minutes, (f) 170 minutes, (g) 250 minutes, (h) 270 minutes, (i) 5 months elapsed (arrows indicate plastic deformations). ... 89
Figure 4.6 Tapping mode-AFM images of 80 µm × 80 µm area (a) and its an area of 10 µm × 10 µm (b to i) of the CAFs (Sample B) as a function of elapsed time
under desorption stage. (b) before the sample subjected to the 80 % RH, (c) 26 minutes elapsed after exposure to the ambient condition of 50 % RH and 23 °C, (d) 70 minutes, (e) 170 minutes, (f) 315 minutes, (g) 630 minutes, (h) 750 minutes, (i) 1450 minutes elapsed. ... 90
Figure 4.7 Tapping mode (TM)-AFM images of an area 10 µm × 10 µm of the CAFs
(Sample C) as a function of elapsed time under desorption stage. (a) before
the sample subjected to the 80 % RH, (b) 35 minutes elapsed after exposure to the ambient condition of 50 % RH and 23 °C, (c) 55 minutes , (d) 80 minutes, (e) 180 minutes, (f) 310 minutes, (g) 580 minutes, (h) 720 minutes, (i) 1400 minutes elapsed. ... 91
Figure 4.8 TM-AFM images of the same area 10 µm × 10 µm of the CAFs (Sample A)
after 5 months under adsorption stage. (a) before the sample subjected to the 23 % RH, (b) 20 minutes elapsed after exposure to the ambient condition of 50 % RH and 23 °C, (c) 40 minutes, (d) 60 minutes, (e) 140 minutes, (f) 160 minutes, (g) 240 minutes, (h) 580 minutes, (i) 600 minutes elapsed.... 92
Figure 4.9 TM-AFM images of the same area 10 µm × 10 µm of the CAFs (Sample B)
under adsorption stage. (a) before the sample subjected to the 23 % RH, (b) 30 minutes elapsed after exposure to the ambient condition of 50 % RH and 23 °C, (c) 50 minutes, (d) 65 minutes, (e) 180 minutes, (f) 260 minutes, (g) 350 minutes, (h) 740 minutes, (i) 1340 minutes elapsed.. ... 93
Figure 4.10 TM-AFM images of the same area 10 µm × 10 µm of the CAFs (Sample C)
Figure 4.11 Concurrent dimensional changes of CAFs exposed to 80 % RH for 24 hours, followed by returning to ambient condition of 50 % RH and 23 °C, and exposed to 23 % RH for 24 hours, followed by returning to ambient
condition of 50 % RH and 23 °C.. ... 95
Figure 5.1 Photomicrographs of intact SL50 fiber (a) and isolated CAFs (b to d) from different parent kraft fiber sources: (b) SL50, (c) SLO16, (d) NS. The solid arrow indicates dislocations in the fiber and the empty arrow indicates a small aspect ratio of CAFs... 117
Figure 5.2 AFM images of unbleached kraft pulp (SL50) as a function of RHs. (a-c) SL50-A, (d-f) SL50-B, and (g-i) SL50-C.. ... 121
Figure 5.3 AFM images of oxygen delignified kraft pulp (SLO16) as a function of RHs. (a-c) SLO16-A, (d-f) SLO16-B, and (g-i) SLO16-C... 122
Figure 5.4 AFM images of fully bleached kraft pulp (NS) as a function of RHs. (a-c) NS-A, (d-f) NS-B, and (g-i) NS-C... 123
Figure 5.5 Changes in measured length of each CAFs sample from different kraft-pulp sources (a to c) and their minimum, maximum, and mean values (d). (a) SL50, (b) SLO16, and (c) NS... ... 126
Figure 5.6 Changes in width of each CAFs sample from different kraft-pulp sources (a to c) and their minimum, maximum, and mean values (d). (a) SL50, (b) SLO16, and (c) NS... 127
Figure 5.7 Changes in cross-sectional area of each CAFs sample from different kraft-pulp sources (a to c) and their minimum, maximum, and mean values (d). (a) SL50, (b) SLO16, and (c) NS... 128
Figure 5.9 Hygro-expansion behavior of each CAFs as a function of RHs. (a) measured length, (b) width, (c) cross-sectional area, and (d) height. ... 133
Figure 6.1 Mass reductions of enzyme treated CAFs as a function of incubation times: 0, 1, 2, 4, 8, 16, and 32 hrs. The enzyme dosage was 0.01g/g dry weight CAFs ... 146
Figure 6.2 Optical micrographs of the isolated CAFs after enzymatic treatment as a function of incubation time: (a) reference (0 hr), (b) 1 hr, (c) 2 hrs, (d) 4 hrs, (e) 8 hrs, (f) 16 hrs, (g) 32 hrs... 147
Figure 6.3 AFM images of reference CAFs (0 hour) during adsorption (a to e) and desorption (f to i) stages... 151
Figure 6.4 AFM images of enzymatic treatment for 1 hour (1hr-A sample) during adsorption (a to e) and desorption (f to i) stages... 152
Figure 6.5 AFM images of enzymatic treatment for 1 hour (1hr-B sample) during adsorption (a to d) and desorption (e to i) stages... 153
Figure 6.6 AFM images of enzymatic treatment for 1 horr (1hr-C sample) during adsorption (a to d) and desorption (e to i) stages... 154
Figure 6.7 AFM images of enzymatic treatment for 8 hours (8hrs-A sample) during adsorption (a to e) and desorption (f to i) stages... 155
Figure 6.8 AFM images of enzymatic treatment for 8 hours (8hrs-B sample) during adsorption (a to e) and desorption (f to i) stages... 156
Figure 6.9 AFM images of enzymatic treatment for 8 hours (8hrs-C sample) during adsorption (a to d) and desorption (e to i) stages... 157
Figure 6.11 AFM images of enzymatic treatment for 32 hours (32hrs-B sample) during adsorption (a to e) and desorption (f to i) stages... 159
Figure 6.12 AFM images of enzymatic treatment for 32 hours (32hrs-C sample) during adsorption (a to d) and desorption (e to i) stages... 160
Figure 6.13 Changes in measured length of CAFs at each incubation time. (a) 0 hour, (b) 1 hour, (c) 8 hours, (d) 32 hours. ... 162
Figure 6.14 Changes in width of CAFs at each incubation time. (a) 0 hour, (b) 1 hour, (c) 8 hours, (d) 32 hours... 163
Figure 6.15 Changes in cross-sectional area of CAFs at each incubation time. (a) 0 hour, (b) 1 hour, (c) 8 hours, (d) 32 hours... 164
Figure 6.16 Changes in height of CAFs at each incubation time. (a) 0 hour, (b) 1 hour, (c) 8 hours, (d) 32 hours... 165
Figure 6.17 Mean values of each dimensional change (top) and maximum and minimum values (bottom) during cyclic humidity changes of CAFs of each incubation time. (a) measured length, (b) width, (c) area, (d) height. ... 166
Figure 7.1 Changes in apparent viscosities (50 °C and 10 rpm) and reducing sugars of 7 M CMC (1.0 % conc.) treated with active and its heat-denatured cellulase as a function of time.. ... 180
Figure 7.2 Changes in apparent viscosity of 7 M CMC (1.4 % conc.) treated with the heat-denatured enzyme or C-PAM (0.1 % conc.) at 50 °C and 10 rpm as a function of time. The inserted plot represents the apparent viscosity of the CMC after 500 minute elapsed... ... 181
Figure 7.4 Intrinsic viscosity of CMC with active and heat-denatured cellulase at 50 °C and 10 rpm... ... 184
Figure 7.5 Apparent viscosity of different molecular weights of CMC (1% conc.) treated with active cellulase (top) and heat-denatured cellulase (bottom) at 50 °C and 10 rpm as a function of time.. ... 186
Figure 7.6 Adjusted viscosities of the different molecular weights of CMC (1 % conc.) as a function of time... 187
Figure 7.7 Effect of shear rates in the range of 1 to 32 rpm of 7 H CMC (1 % conc.) treated with active cellulase as a function of reaction time.. ... 188
Figure 8.1 Dimensional changes of CAFs from fully bleached softwood kraft pulp exposed to lower humidity and followed by high humidity.. ... 197
LIST OF TABLES
Table 5.1 Initial dimensions of each CAFs and its experimental conditions... 119
LIST OF ABBREVIATIONS AND SYMBOLS
A0 free amplitude
AFM atomic force microscopy Asp set-point amplitude
CAFs cellulose aggregate fibrils CBDs cellulose binding domains
CBHs cellobiohydrases
CD cross direction
CMC carboxymethyl cellulose
DS degrees of substitution dsp set-point distance
DP degrees of polymerization
EGs endoglucanases
[η] intrinsic viscosity ηrel relative viscosity
FC forced change
FD free decay
γsp set-point amplitude ratio
HEC hydroxyethly cellulose κ’’ Kraemer’s constant MCC microcrystalline cellulose
MD machine direction
NIST national institute of standards and technology NS fully bleached northern U.S. softwood pulp QCM-D quartz crystal microbalance with dissipation
RH relative humidity
RFA rapid feature analysis
SEM scanning electron microscopy SL50 unbleached softwood kraft pulp SLO15 oxygen bleached softwood kraft pulp STM scanning tunneling microscopy Tg glass transition temperature
CHAPTER ONE
A. Background
The interaction of the polymeric and crystalline structure of the fiber cell wall with surrounding environments is of high technological importance. For example, the functional properties of bio-based materials such as paper, micro- and nano-fiber composites often change significantly when they are exposed to environmental factors [1, 2]. The interaction underlies the functional properties of the final product from cellulosic fibers and controls the mechanical, dimensional, electrical, thermal, and optical properties, either directly or indirectly. Therefore, understanding the underlying mechanisms of these interactions is crucial for further developing efficient and economical processes for producing final from bio-based raw materials.
To improve the dimensional properties, paper mills have used mechanical means to control the ratio of the machine direction (MD) and cross direction (CD) orientation in paper web shrinkage. Edge shrinkage in the CD can be controlled to a limited extent by mechanical means, but the fibers themselves are the underlying cause for the shrinkage of the sheet [4-6].
Paper is a consolidation of fibers, which consist of partially crystalline and non-crystalline cellulose microfibrils arranged at a certain angle in a lamellar structure making up the cell wall. These fibers are typically harvested from wood, where the microfibrils are surrounded by a discontinuous amorphous matrix composed of lignin and hemicellulose. The fibers are typically liberated from the wood by a mechanical or chemical pulping process. The chemical pulping process primarily removes the lignin and hemicellulose, leaving a fiber consisting mostly of cellulose. These physicochemical characteristics of the fiber are significantly influenced by the morphology of the wood source and by the particular pulping, bleaching and papermaking processes the fiber is subjected to during papermaking.
Pulp fibers are hydro-plastic and hygro-expansive in nature, which make them highly responsive to the environment [5]. Therefore, individual fibers will also expand and contract with changes of moisture content, although the movement of the fibers in relation to one another will govern the net changes in the paper. Ultimately, the outer and inner physicochemical properties of the papermaking fiber play a crucial role in final paper properties.
essential part of understanding the hygro-expansive properties of the fiber, the paper, as well as micro- and nano-composites. Thus, the dimensional properties of the microfibril and its dynamic interaction with moisture are very important aspects of the fundamentals of dimensional stability.
In the following section, a review of the literature pertaining to high resolution microscopy and its principle and applications will be given. In addition, reviews of physicochemical properties of cellulose microfibrils at the molecular, supra-molecular, and morphological aspects will be presented. Finally, the utilization of cellulase hydrolysis in the pulp and paper science will be discussed. The following sections are intended to provide a way to evaluate dimensional changes of individual cellulose microfibrils and assist in a better understanding of the dimensional changes of individual cellulose microfibrils from variable sources.
B. High resolution microscopy techniques
Figure 1.1 Amplitude-wavelength plot of the working range of 3-D surface measurement instruments [9].
In addition, the techniques mentioned above have specific vertical and horizontal measurement ranges for which they are suitable. Figure 1.1 shows the working range of 3-D topography measurement techniques based on amplitude-wavelength space (AW space) [10].
This level of vertical resolution is of interest in this study. Thus, the advantages and disadvantages of AFM and STM will be discussed.
The STM, invented in 1982, provided unique opportunities for obtaining three-dimensional images of surfaces with atomic resolution [11, 12]. STM requires a voltage to be applied to the surface and the scanning tip to create a tunneling current. This creates one of the main limitations of the STM, which is that it only works for conducting or semiconducting surfaces. The magnitude of this tunneling current is an exponential function of the tip-sample distance, and it is this strong distance dependence which is utilized for topographic imaging. The limitation of application to conducting materials was overcome by Binning, Quate and Geber, who developed the AFM with a novel force sensing technique which could be used regardless of material composition [13]. Compared to STM and SEM, the advantage of AFM as an imaging tool is that samples can be imaged under ambient conditions without severe loss in resolution and that no surface coating is needed. However, perhaps the greatest advantage is that AFM can be used to measure more than surface topography. At the same time as a topography image is being recorded, information about local properties such as surface chemistry, stiffness, friction, and magnetic properties can be obtained [14].
1. Fundamental principles of AFM
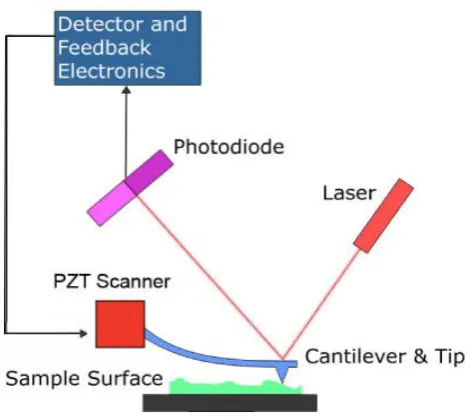
Figure 1.2 Schematic representation of the principle of atomic force microscopy.
scanner and photodiode are linked via a computer, employing various feedback options to display the deflection as a function of position at the sample surface, as shown in Figure 1.2.
When the AFM is configured for imaging in the contact mode, the repulsive force between the sample surface and tip is kept constant by the feedback loop, and the piezoelectric scanner adjusts the separation distance. Hence, the topographic information corresponding to a height image in contact mode is deduced by measuring the cantilever deflection during scanning. However, the tip can exert considerable force on the sample surface, thereby causing sample deformation. Thus, the height images may not represent the true topographic information of the sample surface.
Figure 1.3 Schematic description of the tip-sample interaction (modified from [17]).
(a) The cantilever is away from the surface and oscillates freely with an amplitude of A0.
(b) The tip just touches the surface at the lowest point of its oscillation. A0 is equivalent
to the real amplitude of the cantilever Asp, since there is no indentation into the
surface. Asp also is equal to the tip-surface distance and the setpoint distance, dsp.
(c) The sample is brought into contact with the tip, and Asp becomes smaller than A0,
because of damping of the tip induced by indentation into the sample. Asp is equal to
In order to overcome possible sample deformation, tapping mode AFM was introduced [15]. In this method the cantilever where the tip is mounted is vertically oscillated above the sample surface near its resonance frequency as shown in Figure 1.3a. The free amplitude A0 is the oscillation amplitude of the cantilever when there is no
interaction with the surface of the sample. The amplitude oscillation of the cantilever is monitored by the laser photodetector, and it is the signal which is used in the Z feedback control circuitry.
When the probe is lowered down to a surface, the amplitude oscillation of the cantilever is dampened due to the tip-sample interaction. The feedback control loop of the system then maintains this new amplitude constant as the oscillating tip scans the surface. The feedback control loop of tapping mode AFM is controlled by the set-point amplitude ratio γsp = Asp/A0, where A0 is the amplitude of the free oscillation and Asp is the set-point
amplitude such that during scanning the observed amplitude of oscillation is maintained at Asp by adjusting the vertical position of the sample. In other words, setpoint control is
For imaging the true topography of a sample surface by tapping mode AFM, the tapping force, which is defined as the degree to which the energy of the tip will be dissipated into the sample surface during scanning, should be considered [17]. When the setpoint ratio (γsp) equals the ratio of setpoint amplitude (Asp) and its free oscillation (A0), it has been
called “soft tapping” which does not apply tapping force onto the sample surface, so that there is negligible indentation of the tip on the surface, as illustrated in Figure 1.3b. However, when the setpoint ratio is less than the unity, called “hard tapping”, a significant indentation will be introduced into the resulting image, as shown in Figure 1.3c. The indentation depth depends on the energy of the tip coming into contact with the surface. In order to reduce the force applied to the sample, leading to a plastic deformation of the sample surface, the setpoint ratio should be close to unity and its free oscillation should be as low as possible. It was found that changing setpoint ratio [18] or changing free oscillation while keeping the setpoint ratio constant [19] results in significant differences in the resulting images.
The effects of setpoint ratio and free oscillation are not fully investigated in the AFM imaging technique. Thus, the tip-sample interaction based on the tapping force applied to the sample surface during imaging should be systematically investigated in order to get “true” topographical images from a sample surface.
2. Tip geometry and step height
tip geometry effect has been developed [21, 22]. The artificial enlargement of width and height in real samples depends on the AFM tip radius and cone angle as shown in Figure 1.4.
Figure 1.4 Artifacts caused by AFM tip and cone angle. E is artificial enlargement, R is tip
radius, W is the real sample width, H is the real sample height, and A is cone angle [22].
Several researchers have investigated the AFM as a metrology instrument, which can be used to measure the width and height of a sample in terms of two-point algorithm and histogram techniques [23]. In addition, algorithms for the calculation of profiling information on the model materials were developed and prototype programs using BASIC and MATLAB software were developed [24, 25].
3. AFM applications in characterization research
and natural polymers materials [27, 28] at the nanometer scale in many different native environments.
Although AFM techniques have been applied to investigate the surface characterization of wood, fiber, pulp and paper [29-31], the application of AFM for elucidating characterization of the structure-property relationships of cellulosic materials is still at an early stage [32]. AFM application to study the dynamic changes of macromolecules in situ and in real-time, however, is still a challenge due to several limiting factors, such as lateral resolution, tip-and-sample interaction, and variable scanning parameters [33].
Nevertheless, AFM imaging at a nano-meter scale, where a variable environment induced changes of the macromolecular structure and its morphology, can be used for the characterization of behaviors of macromolecular dynamics [33]. In addition, it has become increasingly evident that this technique can provide answers in quantitative terms to several questions about the structure and functional properties of cellulosic materials [34-36].
C. Ultrastructure in cell wall
1. Wood polymers
β-D-(1-4)-glucopyranose units in a variety of arrangements [38]. The anhydroglucose unit
C6H10O5 is in the form of a six-sided ring consisting of five carbon atoms and one oxygen
atom. The basic chemical structure of cellulose is presented in Figure 1.5. The degree of polymerization (DP) of wood cellulose is around 10,000 [39]. The hydroxyl groups of cellulose form intra- and inter-molecular hydrogen bonds. The intra- and inter- molecular hydrogen bonds hinder the free rotation of the rings on their linking glucosidic bonds resulting in the stiffening of the chain. Without destroying the intermolecular bonds, the hydrogen bonds also contribute to the insolubility of the cellulose chains in solvents. However, cellulose is a hydrophilic polymer with mainly three hydroxyl groups per glucosidic unit available for water adsorption.
Figure 1.5 Chemical structure of cellulose
hemicelluloses result in hydrophilic behavior. The average degree of polymerization of hemicelluloses in softwood and hardwood is approximately 100 and 200, respectively [39].
Lignin is a cross-linked aromatic polymer based on phenylpropane units; p-coumaryl alcohol, coniferyl alcohol, and sinaphyl alcohol. The proportions of these monomers are dependent on the plant species. Softwood lignin is built up mainly of coniferyl alcohol, whereas hardwood lignin is a copolymer of sinapyl and coniferyl alcohol units. The lignin network is less hydrophilic than the polysaccharides in wood.
2. Organization in the cell wall
Wood fiber is composed of a heterogeneous mixture of lignin, hemicellulose, and cellulose arranged in a complex fibrillar structure. The average length of fiber in typical softwood is 3 mm and the width is 25 to 30 microns. When the fiber is collapsed, the thickness is 5-8 microns [40]. The wood cells are composed of different layers, which differ from one another with respect to their structure and chemical composition.
Figure 1.6 illustrates hierarchical structure of wood cells which are made of three
main layers; the middle lamella, the primary wall, and the secondary wall. There are three sub-layers in the secondary wall, a thin outer layer (S1), a thick middle layer (S2), and a thin
inner layer (S3) towards the lumen. The microfibril angle (MFA) in the S2 layer, defined as
the angular deviation of the microfibrils in the S2 layer relative to the longitudinal cell axis,
plays a crucial role in the mechanical properties of wood fiber since the S2 layer forms the
Figure 1.6 Schematic illustration of a typical softwood fiber [41].
3. Physicochemical properties of cellulose microfibrils
It has been shown in the literature [42-44] that the cellulose chains are biosynthesized and self-assembled into bundles of molecules, called elementary fibrils, microfibrils, and protofibrils which are the smallest morphological structure of the fiber. Various organization models of plant cell wall have been proposed and well reviewed [45].
Figure 1.7 shows a proposed lamellar model for ultra-structural arrangement of the
xylan seems to appear in combination with the lignin [47]. The cellulose microfibrils are aggregated with a portion of glucomannan, forming a larger structural unit called a cellulose fibril aggregate. The cellulose fibril aggregate is approximately 15 nm in diameter.
Figure 1.7 Schematic illustration of a cross-section of S2 layer in spruce wood (left) and its
corresponding chemical pulp (right) [36].
Away from the main controversy, the existence of two families of native cellulose was confirmed by the application of solid state NMR (13C CP/MAS) to a range of cellulose samples of different origins [48-50]. From a detailed analysis of the carbon atom couplings observed in the solid state NMR spectrum, Vanderhart and Atalla [51] established that native cellulose was a composite of two distinct crystalline forms called Iα and Iβ lattices. Figure
1.8 [52] shows two different crystal forms based on results from Nishiyama et al. [53, 54]. The chains in cellulose Iα are crystallographically identical but alternating glucose units in
characterized by two polysaccharide chains in a parallel arrangement resulting in a monoclinic unit cell. The lattice Iα is generally present in all algae and bacteria, and has a
triclinic unit cell structure. The Iα may be converted into the Iβ form by annealing the
cellulose chain in the solid state [55].
Figure 1.8 Symmetry and directions of hydrogen bonding in cellulose [52]. (a) Cellulose Iα,
(b) Cellulose Iβ.
Thus, the amorphous and crystalline regions separately exist in a semicrystalline polymer. A continuous microfibril structure called the fringed fibrillar model was proposed by Hearle [59]. In this model, the cellulose microfibril consists of crystalline fibrils of indefinite length helically wound in a matrix of amorphous cellulose.
Figure 1.9 Schematic descriptions of several theories of component structures in fibers [57].
origin [63]. Crystallinity of cellulose controls not only its physical properties, but also its accessibility to chemical modification, swelling, and adsorption behaviors.
Figure 1.10 Developing a two-phase structure in cell wall with processing variables [69].
combination of both types of pulping (semi-chemical). Figure 1.7 shows a schematic description of pulp fiber after chemical pulping. During chemical pulping, the lignin-hemicellulose matrix is gradually removed, leading to formation of pores in the cell wall structure [36, 37, 64] and an increase in crystallinity of cellulose microfibrils [65], as well as an enlargement of cellulose microfibrils due to low residual hemicellulose content [66, 67]. Thus, the properties of a wood fiber are interconnected with its chemical composition and macromolecular arrangement of each chemical component.
Figure 1.11 Possible shrinkage model of cellulose microfibril [71]. L represents the length of wood and d the fiber repeat distance, so that the macroscopic strain is (L1-L0)/L0 and the
lattice strain is (d1-d0)/d0. The dashed lines represent H-bondings in lateral direction (a)
Lattice strain corresponding to the macroscopic strain; (b) Microfibril buckling; (c) Reorganization of the metastable crystal.
“macropores” and were compared to a smaller class of intralamellar pores, the “micropores” [73]. The native fiber has a 0.02 cm3/g void volume in the fiber wall, but the void volume
will increase to around 0.6 cm3/g with kraft pulping at a yield of 47 % [73]. These changes in structure of the fiber wall have a great influence on the ability of the fibers to consolidate with each other during drying of the paper.
In addition to gaps in the fiber wall, pulp fibers have inherent defects influencing reactivity toward swelling or hydrolytic agents. The defects described as dislocations, slip planes, microcompressions, and nodes [74] exist in the internal structure of wood and pulp fibers. The deformations come from natural growth, wind stress on the tree, or they may be artificially induced by mechanical treatments in pulp and paper processing. Due to the less ordered or exposed cellulose in dislocations, these deformations are more readily attacked by chemical, mechanical, and enzymatic treatments. Although it makes fibers more flexible, it can affect paper properties including strength, degree of swelling, and rate of dissolution.
4. The relation between a single fiber and paper
The manufacturing and converting of paper and paperboard, in common with other cellulose-based composite materials, can be affected by dimensional behavior of paper and paperboard toward its surrounding environments [2]. Dimensional stability of paper and board, in turn, is important for many reasons. For example, the dimensions of printing and xerographic paper were significantly changed when moistened or dried [77]. Tensile loading occurs during the transport of a web in papermaking machines, and printing presses can stretch paper permanently. In offset printing, paper can expand from moisture pickup or be stretched when peeled off the printing blanket. Paper stored on pallets may develop wavy edges in high humidity and tight edges in low humidity, both of which can cause poor feeding in printing processes.
The mechanical behavior of paper is, in common with other cellulose-based composite materials, time and humidity-dependent [40]. The question is to what extent phenomena such as relaxation, creep, and hygro-expansion should be taken into account in an analysis of the behavior of paper during its end-use as well as its manufacture.
Cellulose microfibril material has been exploited for many decades and could be important for the coming decades as a source of biopolymer, due to its ubiquity and industrial potential. Although considerable research has focused on the elucidation of the structure-property relationships of cellulose microfibrils, the industrial application of cellulose constantly generates questions of a scientific nature for researchers.
D. Enzyme technology
It has been clearly established that cellulose and hemicellulose can be converted to soluble sugars by enzyme hydrolysis actions. These enzymes are called cellulases and hemicellulases. Simultaneous synergistic actions of several different enzymes are required to the complete hydrolysis of the heterogeneous cellulose as shown in Figure 1.12. Based on their biophysical action on cellulose, cellulases can be classified into endoglucanases (EGs), cellobiohydrases (CBHs), and β-glucosidases [81]. EGs preferentially hydrolyze the internal β-(1-4) linkages of amorphous cellulose in a random manner. CBHs hydrolyze crystalline
components and its heterogeneous substrate enhance our knowledge of biodegradation of cellulose as well as facilitate the usage of cellulose as a source of monomeric chemicals [82].
Figure 1.12 A model demonstrating the action mode of two different types of cellulase.
over-reaction time have a significant detrimental impact on the final products. For such reasons, enzymatic activities should be carefully determined.
Interactions of cellulases and cellulose not only facilitate physical contact between enzyme and substrate, but also play an important role in the efficiency of the enzymatic hydrolysis of crystalline cellulose [84, 85]. Therefore, an understanding of enzyme interactions with substrates is of great importance in processing wood and cellulosic fibers. The rate of enzymatic hydrolysis and its yield are dependent on the adsorption of enzyme onto the substrate surface, although the activity of the cellulase seems to be dependent on the physicochemical properties of the substrate [86, 87], the multi-components of the cellulases [88], and physical reaction parameters such as mass transfer [89] and temperature [87]. Various kinetic models have been used to explain the cellulose hydrolysis rate, which is based on the amount of adsorbed enzyme on the cellulose surface [90], the structural characteristics of the substrate including pore size distribution, crystallinity index, specific surface [91,92], and cellulase-cellulose adsorption [93-95].
theoretical approach or to even develop a kinetic model for pure cellulose due to the complex enzymatic actions of multi-component cellulases.
Monitoring reductions in viscosity of CMC solutions is considered to be the most accurate method for detecting the EGs action, which hydrolyzes internal bonds within in a polymer [101, 102]. However, the viscometric measurement of soluble cellulose derivatives using the manual viscometers for EGs activity is not commonly used, due to its laborious and discontinuous nature. For this reason, the colorimetric measurement of reducing sugars has been routinely used for measurement of EGs activity.
Various types of automated viscometers are now used to measure the rheological change in polymer solution. Viscosity is a fundamental rheological parameter in polymer solution, characterizing fluid resistance to flow. The viscosity of a polymer solution is related to the polymer concentration, the extent of polymer-solvent interaction, and the polymer structure such as size, shape, molecular flexibility, and configuration of the molecules. It is functionally related to the molecular weight under appropriate experimental conditions [103]. However, more fundamental studies of the rheological change in cellulase-polymer solutions should be investigated in order to monitor degradation patterns of polymers by enzyme hydrolysis.
such as mechanical, physical and/or chemical properties of the interface. Mixtures of proteins (enzymes) and polymers in aqueous dispersion are often accompanied by either segregative or associative phase separation [106]. Thus, physico-chemical parameters of proteins (enzymes) and substrates such as pH, ionic strength, charge density, concentration and its ratio should be considered. Moreover, processing variables such as temperature, shear rate and time also strongly influence the rheological behavior of the complexes. For example, changes in functional properties due to soluble complexes between a globular protein (BSA) and a polysaccharide (CMC) were reported [107, 108]. The protein was adsorbed onto the CMC coil segments in the dilute regime or entrapped in the cross-links of the entangled network in the semi-dilute region. After thermal treatment of the soluble complexes, a considerable change in the visco-elastic properties of the network was also observed [109].
E. References
[1]. DAMMSTRÖM, S., SALMÉN, L., GATENHOLM, P. “The Effect of Moisture on the Dynamic Mechanical Properties of Bacterial Cellulose/Glucuronoxylan Nanocomposites”, Polymer, 46(23):10364-10371, 2005.
[2]. SALMÉN, L. “Responses of Paper Properties to Changes in Moisture Content and Temperature”, in Products of Papermaking, edited by Baker, C. F., Transactions of the tenth fundamental research symposium held at oxford, Pira international, Leatherhead, Vol. 1, p 369-430, 1993.
[3]. NANRI, Y., UESAKA, T. “Dimensional Stability of Mechanical Pulps-Drying Shrinkage and Hygroexpansivity”, Tappi Journal, 76(6):62-66, 1993.
[4]. GALLAY, W. “Stability of Dimensions and Form of Paper 1”, Tappi Journal, 56(11): 54-63, 1973.
[5]. GALLAY, W. “Stability of Dimensions and Form of Paper 2”, Tappi Journal, 56(12): 90-95, 1973.
[6]. PHILLIPS, B.R., I'ANSON, S.J., HOOLE, S.M. “CD Shrinkage Profiles of Paper - Curve Fitting and Quantitative Analysis”, Appita Journal, 55(3):235-243, 2002.
[7]. KUK, Y., SILVERMAN, P.J. “Scanning Tunneling Microscope Instrumentation”,
Review of Scientific Instruments, 60(2): 165-180, 1989.
[8]. HANLEY, S.J., GRAY, D.G. “Atomic Force Microscopy”, in Surface Analysis of
Paper, edited by Conners, T.E., Banerjee, S., CRC Press, Boca Raton, FL., p 301-324,
1995.
[9]. STOUT, K.J., BLUNT, L. “Introduction to the Revised Reprint a Rationalisation for 3-D Surface Measurement”, in Development of Methods for the Characterisation of
Roughness in Three Dimensions, edited by Stout, K.J., Penton Press, London, p XXI
[10]. STEADMAN, M. “Basis for Comparing the Performance of Surface Measuring Machines”, Precision Engineering, 9(3):149-152, 1987.
[11]. BINNIG, G., ROHRER, H., GERBER, C., WEIBEL, E. “Tunneling Through a Controllable Vacuum Gap”, Applied Physics Letters, 40(2):178-180, 1982.
[12]. BINNIG, G., ROHRER, H. “Scanning Tunneling Microscopy”, Physica
B:Condensed Matter, 127(1-3):37-45, 1984.
[13]. BINNING, G., QUATE, C.F., GERBER, C. “Atomic Force Microscope”, Physical
Review Letters, 56(9):930-933, 1986.
[14]. LILLEHEI, P.T., BOTTOMLEY, L.A. “Scanning Probe Microscopy”, Analytical
Chemistry, 72(12):89-196, 2000.
[15]. ZHONG, Q., KJOLLER, D., ELINGS, V.B. “Fractured Polymer/Silica Fiber Surface Studied by Tapping Mode Atomic Force Microscopy”, Surface Science, 290:L668-L692, 1993.
[16]. BAR, G., THOMANN, Y., BRANDSCH, R., CANTOW, H.-J., WHANGBO, M.-H. “Factors Affecting the Height and Phase Images in Tapping Mode Atomic Force Microscopy: Study of Phase-Separated Polymer Blends of Poly(ethane-co-styrene) and Poly(2,6-dimethyl-1,4-phenylene oxide)”, Langmuir, 13(14):3807-3812, 1997.
[17]. MALLÉGOL, J., DUPONT, O., KEDDIE, J. “Obtaining and Interpreting Images of Waterborne Acrylic Pressure-Sensitive Adhesives by Tapping-Mode Atomic Force Microscopy”, Langmuir, 17:7022-7031, 2001.
[19]. BUZIN, A.I., GODOVSKY, Y.K., MAKAROVA, N.N., FANG, J., WANG, X., KNOBLER, C.M. “Stepwise Collapse of Monolayers of Cyclolinear Poly(organosiloxane)s at the Air/Water Interface: A Brewster-Angle Microscopy and Scanning Force Microscopy Study”, Journal of Physical Chemistry B, 103(51):11372-11381, 1999.
[20]. HANLEY, S.J., GIASSON, J., REVOL, J.-F, GRAY, D.G. “Atomic Force Microscopy of Cellulose Microfibrils: Comparison with Transmission Electron Microscopy”, Polymer, 33(21):4639-4642, 1992.
[21]. BUTT, H.-J., GUCKENBERGER, R., RABE, J.P. “Quantitative Scanning Tunneling Microscopy and Scanning Force Microscopy of Organic Materials”, Ultramicroscopy, 46(1-4):375-393, 1992.
[22]. KONDO, T. “Supermolecular Architecture of Wood Cell Wall Cellulose: Characterization Using Infrared Microspectroscopy and Liquid-Mode Atomic Force Microscopy”, in Advances in Lignocellulosics Characterization, edited by D.S. Argyropoulos, D.S., Tappi press, Atlanta, GA, p 337-356, 1999.
[23]. FU, J., TASI, V., KÖNING, R., DIXSON, R., VORBURGER, T. “Algorithms for Calculating Single-Atom Step Heights”, Nanotechnology, 10(4):428-433, 1999.
[24]. SUZUKI, M., AOYAMA, S., FUTATSUKI, T., KELLY, A.J., OSADA, T., NAKANO, A., SAKAKIBARA, Y., SUZUKI, Y., TAKAMI, H., TAKENOBU, T., YASUTAKE, M. “Standardized Procedure for Calibrating Height Scales in Atomic Force Microscopy on the Order of 1 nm”, Journal of Vacuum Science and
Technology: A, 14(3):1228-1232, 1996.
[25]. ZHAO, X., VORBURGER, T.V., FU, J., SONG, J., NGUYEN, C.V. “A Model for Step Height, Edge Slope and Linewidth Measurements Using AFM”, 2003
International Conference on Characterization and Metrology for ULSI technology,
American Institute of Physics, 683:400-408, 2003.
[26]. KUMAKI, J., HASHIMOTO, T. “Conformational Change in an Isolated Single Synthetic Polymer Chain on a Mica Surface Observed by Atomic Force Microscopy”,
[27]. HANSMA, H.G., REVENKO, I., KIM, K., LANEY, D.E. “Atomic Force Microscopy of Long and Short Double-Stranded, Single-Stranded and Triple-Stranded Nucleic Acids”, Nucleic Acids Research, 24(4):713-720, 1996.
[28]. SUDESH, K., GAN, Z., MATSUMOTO, K., DOI, Y. “Direct Observation of Polyhydroxyalkanoate Chains by Atomic Force Microscopy”, Ultramicroscopy, 91:157-164, 2002.
[29]. HANLEY, S.J., GRAY, D.G. “Atomic Force Microscopy Images of Black Spruce Wood Sections and Pulp Fibres”, Holzforschung, 48(1):29-34, 1994.
[30]. KOLJONEN, K., ÖSTERBERG, M., KLEEN, M., FUHRMANN, A., STENIUS, P. “Precipitation of Lignin and Extractives on Kraft Pulp: Effect on Surface Chemistry, Surface Morphology and Paper Strength”, Cellulose, 11(2):209-224, 2004.
[31]. SNELL, R., GROOM, L.H., RIALS, T.G. “Characterizing the Surface Roughness of Thermomechanical Pulp Fibers with Atomic Force Microscopy”, Holzforschung, 55(5):511-520, 2001.
[32]. HANLEY, S.J., REVEL, J.-F., GODBOUT, L., GRAY, D.G. “Atomic Force Microscopy and Transmission Electron Microscopy of Cellulose from Micrasterias
denticulate: Evidence for a Chiral Helical Microfibril Twist”, Cellulose, 4(3):209-220,
1997.
[33]. SHEIKO, S.S., MÖLLER, M. “Visualization of Macromolecules- A First Step to Manipulation and Controlled Response”, Chemical Reviews, 101(12):4099-4123, 2001.
[34]. GUHADOS, G., WAN, W., HUTTER, J.L. “Measurement of the Elastic Modulus of Single Bacterial Cellulose Fibers Using Atomic Force Microscopy”, Langmuir, 21:6642-6646, 2005.
[35]. FAHLÉN, J., SALMÉN, L. “Ultrastructural Changes in a Holocellulose Pulp Revealed by Enzymes, Thermoporosimetry and Atomic Force Microscopy”,
[36]. FAHLÉN, J., SALMÉN, L. “Pore and Matrix Distribution in the Fiber Wall Revealed by Atomic Force Microscopy and Image Analysis”, Biomacromolecules, 6(1):433-438, 2005.
[37]. STONE, J.E., SCALLAN, A.M. “The Effect of Component Removal upon the Porous Structure of the Cell Walls of Wood- II. Swelling in Water and the Fiber Saturation Point”, Tappi Journal, 50(10):496- 501, 1967.
[38]. BAIRD, M.S., O'SULLIVAN, A.C., BANKS, W.B. “A Native Cellulose Microfibril Model”, Cellulose, 5(2):89-111, 1998.
[39]. FENGEL D., WEGENER, G. Wood: Chemistry, Ultrastructure and Reactions, Walter de Gruyter & Co., Berlin, p 613, 1983.
[40]. HASLACH, JR.H.W. “The Moisture and Rate-Dependent Mechanical Properties of Paper: A Review”, Mechanics of time-dependent materials, 4:169-210, 2000.
[41]. KRETSCHMANN, D. “Velcro Mechanics in Wood”, Nature materials, 2:775-776, 2003.
[42]. BARBER, N.F., MEYLAN, B.A. “The Anisotropic Shrinkage of Wood: A Theoretical Model”, Holzforschung, 18(5):146-156, 1964.
[43]. KERR, A.J., GORING D.A.I. “The Ultrastructural Arrangement of the Wood Cell Wall”, Cellulose chemistry and technology, 9:536-573, 1975.
[44]. HEYN, A. “The Ultrastructure of Wood Pulp with Special Reference to the Elementary Fibril of Cellulose”, Tappi Journal, 60(11):159-161, 1977.
[46]. JAKOB, H.F., FENGEL, D., TSCHEGG, S.E., FRATZL, P. “The Elementary Cellulose Fibril in Picea abies: Comparison of Transmission Electron Microscopy, Small-Angle X-ray Scattering, and Wide-Angle X-ray Scattering Results”,
Macromolecules, 28:8782-8787, 1995.
[47]. SALMÉN, L., OLSSON, A.M. “Interaction Between Hemicelluloses, Lignin, and Cellulose: Structure-Property Relationships”, Journal of Pulp and Paper Science, 24(3):J99-J103, 1998.
[48]. ATALLA, R.H., VANDERHART, D.L. “Native Cellulose: A Composite of Two Distinct Crystalline Forms”, Science, 223:283-285, 1984.
[49]. WADA, M., SUGIYAMA, J., OKANO, T. “Native Celluloses on the Basis of Two Crystalline Phase (Iα/Iβ) System”, J. Appl. Polym. Sci., 49(8):1491-1496, 1993.
[50]. NEWMAN, R.H. “Crystalline Forms of Cellulose in Softwoods and Hardwoods”, J.
Wood Chem. Technol., 14(3):451-466, 1994.
[51]. VANDERHART, D.L., ATALLA, R.H. “Studies of Microstructure in Native Celluloses Using Solid-State 13C NMR”, Macromolecules, 17:1465-1472, 1984.
[52]. JARVIS, M. “Cellulose Stack Up”, Nature, 426(11):611-612, 2003.
[53]. NISHIYAMA, Y., SUGIYAMA, J., CHANZY, H., LANGAN, P. “Crystal Structure and Hydrogen Bonding System in Cellulose Iα from Synchrotron X-ray and Neutron
Fiber Diffraction”, Journal of American Chemical Society, 125:14300-14306, 2003.
[54]. NISHIYAMA, Y., LANGAN, P., CHANZY, H. “Crystal Structure and Hydrogen Bonding System in Cellulose Iβ from Synchrotron X-ray and Neutron Fiber
Diffraction”, Journal of American Chemical Society, 124:9074-9082, 2002.
[55]. BELTON, P.S., TANNER, S.F., CARTIER, N., CHANZY, H. “High Resolution Solid-State 13C Nuclear Magnetic Resonances Spectroscopy of Tunicin, an Animal
[56]. REBENFELD, L. “Morphological Foundations of Fibre Properties”, Journal of
Polymer Science: part C, 9:91-97, 1965.
[57]. HAMAD, W. Cellulosic Materials: fibers, networks and composites, Kluwer Academic publishers, Boston, p 22, 2002.
[58]. HERRMANN, K., GERNGROSS, O., ABITZ, W. “X-ray Studies of the Structure of Gelatin Micelles”, Zeitschrift für Physikalische Chemie, 10(Abt. B):371-394, 1930.
[59]. HEARLE, J.W.S. “The Fine Structure of Fibres and Crystalline Polymers I. Fringed Fibril Structure”, Journal of applied Polymer Science, 7(4):1175-1192, 1963.
[60]. ATALLA, R.H., VANDERHART, D.L. “The Role of Solid State 13C NMR Spectroscopy in Studies of the Nature of Native Celluloses”, Solid State Nuclear
Magnetic Resonance, 15(1):1-19, 1999.
[61]. HULT, E.-L., LARSSON, P.T., IVERSEN, T. “A Comparative CP/MAS 13C-NMR Study of the Supermolecular Structure of Polysaccharides in Sulphite and Kraft Pulps”, Holzforschung, 56(2): 179-184, 2002.
[62]. LARSSON, P.T., WICKHOLM, K., IVERSEN, T. “A CP/MAS 13C NMR
Investigation of Molecular Ordering in Celluloses”, Carbohydrate Research, 302:19-25, 1997.
[63]. SARKO, A., MUGGLI, R. “Packing Analysis of Carbohydrates and Polysaccharides- III. Valonia Cellulose and Cellulose II”, Macromolecules, 7:489-494, 1974.
[64]. ANDREASSON, B., FORSSTRÖM, J., WÅGBER, L. “The Porous Structure of Pulp Fibers with Different Yields and Its Influence on Paper Strength”, Cellulose, 10:111-123, 2003.
[66]. DUCHESNE, I., HULT, E.-L., MOLIN, U., DANIEL, G., IVERSEN, T., LENNHOLM, H. “The Influence of Hemicellulose on Fibril Aggregation of Kraft Pulp Fibers as Revealed by FE-SEM and CP/MAS 13C-NMR”,
Cellulose, 8:103-111,
2001.
[67]. DUCHESNE, I., TAKABE, K., DANIEL, G. “Ultrastructural Localisation of Glucomannan in Kraft Pulp Fibres”, Holzforschung, 57(1):62-68, 2003.
[68]. STÖCKMANN, V.E. “Effect of Pulping on Cellulose Structure; part I. A Hypothesis of Transformation of Fibrils”, Tappi journal, 54(12):2033-2037, 1971.
[69]. STÖCKMANN, V.E. “Developing a Hypothesis: Native Cellulose Elementary Fibrils are Formed with Metastable Structure”, Biopolymers, 11:251-270, 1972.
[70]. STÖCKMANN, V. E. “Effect of Pulping on Cellulose Structure; part II. Fibrils Contract Longitudinally”, Tappi journal, 54(12):2038-2045, 1971.
[71]. CLAIR, B., ALMÉRAS, T., YAMAMOTO, H., OKUYAMA, T., SUGIYAMA, J. “Mechanical Behavior of Cellulose Microfibrils in Tension Wood, in Relation with Maturation Stress Generation”, Biophysical Journal, 91:1128-1135, 2006.
[72]. NAKANO, T., SUGIYAMA, J., NORIMOTO, M. “Contractive Force and Transforming of Microfibril with Aqueous Sodium Hydroxide Solution for Wood”,
Holzforschung, 54:315-320, 2000.
[73]. STONE, J.E., SCALLAN, A.M. “Effect of Component Removal upon the Porous Structure of the Cell Walls of Wood. II. Swelling in Water and the Fiber Saturation Point”, Tappi journal, 50(10):496-501, 1967.
[74]. NYHOLM, K., ANDER, P., BARDAGE, S., DANIEL, G. “Dislocations in Pulp Fibres- Their Origin, Characteristics and Importance - A Review”, Nordic Pulp and
Paper Research Journal, 16(4):376-384, 2001.
[76]. TASHIRO, K., KOBAYASHI, M. “Theoretical Evaluation of Three-Dimensional Elastic Constants of Native and Regenerated Celluloses: Role of Hydrogen Bonds”,
Polymers, 32(8):1516-1523, 1991.
[77]. ELLS, J. “Quality Paper and Digital Printer Performance”, British Printer, 109(7):25-26(28), 1996.
[78]. TAKAMURA, N. “Softening of Fibre Components in Hot Pressing of Fibre Mat”,
Journal of Japan Wood Research Society, 14(4):75-78, 1968.
[79]. VALENTINE, L. “Studies of the Sorption of Moisture by Polymers I. Effect of Crystallinity” Journal of Polymer Science, 27:313-316, 1958.
[80]. ALAVA, M., NISKANEN, K. “The Physics of Paper”, Reports on Progress in
Physics, 69:669-723, 2006.
[81]. BEGIUN, P., AUBERT, J.-P. “The Biological Degradation of Cellulose”, FEMS
Microbiology Reviews, 13:25-58, 1994.
[82]. BOISSET, C., ARMAND, S., DROUILLARD, S., CHANZY, H., DRIGUEZ, H., HENRISSAT, B. “Structure-Function Relationships in Cellulases: The Enzymatic Degradation of Insoluble Cellulose”, in Carbohydrases from Trichoderma reesei and
Other Microorganisms: Structures, Biochemistry, Genetics and Applications, edited
by Claeyssens, M., Nerinckx, W., Piens, K., Royal Society of Chemistry, Cambridge, p 124-132, 1998.
[83]. BHAT, M.K. “Cellulases and Related Enzymes in Biotechnology”, Biotechnology
Advances, 18:355-383, 2000.
[84]. TOMME, P., TILBEURGH, H.V., PETTERSSON, G., DAMME, J.V., VANDEKERCKHOVE, J. KNOWLES, J., TEERI, T., CLAEYSSENS, M. “Studies of the Cellulolytic system of Trichoderma reesei QM 9414. Analysis of Domain Function in Two Cellobiohydrolases by Limited Proteolysis”, European Journal of
[85]. GERBER, P.J., JOYCE, T.W., HEITMANN, J.A., SIIKA-AHO, M., BUCHERT, J. “Adsorption of a Trichoderma reesei Endoglucanase and Cellobiohydrolase onto Bleached Kraft Fibers”, Cellulose, 4(4):255-268, 1997.
[86]. LEE, S.B., RYU, D.D.Y., MANDELS, M. “Effect of Physicochemical Properties of Cellulose on Adsorption and Rate of Hydrolysis”, Biotechnology and Bioengineering, 24:2137-2153, 1982.
[87]. OOSHIMA, H., SAKATA, M., HARONO, Y. “Adsorption of Cellulase from
Trichoderma viride on Cellulose”, Biotechnology and Bioengineering, 25:3103-3114,
1983.
[88]. KLYOSOV, A.A., MITKEVICH, O.V., SINITSYN, A.P. “Role of the Activity and Adsorption of Cellulases in the Efficiency of the Enzymatic Hydrolysis of Amorphous and Crystalline Cellulose”, Biochemistry, 25(3):540-542, 1986.
[89]. SAKATA, M., OOSHIMA, H., HARANO, Y. “Effect of Agitation on Enzymatic Saccharification of Cellulose”, Biotechnology Letters, 7:689-694, 1985.
[90]. GHOSE, T.K., BISARIA, V.S. “Studies on the Mechanism of Enzymatic Hydrolysis of Cellulosic Substances”, Biotechnology and Bioengineering, 21(1):131-146, 1979.
[91]. GRETHLEIN, H.E. “The Effect of Pore-Size Distribution on the Rate of Enzymatic-Hydrolysis of Cellulosic Substrates”, Bio/Technology, 3(2):155-160, 1985.
[92]. FAN, L.T., LEE, Y.-H., BEARDMORE, D.R. “Mechanism of the Enzymatic Hydrolysis of Cellulose: Effects of Major Structural Features of Cellulose on Enzymatic Hydrolysis”, Biotechnology and Bioengineering, 22(1):177-199, 1980.
[93]. STUART, J.Y., RISTROPH, D.L. “Analysis of Cellulose- Cellulase Adsorption Data: A Fundamental Approach”, Biotechology and Bioengineering, XXVII:1056-1059, 1985.
[95]. STEINER, W., SATTLER, W., ESTERBAUER, H. “Adsorption of Trichoderma
reesei Cellulase on Cellulose: Experimental Data and Their Analysis by Different
Equations”, Biotechnology and Bioengineering, 32(7):853-865, 1988.
[96]. CAMINAL, G., LOPEZ-SANTIN, J., SOLA, C. “Kinetic Modeling of the Enzymatic Hydrolysis of Pretreated Cellulose”, Biotechnology and Bioengineering, 27(9):1282-1290, 1985.
[97]. TANAKA, M., IKESAKA, M., MATSUNO, R., CONVERSE, A.O. “Effect of Pore Size in Substrate and Diffusion of Enzyme on Hydrolysis of Cellulosic Materials with Cellulases”, Biotechnology and Bioengineering, 32(5):698-706, 1988.
[98]. HOLTZAPPLE, M.T., CARAM, H.S., HUMPHREY, A.E. “Determining the Inhibition Constants in the HCH-1 Model of Cellulose Hydrolysis”, Biotechnology
and Bioengineering, 26(7):753-757, 1984.
[99]. LEE, Y.-H., FAN, L.T. “Kinetic Studies of Enzymatic Hydrolysis of Insoluble Cellulose: (II) Analysis of Extended Hydrolysis Times”, Biotechnology and
Bioengineering, 25(4):939-966, 1983.
[100]. WALD, S., WILKE, C.R., BLANCH, H.W. “Kinetics of the Enzymatic Hydrolysis of Cellulose”, Biotechnology and Bioengineering, 26(3):221-230, 1984.
[101]. ALMIN, K.E., ERIKSSON, K.E. “Enzymic Degradation of Polymers - I. Viscometric Method for the Determination of Enzymic Activity”, Biochimica et Biophysica Acta 139(2):238-247, 1967.
[102]. VLASENKO, E.Y., RYAN, A.I., SHOEMAKER, C.F., SHOEMAKER, S.P. “The Use of Capillary Viscometry, Reducing End-Group Analysis, and Size Exclusion Chromatography Combined with Multi-Angle Laser Light Scattering to Characterize Endo-1,4-β-D-Glucanases on Carboxymethylcellulose: A Comparative Evaluation of the Three Methods”, Enzyme and Microbial Technology, 23:350-359,1998.
[104]. BRITT, D.W., JOGIKALMATH, G., HLADY, V. “Protein Interactions with Monolayers at the Air-Water Interface”, in Biopolymers at Interfaces, edited by Malmsten, M., Marcel Dekker, New York, p 415-434. 2003.
[105]. HOOGENDAM, C.W., DE KEIZER, A., COHEN STUART, M.A.,
BIJSTERBOSCH, B.H., SMIT, J.A.M., VAN DIJK, J.A.P.P., VAN DER HORST, P.M., BATELANN, J.G. “Persistence Length of Carboxymethyl Cellulose as Evaluated from Size Exclusion Chromatography and Potentiometric Titrations”,
Macromolecules, 31:6297-6309, 1998.
[106]. DOUBLIER, J.-L., GARNIER, C., RENARD, D., SANCHEZ, C. “Protein-Polysaccharide Interactions”, Current Opinion in Colloid & Interface Science, 5:202-214, 2000.
[107]. TUINIER, R., DHONT, J.K.G., DE KRUIF, C.G. “Depletion-Induced Phase Separation of Aggregated Whey Protein Colloids by an Exocellular Polysaccharide”,
Langmuir, 16:1497-1507, 2000.
[108]. RENARD, D., BOUE, F., LEFEBVRE, J. “Protein-Polysaccharide Mixtures: Structure of the Systems and the Effect of Shear Studied by SANS”, Physica B, 234-236:289-291, 1997.
[109]. RENARD, D., BOUE, F., LEFEBVRE, J. “Solution and Gelation Properties of Protein-Polysaccharide Mixtures: Signature by Small Angle Neuron Scattering and Rheology”, in Gums and Stabilizers for the Food Industry 9, edited by Dickinson, E., Bergenstabl, B., Royal Society of Chemistry, Cambridge, p189-201, 1998.
[110]. LEHTIÖ, J., SUGIYAMA, J., GUSTAVSSON, M., FRANSSON, L., LINDER M., TERRI, T.T. “The Binding Specificity and Affinity Determinants of Family 1 and Family 3 Cellulose Binding Modules”, PNAS, 100(2):484-489, 2003.
[111]. LINDER, M., TEERI, T.T. “The Roles and Function of Cellulose-Binding Domains”,
CHAPTER TWO
As described in the Chapter One, the interaction between cellulose microfibrils and the surrounding environment is critical for functional properties of final products from bio-based materials. Despite its obvious significance, there is still not a thorough understanding of how a cellulose microfibril interacts with water molecules and of its concurrent dimensional changes. This may be due to the complicated behaviors of the heterogeneous fiber materials. In addition, the experimental techniques were cumbersome and difficult to interpret at the nano-scale. Only a limited number of studies have yet been made on dimensional changes of cellulosic material with water molecules.
Therefore, the main emphasis in this study has to establish working routines for the AFM as well as to develop an image analysis technique. Based on the developed novel technique, dynamic interaction of the concurrent dimensional changes occurring in individual cellulose microfibril with variable relative humidity will be clarified.
![Figure 1.1 Amplitude-wavelength plot of the working range of 3-D surface measurement instruments [9]](https://thumb-us.123doks.com/thumbv2/123dok_us/1235738.1156107/24.595.144.462.129.351/figure-amplitude-wavelength-working-range-surface-measurement-instruments.webp)
![Figure 1.6 Schematic illustration of a typical softwood fiber [41].](https://thumb-us.123doks.com/thumbv2/123dok_us/1235738.1156107/34.595.193.421.136.341/figure-schematic-illustration-typical-softwood-fiber.webp)
![Figure 1.10 Developing a two-phase structure in cell wall with processing variables [69]](https://thumb-us.123doks.com/thumbv2/123dok_us/1235738.1156107/38.595.121.495.214.509/figure-developing-phase-structure-cell-wall-processing-variables.webp)
![Figure 1.11 Possible shrinkage model of cellulose microfibril [71]. lattice strain is (Lattice strain corresponding to the macroscopic strain; (b) Microfibril buckling; (c) Reorganization of the metastable crystal](https://thumb-us.123doks.com/thumbv2/123dok_us/1235738.1156107/40.595.128.477.128.422/shrinkage-cellulose-microfibril-corresponding-macroscopic-microfibril-reorganization-metastable.webp)