ABSTRACT
GHARIS, LAURIE WILSON. A Compromise Programming Approach to Effectively Value and Integrate Forest Carbon Sequestration into Climate Change Policy. (Under the direction of Dr. Joseph Roise).
Connections between increasing levels of greenhouse gases and the current rise in the global average temperate have led to greater concerns in developing effective climate change policies. Forests and wood products have been identified as important mechanisms for carbon sequestration and storage. However, policies often do not include the harvested wood products or substitution. Without harvests, forests will reach a point of saturation and more energy intensive products will be utilized.
This dissertation focused on how compromise programming can be employed to simultaneously consider multiple objectives of economic value, forest sequestration, and carbon dioxide emission savings from product storage and substitution to develop the cost of managing a forest for carbon and to effectively integrate forests into climate change policy.
In chapter 1, the relevance of forests in climate change is described. Previously developed regional forest models and current environmental policy options are reviewed, and challenges with current models and policies are discussed. The chapter concludes with the objective of the dissertation.
these classes has an expected use (carbon storage) life. The compromise programming solution for the loblolly pine (Pinus taeda)example, employing the specified multiple-objective model (with uniform weights and other non-decision parameters such as discount rate, prices, costs, and site index (65)) was $128/acre ($316/hectare) less than if the forest landowner maximized solely for soil expectation value. The choice of a preferred solution, found using alternative sets of weights, is a value statement which is out of the realm of quantitative analysis and into the realm of politics. The methodology provides efficient solutions (Pareto optimality) for decision makers to choose between; it does not make political decisions.
In chapter 3, the two largest carbon dioxide emission sectors in the U.S. are
connected to a loblolly pine stand, utilizing the model and the specified objectives and non-decision parameters, through an integrated cap-and-trade and carbon tax policy. Under the policy, the government would agree to buy a certain number of timberland carbon offsets for the amount in foregone profits from managing for multiple objectives (rather than a single economic objective). If the timberland carbon offsets are not bought by the capped
A Compromise Programming Approach to Effectively Value and Integrate Forest Carbon Sequestration into Climate Change Policy
by
Laurie Wilson Gharis
A dissertation submitted to the Graduate Faculty of North Carolina State University
in partial fulfillment of the requirements for the Degree of
Doctor of Philosophy
Forestry and Environmental Resources Raleigh, North Carolina
2012
APPROVED BY:
_______________________________ ______________________________
Dr. Joseph Roise Dr. Frederick Cubbage
Committee Chair
________________________________ ________________________________
BIOGRAPHY
Laurie Gharis will graduate with her PhD in Forestry and Environmental Resources at North Carolina State University (NCSU) in Raleigh, North Carolina in May 2012. Her research focused on the development of an optimization model for loblolly pine that included economic value, forest carbon, and carbon dioxide emission savings from product storage and substitution. The optimization model was utilized to estimate a cost for growing trees for carbon as opposed to market value. The cost of carbon was integrated into an incentive policy developed by Ms. Gharis to reduce a nation’s carbon footprint.
Ms. Gharis was supported by a National Needs Fellowship which was co-sponsored by NCSU’s Department of Forestry and Environmental Resources (FER) and the U.S.
Department of Agriculture-Cooperative State Research Education Extension Service (USDA-CSREES). Ms. Gharis is a member of the Society for American Foresters. She was the student team leader for an Environmental Protection Agency (EPA) 2010 P3 Phase I grant. She presented at the 14th Symposium for Systems Analysis in Forest Resources in
Maitencillo, Chile, the 6th Annual Graduate Student Research Symposium in Raleigh, North Carolina, the Forestry and Environmental Resources Spring 2011 Seminar Series in Raleigh, North Carolina, the 7th Annual National Sustainable Design Expo in Washington, DC, and the 2012 Southern Forest Economics Workers meeting in Charlotte, North Carolina.
Ms. Gharis received her Master’s in Public Administration from NCSU in 2002 and
ACKNOWLEDGMENTS
This work would never have been possible without the support of my committee members: Joseph Roise, Frederick Cubbage, Peter Lohmander, James McCarter, and Asko Noormets. Your support and ideas were an integral part of my success in completing this program. I would like to offer an extra thank you to my committee chair: Joseph Roise. You enhanced my research and my academic background with new points of view, were always available for support, and gave me the opportunity to travel the world. My experience would not have been near as positive without you as my advisor.
I would like to thank God for giving me this opportunity to study a subject so dear to me and my family for being so supportive and encouraging (especially my mom, dad, sister, and brother-in-law). I want to give a special thank you to my husband who helped me even when he was stationed half way across the world and to my two beautiful children who encouraged me throughout the program with smiles and hugs.
TABLE OF CONTENTS
LIST OF TABLES ... viii
LIST OF FIGURES ...x
CHAPTER 1 WHY RESEARCH FORESTS AND CLIMATE CHANGE ...1
Climate Change ...1
Carbon in Forests ...2
Forest Carbon in the U.S. ...4
Forest Models ...7
What are the Studies’ Objectives ...7
What is the Price of Carbon ...7
How are Products Treated in the Model ...8
Findings of Reviewed Studies ...8
Environmental Policies ...11
Objective of Dissertation ...15
CHAPTER 2 A COMPROMISE PROGRAMMING MODEL FOR DEVELOPING THE COST OF MANAGING A FOREST FOR CARBON ...19
Preface ...19
Abstract ...19
Optimization Model ...25
Theoretical Framework ...26
Developing an Appropriate Growth and Yield Equation ...26
Establishing Monetary and Carbon Values ...29
Objectives ...34
Solution Approach ...36
Optimization Solver ...36
Compromise Programming ...36
Application Results and Discussion ...41
Conclusions ...46
Acknowledgements ...48
CHAPTER 3 DECISION ANALYSIS MODELS TO EFFECTIVELY INTEGRATE FORESTS INTO CLIMATE CHANGE POLICIES ...49
Preface ...49
Abstract ...49
Introduction ...50
Tenets of Successful Environmental Policies ...53
Rationale for Carbon Sequestration ...53
Environmental Policies and Markets ...55
Examples of Environmental Policies and Markets ...55
Difficulties in Developing Current Programs into Effective Climate Change Policy ...57
Multiple Objective Programming Policy Contribution ...59
The Model ...59
An Application ...60
Example ...65
Conclusion ...67
Acknowledgements ...68
CHAPTER 4 CONCLUDING REMARKS...69
REFERENCES ...73
APPENDIX ...83
Appendix A: SAS Coefficients for SI 55 ...84
Appendix B: SAS Coefficients for SI 65 ...86
LIST OF TABLES
Table 1 SAS Beta Coefficients for Yield Equations Developed with Hafley and Smith
Growth and Yield Model Simulations (SI 65) ...29
Table 2 Usage and Disposal of Products in Developed Models ...32
Table 3 Values Obtained from the Developed Model (SI 65) by Optimizing each Objective Separately ...38
Table 4 Management Regimes for each Benchmark Scenario (SI 65) ...38
Table 5 Difference between the Model (SI 65) Results for the Compromise Solution and Maximizing each Objective Separately ...42
Table 6 Compromise Solutions for Models with Different Site Indices ...45
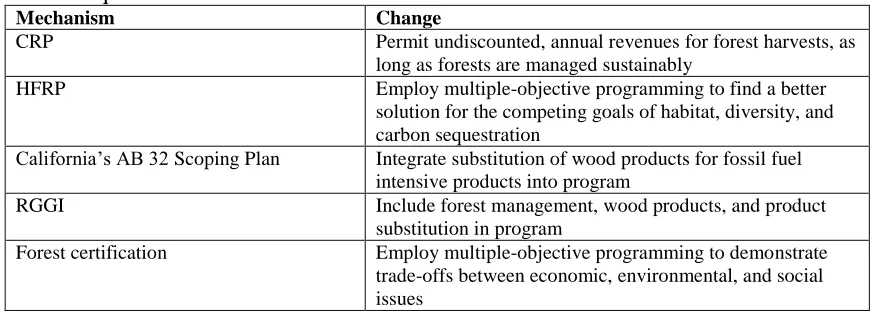
Table 7 Possible Examples of How Current Policies and Mechanisms Could Be Changed to Increase Carbon Sequestration ...58
Table 8 Final Felling Sawtimber Regression Coefficients for SI 55 ...84
Table 9 Final Felling CNS Regression Coefficients for SI 55...84
Table 10 Final Felling Pulp Regression Coefficients for SI 55 ...85
Table 11 Thin CNS Regression Coefficients for SI 55 ...85
Table 12 Thin Pulp Regression Coefficients for SI 55 ...85
Table 13 Final Felling Sawtimber Regression Coefficients for SI 65 ...86
Table 15 Final Felling Pulp Regression Coefficients for SI 65 ...87
Table 16 Thin CNS Regression Coefficients for SI 65 ...87
Table 17 Thin Pulp Regression Coefficients for SI 65 ...87
Table 18 Final Felling Sawtimber Regression Coefficients for SI 75 ...88
Table 19 Final Felling CNS Regression Coefficients for SI 75 ...88
Table 20 Final Felling Pulp Regression Coefficients for SI 75 ...88
Table 21 Thin CNS Regression Coefficients for SI 75 ...89
LIST OF FIGURES
Figure 1. Theoretical Framework. ...26
Figure 2. Developed Model Results for Planting Density ...39
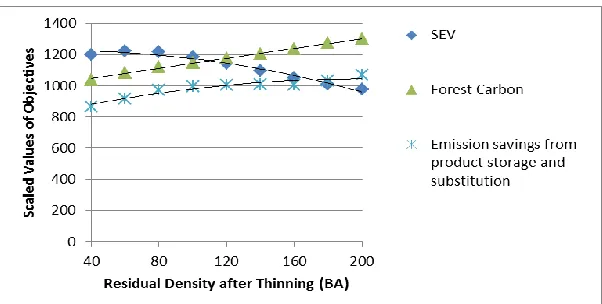
Figure 3. Developed Model Results for Residual Thinning Density ...39
Figure 4. Developed Model Results for Thinning Year ...40
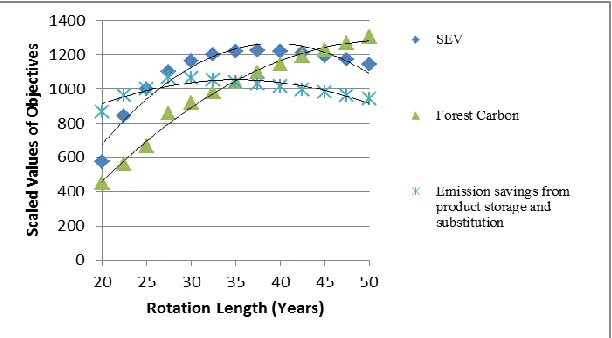
Figure 5. Developed Model Results for Rotation Length. ...40
Figure 6. The Effect of Discount Rate on the Cost of Multiple-Management for Carbon ...44
CHAPTER 1
Why Research Forests and Climate Change?
Heightened concerns of climate change due to increased levels of anthropogenic greenhouse gas concentrations (GHG) have caused a great need for effective and efficient climate change policies. Research has shown that the forest sector can efficiently reduce the levels of carbon dioxide in the atmosphere (van Kooten et al. 1995), and forests are known to provide socio-economical values to many communities in the form of goods, services, and revenue (IPCC 2007a). However, current climate change policies do not properly include forests. The lack of appropriate climate change policies could be due to the absence of forest models that can simultaneously view economic value, forest carbon storage, and product storage and
substitution. Without adequate models, policy makers cannot view tradeoffs among forest management objectives in order to develop policies. The focus of this dissertation is to create an appropriate, multiple-objective forest management model and to utilize the model to integrate forests into climate change policy. A suitable economic incentive aimed at increasing carbon sequestration by private landowners could be an efficient and effective avenue for mitigating climate change.
Climate Change
The United Nations Secretary-General recently noted that climate change posed a risk to peace and security around the world (UNFCCC 2011). The Intergovernmental Panel on Climate Change’s (IPCC) Fourth Assessment Report stated that there was a likely connection
significant. In 2005, the atmospheric concentration of carbon dioxide greatly surpassed the natural range over the last 650,000 years. Since the pre-industrial period, fossil fuel use has been the major cause of increased atmospheric levels of carbon dioxide (IPCC 2007b).
According to the IPCC, eleven of the twelve warmest years in the instrumental record of global surface temperature occurred during the time period of 1995-2006. Climate change is expected to cause environmental changes such as decreased snow cover, increased thaw depth, reductions in sea ice in the Arctic and Antarctic, more extreme tropical cyclones, increases in precipitation in high latitudes, and decreases in precipitations in subtropical regions (IPCC 2007b). GHG emissions can be decreased by increasing carbon sequestration in non-atmospheric pools such as forests and wood products, by decreasing energy usage, and by exchanging fossil fuels for lower GHG emitting, renewable fuels (IPCC 2011, Lippke et al. 2011).
Carbon in Forests
fuels for fossil fuels, and trading more energy-intensive products for wood products. In addition, these mitigation options can provide benefits such as employment and revenue sources, timber and fiber, and beauty and recreational services (IPCC 2007a).
Many factors can change the amount of carbon a forest stand can store. Species, stand age, and site quality affect the amount of carbon a tree can store (Huang and Kronrad 2006), and planting, site preparation, tree improvement, and fertilization can increase stand level carbon density. Longer forest rotations, fire management, augmentation of wood products that continue storing carbon, and substitution of wood products for fossil fuel intensive products can also increase carbon stocks. Different mitigation activities have unique time sequences, carbon benefits, and costs. Short term gains are largest for emission avoidance activities, whereas sustainable forest management targeted towards maintaining or increasing forest carbon stocks while still generating annual yields of timber, fiber, and/or energy from the forest, will produce the greatest sustained mitigation benefit (IPCC 2007a).
burned, less than five years to include recycling for different types of paper, or up to 100 years for sawtimber or panels in buildings (IPCC 2006).
Often wood products continue to store carbon after they are disposed. HWP taken to solid waste disposal sites (SWDS) may not degrade for many years. Due to the carbon storage potential of products in use and in the SWDS, the oxidation of HWP might not equal the amount of wood harvested for that specific year. Since the inputs and outputs of HWP are not normally equivalent and HWP can continue to hold carbon for some time, the IPCC has noted that wood product storage needs to be accounted for when giving guidelines for assessing the GHG impact of Agriculture, Forestry, and Land Use (IPCC 2006).
If the annual harvest is fixed at or below the annual forest increment, forest carbon stocks are sustained while society continues to receive a flow of fiber, timber, and energy (IPCC 2007a). Since less fossil fuel is required to manufacture wood products as opposed to non-wood products, biofuels are produced from the wood product chain, and carbon is sequestered in wood building materials, forests can provide carbon sinks and offsets. Positive substitution effects of emission savings from wood products and biofuels being substituted for non-wood products and fossil fuels continues throughout time. Unmanaged forests, however, can lead to carbon dioxide emissions, due to the forest and soil reaching equilibrium, more fossil fuel intensive products being utilized, and greater potential for unnatural wild fires or infestations (Eriksson et al. 2007, Lippke et al. 2011).
Forest Carbon in U.S.
(FAO 2011). In 2007, almost 66% (514 million acres or 208 hectares) of the nation’s forestland was categorized as timberland, and 69% of timberland was owned privately. Timberland is able to produce approximately 20 cubic feet or more per acre (1.4 cubic meters or more per hectare) of industrial wood annually and is able to be legally harvested for timber. 10% of the nation’s forests were set aside for non-timber uses such as parks and wilderness areas, and almost 24% were not reserved but were not capable of producing enough timber to be considered timberland. Although low productive forest land is not important for wood production, it provides significant environmental attributes to include watershed protection, wildlife habitat, domestic stock grazing, and forest products for local use (Smith et al. 2009). A policy aimed at increasing carbon sequestration on privately owned timberland will still maintain millions of acres in their normal status as parks, wilderness areas, and low productive forest lands capable of providing significant
environmental benefits, but it will also have the potential to make significant contributions to carbon sequestration on the 355 million acres (144 million hectares) of privately owned timberland.
Approximately eight percent of forested land in the U.S. is considered planted forests; the percentage of planted forests has continued to climb by 1.18% each year between 2000 and 2010 (FAO 2011). Trees most frequently planted in the U.S. in descending order are loblolly-shortleaf pine, longleaf-slash pine, Douglas fir, and white-red-jack pine (Smith et al. 2009).
generating sizable products. On the other hand, the Rocky Mountain region has the largest proportion of total growth turning to deadwood. Due to more of the gross growth harvested into wood products and energy feedstocks, intensively managed forests in the South have the fewest emissions related to natural mortality. Even though a large amount of wood products are taken from temperate forests, the forests maintain their status as carbon sinks
(Malmsheimer et al. 2011). However, too many overly mature forests, unnatural wildfires, and/or serious infestations could change this status.
Although consumption of wood products has been relatively stable, domestic timber production has decreased by nearly 3% since 1996. In the South, growing-stock removals were 5% less than 1996 levels. To make up the difference between consumption and production rates, imports were utilized (Smith et al. 2009). Reducing imports could provide extra carbon dioxide emission savings through decreased transportation emissions.
other hand, government sponsored forest incentives, such as tree planting programs have been considered beneficial at preventing losses of forestland (Smith et al. 2009).
Forest Models
In the past, numerous articles have been written about carbon sequestration in forests. Models have included different types of forests, products, and approaches. A review of regional models was conducted to learn more about authors’ objectives, prices of carbon, products included, and results found.
What are the studies’ objectives?
The main objectives in these studies were to optimize management practices for carbon sequestration and to maximize net present value with carbon subsidies in place. Hennigar et al. (2008), Kaipainen et al. (2004), Meng et al. (2003), and Peng et al. (2002) modeled how forest management practices affect carbon storage. Cao et al. (2010), Pohjola and Valsta (2007), Huang and Kronrad (2006), Backeus et al. (2005) and van Kooten et al. (1995) developed models for forest management when carbon subsidies and taxes were present. What is the price of carbon?
How are products treated in the model?
Pohjola and Valsta (2007) and Peng et al. (2002) did not consider product carbon. Huang and Kronrad (2006), Backeus et al. (2005), and Liski et al. (2001) included products in their models. Huang and Kronrad (2006) considered pulpwood and sawtimber produced from harvests as long-lived wood products, which would not be taxed. Backeus et al. (2005) discounted emission rates for sawn timber and pulpwood products, which gave an advantage to longer life products. Liski et al. (2001) analyzed organic carbon in vegetation, soil, and wood products. Hennigar et al. (2008) and Eriksson et al. (2007) included products and substitution in their models. Hennigar et al. (2008) optimized forest carbon, product carbon, and product substitution of wood products (not biofuels), whereas Eriksson et al. (2007) considered products and substitution in their simulation study.
Findings of Reviewed Studies
The reviewed articles all considered carbon sequestration in a stand. However, authors chose different objectives, accounted for forest carbon in varying ways, and restricted models uniquely. Some taxed and/or subsidized carbon, while others did not. Variances between studies led to unique results.
Schmid et al. (2006), Meng et al. (2003), and Peng et al. (2002) did not include product carbon in their models. Schmid et al. (2006) noted that although the managed systems take in less carbon over the simulated years, they may still have the ability to take in carbon after 100 years. Meng et al. (2003) found the optimized managed scenario
(2002) showed that increasing harvest intensity would reduce total ecosystem carbon, soil carbon storage, and nitrogen availability, whereas longer rotations increased levels of total ecosystem carbon stock and nitrogen availability.
Pohjola and Valsta (2007), Huang and Kronrad (2006), Backeus et al. (2005), and van Kooten et al. (1995) looked at carbon subsidies and taxes. In the Pohjola and Valsta (2007) study, average rotation lengths were increased by 9 years for Scots pine and17 years for Norway spruce with a carbon subsidy of $13/tonne of . Huang and Kronrad (2006) found that stands with site indices of 80 or 90 had a higher rate of mortality than growth at approximately 40 years, which prevented longer rotations from being profitable in terms of storing more carbon. Stands with lower site indices had lower mortality and could continue accumulating biomass (and thus storing carbon) with longer rotations. Their results also demonstrated that with low alternative rates of returns (ARR) (2.5-5%), as the price of carbon rose, the financially optimal rotation length for the production of both timber and carbon continued to be steady or to decline; however, with medium or high ARRs, an
decreased because tax penalties from harvests are smaller. Van Kooten et al. (1995) noted that the discount rate had the greatest effect in decreasing the rotation length.
Hennigar et al. (2008), Eriksson et al. (2007), Kaipainen et al. (2004), and Liski et al. (2001) included products in their models for managing forests for carbon. The Hennigar et al. (2008) study demonstrated that for many cases, carbon storage in product pools plus on-site forest carbon equaled forest carbon storage with reduced harvests. Eriksson et al. (2007) showed that the decreased input of carbon to the soil due to slash and stump removal was minor compared to the impact of using the slash and stumps to substitute for fossil fuel. Their simulations demonstrated that the largest reduction of net carbon emissions occurred when the forest was fertilized, slash and stumps were collected, wood was employed for construction, and the reference fossil fuel was coal. Their study also found that product use made the largest impact on net carbon emission. Kaipainen et al. (2004) noted that for all of the forests, the carbon stock of biomass had a positive relationship with rotation length. Increasing the rotation length of the studied forests, increased the harvesting possibilities in 3 forests and decreased the harvesting possibilities in 4 forests. Liski et al. (2001) concluded that increased rotation lengths of 30 years led to preferable carbon sequestration for Scots pine and Norway spruce due to fewer fossil fuel emissions from harvests.
fossil fuels). Products and product substitution are important for determining appropriate
management practices for maximum carbon sequestration over multiple-rotations, and
economic value is important for comparing tradeoffs in order to implement practical
policies.
Environmental Policies
A review of current and past policies is important in determining what policies currently exist, the scope of the policies, and the effectiveness of policies. A review such as this also better demonstrates the individuality of a policy that utilizes a production approach to
calculate a cost for managing for multiple objectives including carbon and to connect carbon
sequestration by forests to the two largest emission sectors through a combined
cap-and-trade and tax policy.
efficiencies in many different industries including agriculture. Enabling policies are those that facilitate production or consumption of a product by acting upon the production, distribution, or utilization chain of the product. This category is comprised of policies that encourage infrastructure development or seek to decrease the costs of input materials. Constraints are policies that set restrictions such as quality or environmental performance on product sourcing and/or production. Ancillary policies are those that are not directly aimed at the production or consumption of the product but can affect or are affected by those that are (Galik et al. 2009a).
Mandates such as the Clean Water Act and the Endangered Species acts have led to offset and mitigation credits to protect particular ecosystems and environmental resources. Offsets are normally employed to counteract emissions from a specific pollutant, whereas mitigation is normally utilized to counteract impact to an entire ecosystem. An example of an offset is one entity paying another entity for a certain reduction in water pollution in order to continue polluting into a specific water source. An example of mitigation is an industry paying an individual to develop a new wetland in order to impact another wetland by
The most recognized international climate change policy is the Kyoto Protocol. It is an international agreement connected to the UNFCCC, which obliges 37 industrialized countries and the European community to decrease GHG emissions to approximately five percent below 1990 levels during the 2008-2012 timeline. The Protocol places the majority of the burden on developed countries, since 150 years of industrial activity has caused GHG emissions to increase. The Kyoto Protocol offers incentive mechanisms for flexibility in meeting the mandates. The mechanisms are emissions trading through the carbon market, the clean development mechanism, and joint implementation (UNFCCC 2012).
Examples of the mandatory cap-and-trade systems are the European Union Emissions Trading Scheme, New South Wales Greenhouse Gas Reduction, New Zealand Emissions Trading Scheme, Regional Greenhouse Gas Initiative (RGGI), and California’s AB 32
Scoping Plan. Forests can be included in cap-and-trade programs as offsets. Forest offsets can include afforestation, reforestation, forest management, forest conservation, and forest preservation (Malmsheimer et al. 2011). Although carbon storage can be increased through wood products, the first commitment period in the Kyoto Protocol excluded wood products (UNFCCC 2003). If wood products are excluded, timber harvests are treated as an
immediate release of carbon dioxide into the atmosphere, but in actuality, a harvest moves a portion of the forest carbon to products (Woodbury 2007).
programs as payments for the services ecosystems provide to society, including carbon sequestration, biodiversity, watershed production, and scenic beauty. Environmental services
must be recognized and evaluated, and a payment scheme must be put into place to foster the
provision of the services. Landowners who manage their land to provide ecosystem services
are normally paid by private entities for services such as water and carbon sequestration and
by government entities for such services as biodiversity. According to Montagnini and
Finney, payments can be based on the economic cost of lost opportunities, the actual value of
environmental services provided minus transaction costs, or the global market price as in the
case of carbon sequestration. The payments can also be determined based on environmental
targets and the costs to landowners for desired land management. They also emphasized that
the net benefits of new systems must outweigh those of the conventional system in order for
sustainable land use systems to be permanently adopted by landowners. The largest payment
for environmental services program in the U.S. is the Conservation Reserve Program (USDA
FSA 2012).
An example of an enabling policy is a feed-in-tariffs (FITs) policy. This policy is employed to accelerate the development of renewable energy. FITS increase market growth by developers through long-term purchase agreements for electricity produced with
renewable energy sources. Payments can be set based on technology type, project size, resource quality, and/or project location. Technologies focused on employing waste such as wood or animal waste can be set higher. FIT payments are often based on the cost of
security, fixed price incentive, or auction-based mechanisms. Fixed price payments can be independent from the market and remain the same over time or can be dependent on the market with a premium added to the market electricity price (Couture et al. 2010).
There are also non-policy options for resource protection. Some current non-policy programs for climate change are voluntary emissions offset protocols such as the American Carbon Registry (ACR), Climate Action Reserve (CAR), GHG Protocol for Project
Accounting and Land Use, Land Use Change, and Forestry Guidance for GHG Project Accounting, and Voluntary Carbon Standard (VCS) (Malmsheimer et al. 2011). Another example of a non-policy option is forest certification. Forest certification can be an
instrument for environmental marketing, market access, and market advantage for the forest industry, landowners, and managers. Forest certification provides governments with a soft policy instrument to promote sustainable forest management and sustainable consumption patterns and environmentalists with an instrument to influence forest management
(Rametsteiner and Simula 2003). Objective of Dissertation
Although many policies and programs exist for forest carbon sequestration in the U.S., they lack large scale potential. For example, regional cap-and-trade programs differ in definitions for eligibility of offsets, carbon sequestration procedures, baselines, included carbon pools, crediting periods, leakage of carbon, and permanence of carbon offsets (Malmsheimer 2011). Another challenge is that the U.S. did not ratify the Kyoto Protocol and does not currently have a national climate change policy in place. Even the Kyoto Protocol has significant downfalls. For example, wood products were not included in the first commitment period (UNFCCC 2003), even though sustainable forest management targeted towards maintaining or increasing forest carbon stocks while still generating annual yields of timber, fiber, and/or energy from the forest, produces the greatest sustained
mitigation benefit (IPCC 2007a, Lippke et al. 2011).
The lack of economically appropriate policies for forests and climate change may be
The objective of this study is to develop an accurate and usable model to investigate optimal unit level management with the competing objectives of (1) maximizing economic value, (2) forest sequestration, and (3) carbon dioxide emission savings in product storage and substitution. The model will be employed to determine an example cost of managing timberland for carbon so that forests can be effectively integrated into climate change policy. These three objectives were chosen because objective one represents the business as usual (BAU) scenario, objective two represents policies that increase rotations and decrease
production (a possible, habitat and soil organic carbon friendly approach), and objective three represents a production approach that takes into account carbon storage in products and carbon offsets. The optimization model will include basic stand level management variables: planting density, thinning timing and density, and rotation length. An optimization model that is region specific, operationally minded, and includes economic value, forest carbon, and product carbon and substitution would provide an accurate and practical quantitative tool for policy makers and forest landowners.
Due to the amount and types of forest land, the U.S. and specifically the Southern U.S. show much promise to sequestering more carbon. Approximately 33% of the U.S. is forested (compared to 50% in the 1600’s), and the majority of forest land is classified as
CHAPTER 2
A Compromise Programming Model for Developing the Cost of Managing a Forest for Carbon
Preface
Chapter 2 is a manuscript in review, as of March 26, 2012, for the Annals of Operation
Research. The manuscript was written by Laurie Gharis, Joseph Roise, and James McCarter.
Dr. Roise’s contribution to the manuscript was the idea to employ optimization for forest
management of carbon and to integrate a growth and yield model into an optimization model. Dr. McCarter’s contribution to the manuscript was the idea of employing site indices to
simulate soil organic carbon; he also developed the computer program necessary to run simulations on the growth and yield model. Both Dr. Roise and Dr. McCarter also reviewed the article before submission. My contribution to the article was to cultivate a dissertation topic, to conduct all research, to develop all product equations utilizing statistical analysis software, to create an optimization model with multiple objectives, to decide on what objectives to include, to select a solving method, and to write the manuscript. Abstract
Environmental policy makers need research based decision analysis models that include carbon sequestration and forest products in order to make policies that are both economically viable and effective. Forests and wood products have been identified as important
that include product substitution. We develop a model to investigate optimal stand level management with competing objectives of maximizing soil expectation value, carbon storage in the forest, and carbon dioxide emission savings from product storage and substitution. Our purpose is to produce an accurate and useable analytical product for Southeastern U.S. foresters growing loblolly pine (Pinus taeda)in the presence of carbon policies. The decision variables are the traditional stand level management variables of planting density, thinning timing and density, and rotation length. Over time these variables influence the proportion of wood going into pulp, chip-n-saw, and sawtimber where each of these classes has an expected use (carbon storage) life. Compromise programming was employed to solve the problem. The compromise programming solution (SI 65) was $128 per acre ($316 per hectare) less than if the forest landowner maximized solely for soil expectation value under the specified multiple-objective model and non-decision parameters; this value was
approximately $24/tonne of equivalent. This practical knowledge can lead to
economically viable policies for foresters and effective carbon sequestration policies for the environment.
Keywords compromise programming; forest management; decision analysis model; policy; unit level analysis; product substitution
Introduction
The United Nations Secretary-General recently called climate change “a very credible threat to peace and security around the world” (UNFCCC 2011). The Intergovernmental Panel on Climate Change’s (IPCC) Fourth Assessment Report noted that the current rise in the global
concentrations. In 2010, GHG levels had increased to 39% above preindustrial levels. Since fossil fuel combustion causes the majority of global anthropogenic GHG emissions, energy conservation and efficiency, fossil fuel exchanges, and renewable energy are important avenues for decreasing GHG emissions (IPCC 2011).
With approximately 10 billion acres (4 billion hectares) of forestland holding 289 gigatonnes of carbon in just their biomass (FAO 2010), effectively tracking the carbon flow to and from forests is also imperative for effective climate change policies. Forest can aid in climate change mitigation through four different avenues: decreasing deforestation and degradation, increasing the sequestration rate in existing and new forests, displacing wood fuels for fossil fuels, and substituting wood products for more energy-intensive products. These options for mitigation may also provide additional benefits such as employment and revenue sources, timber and fiber, and beauty and recreational services. Planting, site preparation, and tree improvement are some of the variables that affect stand level carbon stock. Different mitigation activities have unique time sequences, carbon benefits, and costs. Short term gains are largest for emission avoidance activities, whereas sustainable forest management targeted towards maintaining or increasing forest carbon stocks while still generating annual yields of timber, fiber, and/or energy from the forest, will produce the greatest sustained mitigation benefit (IPCC 2007a).
et al. 2007). Meng et al. (2003) and Hennigar et al. (2008) optimized forest management practices such as: planting, thinning, and rotation length for carbon sequestration. Other authors have analyzed the economic value of the forest when a carbon tax or subsidy was administered (van Kooten et al. 1995, Backeus et al. 2005, Huang and Kronrad 2006, and Pohjola and Valsta 2007). Many different tree species and regions have been included in analyses. Models have encompassed soil (Meng et al. 2003, Hennigar et al. 2008) and products (Backeus et al. 2005, Hennigar et al. 2008, Eriksson et al. 2007, Liski et al. 2001, Huang and Kronrad 2006, Cao et al. 2010, Kaipainen et al. 2004, van Kooten et al. 1995, Woodbury et al. 2007). However, few models have accounted for product substitution. Hennigar et al. (2008) optimized for product substitution but did not include fossil fuel substitution, and Eriksson et al. (2007) included fossil fuel substitution but did not optimize. Many articles have covered carbon sequestration in forests, but a gap exists where
optimization models have simultaneously considered economic value, forest carbon
sequestration, and carbon dioxide emission savings from product storage and substitution of construction materials and fossil fuels. With climate change causing an emphasis on fossil fuel exchanges, forest biofuels should not be left out of the equation.
instruments to offset the cost of meeting the required emissions, and forest landowners who sequester carbon in their forests could assist the country in meeting its target (Pohjola and Valsta 2007). The actual cost of managing a stand for carbon sequestration is necessary for this type of policy to be effective. Proper subsidies could prevent forest conversions and could further the environmental services and sustainable products provided by forest landowners.
Optimization or simulation of specific scenarios can be employed for forest carbon sequestration analysis. Although when a specific goal exists for the analysis, an optimization approach permits the researcher to look at many more alternatives than a simulation approach (Backeus et al. 2005). Stand level management decisions such as planting density
objectives with different units of measurements can be optimized. In addition, compromise programming can also be employed without having predetermined weights; instead the decision maker’s risk attitude can be integrated into the compromise equation (Krcmer et al.
2005).
The objective of this study was to develop a model to investigate optimal stand level management with the three competing objectives of maximizing soil expectation value (SEV), carbon storage in the forest, and carbon dioxide emission savings from product storage and substitution of more fossil fuel intensive products by both biofuels and wood construction products. These three objectives were chosen because objective one represents the BAU scenario, objective two represents policies that increase rotations and decrease production (a possible, habitat and soil organic carbon friendly approach), and objective three represents a production approach that accounts for carbon storage in products and carbon offsets. The multiple-objective optimization model was solved utilizing compromise
programming, and the decision maker’s risk attitude was integrated. An optimization model
that is region specific, operationally minded, and includes economic value, forest carbon, and product carbon and substitution potentials on a scalable level provides a practical,
quantitative tool for policy makers considering climate change policies.
Texas, Virginia, Puerto Rico, and the Virgin Islands. The South provided 63% of U.S. growing stock removals in 2001. The majority of harvested volumes in the U.S. were produced by NIPF landowners (Smith et al. 2003). The loblolly pine tree is found in the majority of Southern U.S. plantations (FAO 2006) and is thus the tree of interest for this investigation. Demonstration of the model for the management of one acre of loblolly pine in the Southern U.S. will be beneficial in developing a scalable, economic incentive aimed at increasing carbon sequestration by private landowners.
Optimization Model
Theoretical Framework
Figure 1. Theoretical Framework. Drawing adapted from Hennigar et al. (2008). A forest stand is managed sustainably and optimally for SEV, carbon storage in the forest, and carbon dioxide emission savings through product storage and substitution of more fossil fuel
intensive products by biofuels and wood construction products. A certain percentage of sawtimber, chip-n-saw, and pulpwood is produced. Wood construction products and biofuels are manufactured and substituted for fossil fuel intensive products. Products are landfilled, recycled, or burned for energy after their useful lives. The percentages of products
transferred in each stage are shown above.
Developing an Appropriate Growth and Yield Equation
In the model not only is the forest stand managed for carbon sequestration on site but also for long term wood products and for substitution of more fossil fuel intensive products by
biofuels and wood construction products. To find the combination of stand management activities that maximizes the three objectives, an appropriate growth and yield equation is needed. The growth and yield equation must take into account the four decision variables.
For our investigation the Hafley and Smith North Carolina State University (NCSU)– Managed Pine Plantation Growth and Yield Simulator – Version 3.2 was integrated into the optimization model (Hafley et al. 1982, Hafley and Buford 1985). This stand level growth model was constructed employing long-term spacing studies and operational plantation data (Buford 1991). The model utilizes Johnson’s distribution to model diameter and height.
employs the following parameters: smallest height and diameter, largest height and diameter, the modal height and diameter, the standard deviation of height and diameter, and the correlation between height and diameter. A negative binomial probability function is employed to exhibit mortality (Buford and Hafley 1985). The model has been assessed and found acceptable over combinations of site indices of loblolly pine at 45 to 85 feet
(approximately 14 to 26 meters) at a base age of 25 years, ages 5 to 50 years, and densities of 100 to 2722 trees per acre (TPA) (247 to 6726 trees per hectare (TPH)) (Hafley et al. 1982). Buford compared the predictions of four growth and yield models (UGA, SE-27, COYIELD, and Hafley and Smith NCSU) to the actual results from a 30 year spacing study and found that overall the Hafley and Smith NCSU model provided the closest results over the range of planting densities in the study (Buford 1991).
run from 8 to 22 years at 1 year increments. Residual basal area (BA) left after the thinning treatment had to be a minimum of 40 square feet per acre (9.18 square meters per hectare) or no removal would occur. Ranges for thinning were considered for residual BA above 40 square foot per acre at 5 square foot increments (9.18 square meters per hectare at 1.15 square meter increments). Rotation lengths were included from 20 years to 50 years at 1 year increments. In addition, harvests (both thinnings and final fellings) had to be five years apart. This combination resulted in 2,630,003 simulations being run. Outputs analyzed were pulpwood, chip-n-saw (CNS), and sawtimber.
Data from the simulation model was input into SAS, and graphs of the growth and yield data were analyzed in order to develop predictive equations for the response surface. Relationships appeared to be quadratic or cubic between the management variables and the wood products for this dataset and timeline. With polynomial relationships, rather than sigmoidal relationships, and no comparisons between treatments, a regression procedure (PROC REG) could be utilized to provide unbiased estimates (Rawlings et al. 1998).
Stepwise selection was employed to develop appropriate equations for each product (thinned CNS, thinned pulpwood, final felling sawtimber, final felling CNS, and final felling
pulpwood) and each site index. No thinned sawtimber equations were developed, as thinnings rarely produced sawtimber during the specified thinning range. Sawtimber was measured in 1000 board feet (MBF), which is a commercial measure, and CNS and
probabilities from the statistical analyses can be seen in Appendices A (SI 55), B (SI 65), and C (SI 75).
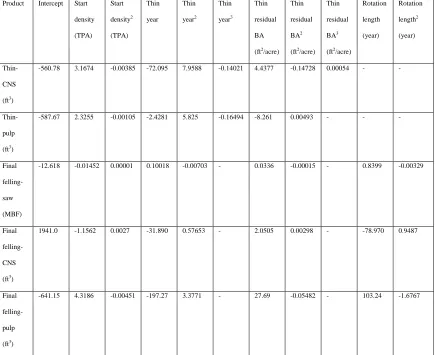
Table 1
SAS Beta Coefficients for Yield Equations Developed with Hafley and Smith Growth and Yield Model Simulations (SI 65)
Product Intercept Start
density (TPA) Start density2 (TPA) Thin year Thin year2 Thin year3 Thin residual BA
(ft2/acre) Thin
residual
BA2
(ft2/acre) Thin
residual
BA3
(ft2/acre)
Rotation length (year) Rotation length2 (year) Thin-CNS
(ft3)
-560.78 3.1674 -0.00385 -72.095 7.9588 -0.14021 4.4377 -0.14728 0.00054 - -
Thin-pulp
(ft3)
-587.67 2.3255 -0.00105 -2.4281 5.825 -0.16494 -8.261 0.00493 - - -
Final
felling-saw
(MBF)
-12.618 -0.01452 0.00001 0.10018 -0.00703 - 0.0336 -0.00015 - 0.8399 -0.00329
Final
felling-CNS
(ft3)
1941.0 -1.1562 0.0027 -31.890 0.57653 - 2.0505 0.00298 - -78.970 0.9487
Final
felling-pulp
(ft3)
-641.15 4.3186 -0.00451 -197.27 3.3771 - 27.69 -0.05482 - 103.24 -1.6767
Establishing Monetary and Carbon Values
assumed to repeat in perpetuity. The value is useful as an analyst can compare the present value of various management regimes with different rotation lengths (Cubbage et al. 1991).
The dry biomass of the bole of the loblolly pine was calculated by multiplying the green volume in cubic foot by the weight (pounds) of one cubic foot of water and by the dry weight specific gravity of the green volume of loblolly pine (Heath 2008). Forest carbon values were calculated utilizing the specific gravity of mature loblolly pine from the
piedmont region of North Carolina (Talbert and Jett 1981). The factors for aboveground and belowground biomass from the total amount of merchantable wood were utilized to obtain the total biomass per acre (GGLS8 2010). Biomass was converted to carbon by multiplying by 0.5 (Hennigar et al. 2008, Dwivedi et al. 2009). A comparison was made of the
optimization model’s prediction for carbon to Dwivedi et al. (2009). They estimated the
maximum carbon sequestration potential of 1 acre (0.4047 hectares) of slash pine (SI 70 at age 25), with 700 TPA (1730 TPH) at year two and a thinning conducted at year 15, as 40,065 kg/acre (99,000 kg/hectare). Our model estimated the maximum carbon sequestration potential of 1 acre (0.4047 hectares) of loblolly pine (SI 70 at age 25), with 700 TPA (1730 TPH) and a thinning conducted at year 15, as 42,845 kg/acre (105,869 kg/hectare). The final standing carbon is within 7% of Dwivedi et al.
Emissions from managing a pine plantation, transporting lumber to the mill, and producing softwood lumber were adapted from Puettmann and Wilson (2005). The
To accurately integrate carbon storage potential for long term products into the optimization model, uses of long term products have to be known. Bergman and Bowe (2010) noted that most softwood lumber is used in residential construction, including new construction and repair and remodeling of existing buildings. As can be seen in Figure 1, we assumed that CNS and sawtimber would be utilized to make construction products. To obtain the dry biomass of products per acre, the specific gravity of a mature tree in the piedmont region of North Carolina (Talbert and Jett 1981) with the reference substance of water was multiplied by the amount of CNS and sawtimber per acre. Then a log mass conversion rate of 41% was applied (Milota et al. 2005). For this study, the other 59% went to fuel. To calculate the amount of carbon in products, a conversion rate of .50 was utilized (Hennigar et al. 2008, Dwivedi et al. 2009). For paper products, the model considered that 80% of pulpwood went to chips (Hennigar et al. 2008), and 45% of chips were converted to paper (Briggs 1994). Leftover pulpwood went to fuel.
Table 2
Usage and Disposal of Products in Developed Models
Starting product Finished product Percentage of finished product made from starting product Finished product half-life (years) Percentage landfilled Percentage burned for energy Percentage recycled Landfill decay half-life (years) Percentage of landfilled product subject to decay Sawtimber and CNS Single family house
33% 97.75 77% 14% 9% 29 23%
Sawtimber
and CNS
Upkeep and
improvement
on houses
33% 31.42 77% 14% 9% 29 23%
Sawtimber
and CNS
Sawn-wood
Other uses
33% 30 77% 14% 9% 29 23%
Pulpwood Paper 100% 2 36% 14% 50% 14.5 56%
The model gave a GHG equivalency of 1 and a GHG equivalency of 23 (GGLS8 2010). A first order decay rate and a landfill gas mix of 50% and 50% were modeled in this study (NCASI 2004). We also considered that 49% of the landfills were equipped with methane capturing systems and 75% of the methane was burnt, in landfills with capturing abilities (Upton et al. 2008). Figure 1 shows the overall percentage (37%) of methane captured for energy.
Product substitution savings were based on the following:
Wood construction products were considered to have a 31% savings in emissions
over concrete products without considering carbon storage (Lippke et al. 2010). Biofuels were modeled as having an emission savings of 82.4% (Dwivedi et al.
2011).
GHG emissions of the fossil reference chain of bioliquids used for cogeneration
(electricity and heat) was 82 g equivalent (eq.)/MJ (GGLS8 2010). GHG emissions of the fossil reference chain of petrol and diesel was 83.8 g
eq./MJ (GGLS8 2010).
To calculate the amount of energy produced from wood, one dry ton of wood was set
equal to 17,936 MJ (NC Extension Forestry 2011).
Moisture content was assumed to be 50% for green wood (NC Extension Forestry
2011).
To calculate energy savings from recycled wood, 41% of the recycled wood was converted to long term products (same as virgin materials). Recycled long term products were also considered to require the same amount of energy for manufacturing and
such as paper do not continue storing carbon for long periods while in use or in landfills and do not result in large savings from substitution (Franklin 2011), only decay emissions (no savings) were input into the model.
Objectives
The specific investigation objectives are to: (1) maximize SEV, (2) maximize carbon storage in the forest, and (3) maximize carbon dioxide emission savings from product storage and substitution of more fossil fuel intensive products by biofuels and wood construction
products. The objectives are not congruent and are measured in different units. The model is formulated as a multiple objective nonlinear program. The decision variables are planting density, thinning timing and density, and rotation length.
The financial benefits were measured as the SEV of an acre of land producing timber. Objective S represents maximization of SEV. The discounted net revenues were calculated over an infinite time horizon with rotation age T and a discount rate rand includes (at time t, whenever there is a harvest) the stumpage price value returns for sawtimber, CNS, and pulpwood (from thinning and final felling) and regeneration costs (cost of site preparation, planting, and seedlings). is a function of the decision variables, planting density w, thin year x, residual thinning density y, and rotation length T, and of the non-decision variable,
price of k,sawtimber, CNS, and pulpwood, attime t. A 3% real discount rate was
employed in the example (Backeus et al. 2005, Pohjola and Valsta 2007, Cao et al. 2010).
S = (1)
Forest carbon (kg of eq./acre) was measured as the sequestration of one acre of forestland. Objective C represents maximization of forest carbon benefits. Carbon benefits are modeled as the difference between carbon in trees at t= 0 (bare ground, no carbon present) and ending forest carbon stock at T < 50 years. The amount of carbon sequestered depends on the forest’s growth g, which is determined utilizing the Hafley and Smith NCSU
Growth and Yield model equations.
C = (3)
g= (4)
Product carbon storage (kg of eq./acre/year) was measured as products from one acre of forestland utilizing the 100-year method. The 100-year method considers any carbon remaining in wood products in use or in landfills after 100 years as permanently stored (Galik et al. 2009b). Objective P represents maximization of the annual amount of carbon in products (storage minus emissions) which is permanently stored, carbon dioxide
emission savings from product substitution of construction materials , and carbon dioxide emission savings from product substitution of fossil fuels .
P = /T (5)
= (6)
= (7)
The feasible set for each objective included constraints on the growth of the loblolly pine due to site productivity, forest management practices through the set of specified ranges, and non-negativity.
Solution Approach Optimization Solver
An operational model will have a greater potential for utilization, if it can be solved with easily assessable, relatively inexpensive, and user-friendly software. Microsoft solver is one of the most widely released and employed general-purpose optimization modeling systems (Fylstra et al. 1998), which makes it an excellent candidate to solve an operation level model. Thus, it was chosen as the optimization solver.
Compromise Programming
Compromise programming was applied to minimize the gap between the achieved levels of SEV S, carbon storage in the forest C, and carbon dioxide emission savings from product storage and substitution P and the best values of each objective. The compromise equation scaled each objective by the inverse of its range, which allowed us to analyze the different objectives together. The objective of this study was to find the combination of stand
management activities that maximized the objectives. A feasible land management strategy
Feasible Set is defined in terms of a multiple objective programming model criteria:
, q Q = {S, C, P} (9)
Where:
= S (10)
= P. (12)
The ideal point is calculated as follows:
(13)
Where: n is the number of objectives, is the weight; is the best value of the
criterion; is the least optimal criterion, and is the result of implementing decision x
with respect to the criterion (Gershon 1982). There are three objectives in this analysis. The distance parameter pcan be between 1 and infinity; it takes into account the decision maker’s risk attitude and prevents the need for predetermined weights. If p equals 1 the
decision maker is considered risk neutral, and the solution is considered the compromise min sum or compromise average program. If pequals infinity, the decision maker is considered to have a high risk aversion (Krcmer 2005). For this model, a p value of 100 was employed to simulate a decision maker with relatively high risk aversion, and each objective was weighted equally. Positive and negative deviations were considered equally to calculate the smallest overall absolute deviation from the target structure.
The model was first solved for each objective separately (benchmark runs) with the model set at SI 65. All constraints that define the feasible set were in place, and an additional constraint was added to make harvests produce at least 6 cords of wood to prevent
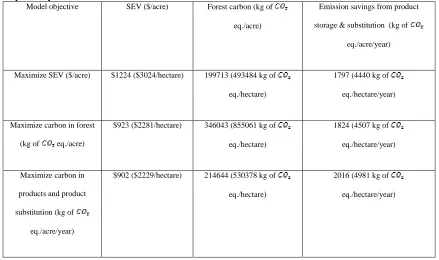
Table 3
Values Obtained from the Developed Model (SI 65) by Optimizing each Objective Separately
Model objective SEV ($/acre) Forest carbon (kg of eq./acre)
Emission savings from product storage & substitution (kg of
eq./acre/year)
Maximize SEV ($/acre) $1224 ($3024/hectare) 199713 (493484 kg of eq./hectare)
1797 (4440 kg of eq./hectare/year)
Maximize carbon in forest (kg of eq./acre)
$923 ($2281/hectare) 346043 (855061 kg of eq./hectare)
1824 (4507 kg of eq./hectare/year)
Maximize carbon in products and product substitution (kg of
eq./acre/year)
$902 ($2229/hectare) 214644 (530378 kg of eq./hectare)
2016 (4981 kg of eq./hectare/year)
Planting density, residual thinning density, and the thin year were increased, while the rotation age was decreased when managing for carbon dioxide emission savings from
product storage and substitution as opposed to SEV. Maximizing for forest carbon produced very similar management practices as maximizing for carbon dioxide emission savings from product carbon and substitution except that the rotation was extended. Table 4 shows the management regimes for each benchmark scenario, where only one objective is maximized. Table 4
Management Regimes for each Benchmark Scenario (SI 65)
Scenario Planting density
(TPA)
Residual Thinning Density (BA in square feet/acre)
Thin Year Rotation (years)
Max SEV 381 (941 TPH) 65 (15 square meters/hectare) 20 37
Max Ending Forest 575 (1421 TPH) 131 (30 square meters/hectare) 22 50
Graphs with the results of constrained planting densities, residual thinning densities, thinning years, and rotation lengths for each of the objectives are shown in figures 2-5 below. The results are for SI 65. Models were solved without minimum harvest constraints, and polynomial trend lines were added for each of the objectives.
Figure 2. The Developed Model Results for Planting Density. The values of two of the objectives have been scaled so that all three objectives fit on one graph. Forest carbon sequestration (kg of eq./acre)was divided by 300, and annual carbon dioxide emission savings from product storage and substitution (kg of eq./acre/year) was divided by 2. SEV ($/acre) was not scaled.
Figure 4. The Developed Model Results for Thinning Year. The values of two of the objectives have been scaled so that all three objectives fit on one graph. Forest carbon sequestration (kg of eq./acre)was divided by 300, and annual carbon dioxide emission savings from product storage and substitution (kg of eq./acre/year) was divided by 2. SEV ($/acre) was not scaled.
Figure 5. The Developed Model Results for Rotation Length. The values of two of the objectives have been scaled so that all three objectives fit on one graph. Forest carbon sequestration (kg of eq./acre)was divided by 300, and annual carbon dioxide emission savings from product storage and substitution (kg of eq./acre/year) was divided by 2. SEV ($/acre) was not scaled.
harvests at the peak mean annual increment, but optimizing management only for ending forest carbon yielded a harvest 22 years after the peak mean annual increment.
Application Results and Discussion
After solving for the optimal solutions for each objective, compromise programming was employed to solve for p= 100. For this problem, an additional constraint was added to make all changing variables integers. The integer constraint prevented half of a tree from being planted or harvested.
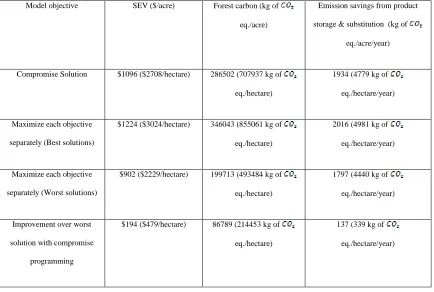
Optimizing management for multiple objectives of SEV, ending forest carbon, and carbon dioxide emission savings from product carbon and substitution extended the harvest beyond the peak mean annual increment. The compromise programming solution improved SEV by $194/acre ($479/hectare) over maximizing only carbon dioxide emission savings from product storage and substitution. It improved forest carbon by 86,789 kg of
Table 5
Difference between the Model (SI 65) Results for Compromise Solution and Maximizing each Objective Separately
Model objective SEV ($/acre) Forest carbon (kg of eq./acre)
Emission savings from product storage & substitution (kg of
eq./acre/year)
Compromise Solution $1096 ($2708/hectare) 286502 (707937 kg of eq./hectare)
1934 (4779 kg of eq./hectare/year)
Maximize each objective separately (Best solutions)
$1224 ($3024/hectare) 346043 (855061 kg of eq./hectare)
2016 (4981 kg of eq./hectare/year)
Maximize each objective separately (Worst solutions)
$902 ($2229/hectare) 199713 (493484 kg of eq./hectare)
1797 (4440 kg of eq./hectare/year)
Improvement over worst solution with compromise
programming
$194 ($479/hectare) 86789 (214453 kg of eq./hectare)
137 (339 kg of eq./hectare/year)
For verification of the optimization model’s growth and yield predictions, the optimal
total of 4818 cubic feet/acre (337 cubic meters/hectare) whereas the optimization model predicted 4769 cubic feet/acre (334 cubic meters/hectare); the results were within 1% of each other. In addition the model results were compared to Smith et al. (2006) for the average amount of carbon stored in products. Smith et al. estimated that 4504 cubic feet/acre (315 cubic meters/hectare) could be harvested with a 25 year rotation of loblolly pine on high intensity sites with high intensity management, and 16.6 tonnes of carbon/acre (41 tonnes of carbon/hectare) would go to products in use. Our model produced a lower estimate; 4313 cubic feet/acre (302 cubic meters/hectare) could be harvested with a 25 year rotation of loblolly pine (SI 75), and 11.9 tonnes of carbon/acre (29.4 tonnes of carbon/hectare) would go to products in use; the results are within 25% of each other.
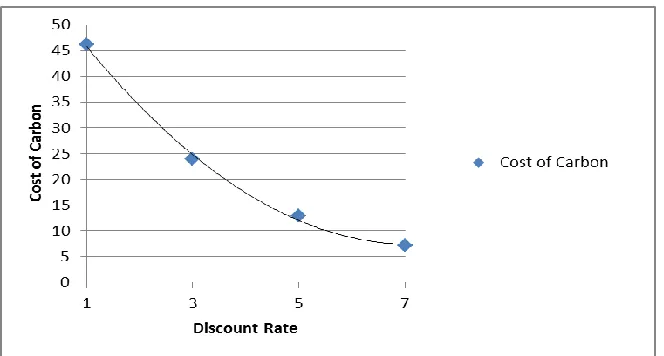
Figure 6. The Effect of Discount Rate on the Cost of Multiple-Management for Carbon. This optimization model does not include soil organic carbon specifically in the calculations. Some researchers in the past have assumed no change in soil organic carbon if no changes in land use occurred (Krcmer et al. 2005, Woodbury et al. 2007). This model considered only sustainable forest management and no land use changes. However, certain studies have shown that intensive management decreases the soil organic carbon (Peng et al. 2002, Sarkhot et al. 2007, Jimenez et al. 2008). Without the right level of soil organic carbon, the land might not be able to produce plants long-term (Sanchez et al. 2003). To incorporate this concern into the model, growth and yield equations were analyzed for three different site indices (55, 65, 75) at a base age of 25.
($1,359-$1,804/hectare), of 87,000-117,000 kilograms of eq./acre (214,974-289,103 kilograms of eq./hectare) in ending forest carbon, and of 590-640 kilograms of eq./acre/year
(1,458-1,581 kilograms of eq./hectare/year) of emission savings from product storage and substitution. Table 6 shows the compromise solution for each of the site indices. Table 6
Compromise Solutions for Models with Different Site Indices
Model SEV
($/acre)
Forest carbon (kg of
eq./acre)
Emission Savings from
product carbon &
substitution (kg of
eq./acre/year) Planting density (TPA) Thin year Residual Thinning
Density (BA in
square feet/acre)
Rotation
(years)
SI 55 $549
($1357/
hectare)
199750 (493575 kg of
eq./hectare)
1340 (3311 kg of
eq./hectare/year)
424 (1048
TPH)
22 89 (20.4 square
meters/hectare)
40
SI 65 $1096
($2708/
hectare)
286502 (707937 kg of
eq./hectare)
1934 (4779 kg of
eq./hectare)
476 (1176
TPH)
21 120 (27.6 square
meters/hectare)
39
SI 75 $1821
($4500/
hectare)
403518 (997079 kg of
eq./hectare)
2578 (6370 kg of
eq./hectare)
487 (1203
TPH)
17 124 (28.5 square
meters/hectare)
41
compromise solution for SI 75, the cost per tonne of eq. was very high compared to SI 55 and SI 65.
Conclusions
Although recently several authors have written about carbon sequestration in southern tree species (Nepal et al. 2012, Sohngen and Brown 2008, Smith et al. 2006), it can be hard to compare studies due to differences in objectives, products included, and non-decision
variables. Furthermore, very few studies take into account substitution of products and fuels. Recent work by Nepal et al. (2012) and Sohngen and Brown (2008) focused on increasing product storage through extended rotations. Extending the rotation brings more carbon for the single rotation but does not necessarily bring more carbon for multiple-rotations, unless the rotation length is based on the maximum annual rate of carbon storage.
for rotation objective management rather than single rotation multiple-objective management.
Our multiple-rotation multiple-objective model estimated a cost of $24/tonne of eq. for an increased optimal rotation of 2 years in the loblolly pine example. Sohngen and Brown (2008) estimated that 15 million tonnes of could be sequestered for less than $7/tonne and up to 209 million tonnes of could be sequestered for $55/tonne of . Nepal et al. (2012) estimated that forest landowners would need a carbon price of $50/tonne equivalent to increase the rotation age by 5 years.
It is important to note that the non-decision variables such as weights, discount rates, site index, costs, and prices do affect the cost of carbon. The weight parameter changes the relative importance of each objective according to decision maker; it is necessary because different decision makers will have varying viewpoints concerning what is important (Prodanovic and Simonovic 2003). Similar to Krcmar et al. (2005) equal weights were employed in the compromise programming solution for our loblolly pine example. The choice of a preferred solution, found using alternative sets of weights, is a value statement which is out of the realm of quantitative analysis and into the realm of politics. The
methodology utilized provides efficient solutions (Pareto optimality) for decision makers to choose between, it does not make political decisions.
The model developed in this study included operational level management variables, which makes it useful for providing guidance at the ground level, and it can be utilized to investigate competing forest management objectives including product storage and
loblolly pine, equations can be changed easily to different tree species and more active management regimes. Many different stakeholders will be involved in climate change policies, and for a policy to be passed, it will be important for the model to able to
demonstrate the tradeoffs between multiple objectives for each forest type. Although costs will vary among forest types, site indices, and regions, to encourage carbon sequestration in forests at a large scale, a policy will have to include a payment of at least the amount in foregone profits. A science based decision analysis model that can allow environmental policy makers to compare tradeoffs will be very beneficial in ensuring the development of economically viable policies for forest landowners and effective carbon sequestration policies for the environment.
Acknowledgements
A portion of this research has been funded by a grant from the U.S. EPA’s P3 Program.
Laurie Gharis was supported by a National Needs Fellowship co-sponsored by NCSU’s FER Department and the USDA-CSREES. The authors would also like to thank Richard