ABSTRACT
KUMAR, PRABHAT. Aseptic processing of a low-acid multiphase food product using a continuous flow microwave system. (Under the direction of K.P. Sandeep.)
Continuous flow microwave heating is an emerging technology in the food industry with a potential to replace the conventional retort process for viscous and pumpable food products. Aseptic processing of a low-acid multiphase food product using continuous flow microwave heating system can combine the advantages of an aseptic process along with those of microwave heating.
The main objective of this research was to develop a systematic approach for biological validation of aseptic processing of salsa con queso products using a continuous flow microwave system operating at 915 MHz. Dielectric properties of pumpable food products were measured by a new approach (under continuous flow conditions) and compared with the dielectric properties measured by the conventional approach (under static conditions). The results suggested that, for a multiphase product, dielectric properties measured under continuous flow conditions should be used for designing a continuous flow microwave heating system.
ASEPTIC PROCESSING OF A LOW-ACID MULTIPHASE FOOD PRODUCT USING A CONTINUOUS FLOW MICROWAVE SYSTEM
by
PRABHAT KUMAR
A thesis submitted to the Graduate Faculty of North Carolina State University
in partial fulfillment of the requirements for the Degree of
Master of Science
FOOD SCIENCE
Raleigh 2006
APPROVED BY:
__________________________ Dr. K.P. Sandeep
(Chair of Advisory Committee)
DEDICATION
To the most important lady in my life
BIOGRAPHY
ACKNOWLEDGMENTS
There are many people to be mentioned by name, but you know who you are. Teachers, colleagues, friends and family members -- your investment in me is partly responsible for everything I accomplish. However, the role of certain individuals was absolutely key in completing this work.
First of all, I would like to take this opportunity to thank my major advisor, Dr. K.P. Sandeep, for his guidance and encouragement throughout this work. He understands the individual needs of his students and generates thoughtful insight about every aspect of science. His expert advice and wisdom helped me to finish this work and made my studies under his supervision enjoyable.
Thanks are dedicated to Dr. Josip Simunovic for his constant advice, care, encouragement, motivation, support, and freedom which helped me to learn things in an enjoyable manner. I would like to thank Dr. Peter S. Fedkiw for his interest and suggestions during the course of this work.
Special thanks to Dr. Pablo Coronel for his suggestions and assistance with the experimental setup. He was always available for timely help which is greatly appreciated. I would also like to thank Dr. Mari Chinn, Gary Cartwright, Jack Canady, Penny Amato, and Sharon Ramsey for their assistance in conducting the experiments.
Supriyo Ghosh, and Paula Schneider.
TABLE OF CONTENTS
LIST OF TABLES . . . ix
LIST OF FIGURES . . . x
INTRODUCTION . . . 1
REVIEW OF LITERATURE . . . 6
2.1.1 Methods of thermal processing . . . 7
2.1.2 Kinetics in thermal processing . . . 9
2.2 Aseptic processing of food materials . . . 11
2.2.1 History of aseptic processing . . . 12
2.2.2 Aseptic processing of particulate foods . . . 14
2.2.2.1 Challenges in aseptic processing of particulate foods . . . 16
2.2.3 Components of an aseptic processing system . . . 18
2.3 Microwave heating of food materials . . . 23
2.3.1 History of microwaves . . . 24
2.3.2 Components of a microwave heating system . . . 25
2.3.2.1 Microwave generator . . . 25
2.3.2.2 Waveguide . . . 29
2.3.2.3 Applicator . . . 32
2.3.2.4 Circulator . . . 33
2.3.2.5 Directional coupler . . . 34
2.3.2.6 Tuner . . . 34
2.3.3 Dielectric properties . . . 34
2.3.3.1 Dielectric constant and loss factor . . . 35
2.3.3.2 Factors affecting dielectric properties . . . 38
2.3.3.2.1 Frequency . . . 39
2.3.3.2.2 Temperature . . . 41
2.3.3.2.3 Composition . . . 41
2.3.3.2.4 Density . . . 42
2.3.3.2.5 Change of phase . . . 44
2.3.3.3 Measurement of dielectric properties . . . 44
2.3.3.3.1. Network analyzer . . . 45
2.3.3.3.2 Open-ended coaxial probe method . . . 50
2.3.3.3.3 Transmission line method . . . 58
2.3.3.3.4 Resonant cavity method . . . 59
2.3.3.4 Dielectric properties of food materials . . . 59
2.3.4 Governing equations for microwave heating . . . 62
2.3.4.1 Maxwell’s equation . . . 62
2.3.4.3 Energy equation . . . 65
2.3.5 Applications of microwave heating . . . 67
2.3.5.1 Batch heating . . . 67
2.3.5.2 Continuous heating . . . 68
2.4 Biological validation of an aseptic process . . . 71
2.4.1 Thermophysical properties of food materials . . . 74
2.4.1.1 Density . . . 74
2.4.1.1.1 Measurement of density . . . 74
2.4.1.2 Viscosity . . . 77
2.4.1.2.1 Measurement of viscosity . . . 80
2.4.1.3 Specific heat . . . 81
2.4.1.3.1 Measurement of specific heat . . . 83
2.4.1.4 Thermal conductivity . . . 86
2.4.1.4.1 Measurement of thermal conductivity . . . 87
2.4.1.5 Thermal diffusivity . . . 89
2.4.1.5.1 Measurement of thermal diffusivity . . . 90
2.4.2 Design of conservative particles . . . 92
2.4.3 Calculation of hold tube length . . . 95
2.4.4 Biological validation . . . 96
SYMBOLS . . . 98
REFERENCES . . . 104
MANUSCRIPT I Measurement of dielectric properties of pumpable food materials under static and continuous flow conditions . . . 112
Abstract . . . 114
Introduction . . . 115
Materials and methods . . . 119
Results and Discussion . . . 122
Conclusions . . . 125
Acknowledgments . . . 126
Symbols . . . 127
References . . . 128
MANUSCRIPT II Thermophysical and dielectric properties of salsa con queso and its vegetable ingredients at sterilization temperatures . . . 139
Abstract . . . 141
Introduction . . . 142
Materials and methods . . . 145
Results and Discussion . . . 148
Conclusions . . . 154
Symbols . . . 156
References . . . 157
MANUSCRIPT III Feasibility of aseptic processing of a low-acid multiphase food product using a continuous flow microwave system . . . 174
Abstract . . . 176
Introduction . . . 177
Materials and methods . . . 179
Results and discussion . . . 181
Conclusions . . . 183
Acknowledgments . . . 184
Symbols . . . 185
References . . . 186
CONCLUSIONS . . . 193
LIST OF TABLES MANUSCRIPT I
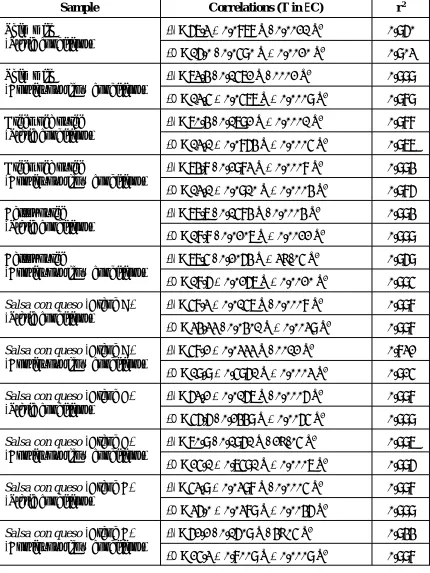
Table 1: Dielectric properties of different food materials as a function of temperature at 915 MHz...130 MANUSCRIPT II
Table 1: Density of salsa con queso and its vegetable ingredients at 22 EC...159 Table 2: Arrhenius constant (BA) and activation energy constant (Ea) for salsa con queso at different shear rates...160 Table 3: Specific heat (cp) of salsa con queso and its vegetable ingredients as a function of temperature...161 Table 4: Thermal conductivity (k) of salsa con queso and its vegetable ingredients as a function of temperature...162 Table 5: Thermal diffusivity (α) of salsa con queso and its vegetable ingredients as a function of temperature...163 Table 6: Dielectric properties of salsa con queso and its vegetable ingredients as a function of temperature at 915 MHz...164 MANUSCRIPT III
LIST OF FIGURES REVIEW OF LITERATURE
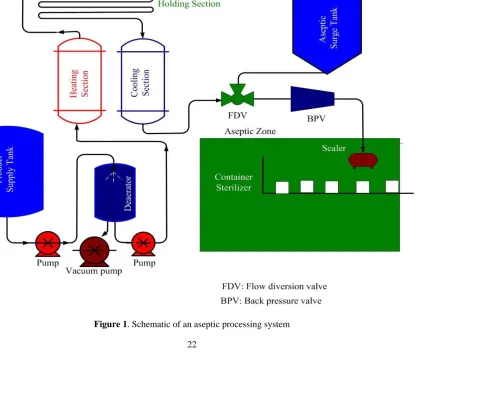
Figure 1: Schematic of an aseptic processing system...22
Figure 2: Schematic diagram of a traveling wave tube...26
Figure 3: Schematic diagram of a magnetron...28
Figure 4: Block diagram of a network analyzer...46
Figure 5: Distributed line parameters of a two conductor transmission line...52
Figure 6: Coaxial line probe connecting the generator to the load...54
Figure 7: Schematic of a helium gas pycnometer...77
Figure 8: Classification of non-Newtonian fluids...78
Figure 9: Relationship between shear stress and shear rate for Newtonian and non-Newtonian fluids...79
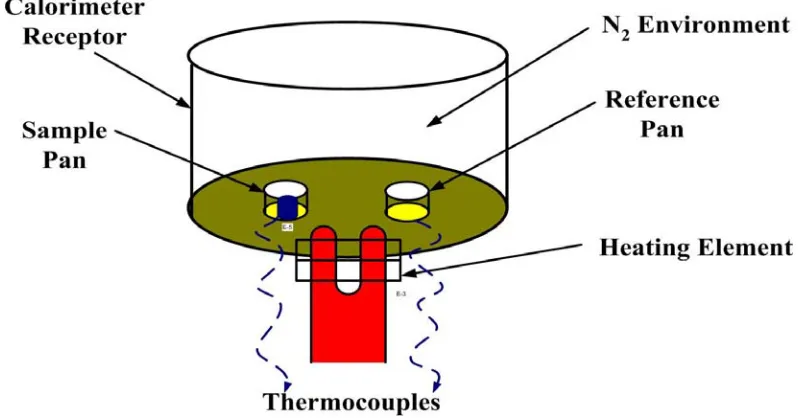
Figure 10: Schematic representation of a differential scanning calorimeter (DSC)...84
Figure 11: Cross-section of thermal conductivity probe...88
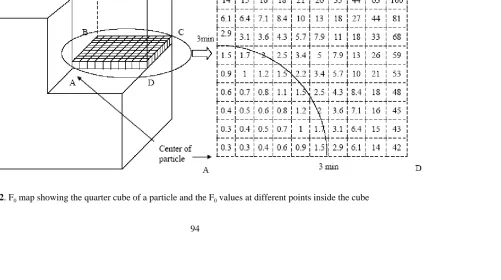
Figure 12: F0 map showing the quarter cube of a particle and the F0 values at different points inside the cube...94
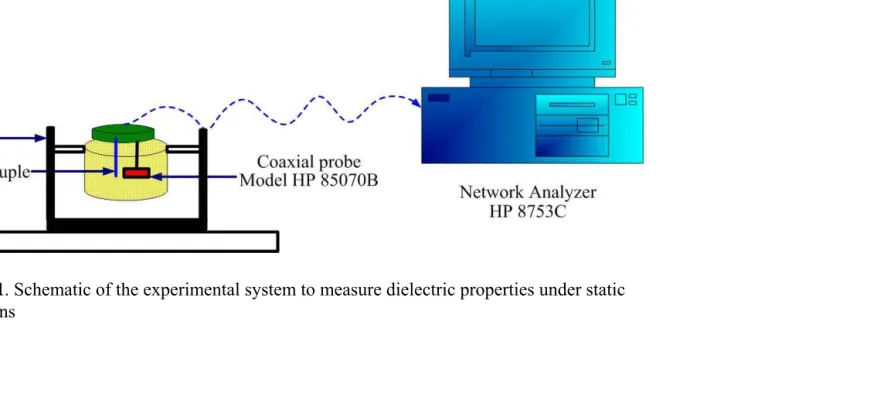
MANUSCRIPT I Figure 1: Schematic of the experimental system to measure dielectric properties under static conditions...131
MHz...133 Figure 4: Dielectric constant (εN) and dielectric loss factor (εO) of green pea puree at 915 MHz...134 Figure 5: Dielectric constant (εN) and dielectric loss factor (εO) of carrot puree at 915 MHz...135 Figure 6: Dielectric constant (εN) and dielectric loss factor (εO) of salsa con queso (Brand A) at 915 MHz...136 Figure 7: Dielectric constant (εN) and dielectric loss factor (εO) of salsa con queso (Brand B) at 915 MHz...137 Figure 8: Dielectric constant (εN) and dielectric loss factor (εO) of salsa con queso (Brand C) at 915 MHz...138 MANUSCRIPT II
Figure 8: Dielectric constant (εN) and dielectric loss factor (εO) of bell peppers at 915 MHz...172 Figure 9: Dielectric constant (εN) and dielectric loss factor (εO) of onions at 915 MHz ...173 MANUSCRIPT III
Chapter 1 INTRODUCTION
Thermal processing of food materials is the most widely used method of food preservation. The extent of thermal treatment given to a food product depends on whether the food product is a high-acid product or a low-acid product. A high-acid food product is one with a natural equilibrium pH of less than 4.6 and a water activity equal to or greater than 0.85. These food products include jams, jellies, tomato-based sauces, and pickled products. High-acid food products are typically treated at 90-95 EC for a period of 30-90 s to inactivate yeasts, molds, and bacteria (Lactobacillus species). A low-acid food product is one with a natural equilibrium pH of greater than 4.6 and a water activity equal to or greater than 0.85. These food products include butter, cheese, fresh eggs, pears, papaya, sweet apples, and raisins (Skudder, 1993).
Low-acid food products are capable of sustaining the growth of Clostridium botulinum spores. Clostridium botulinum is an anaerobic, gram-positive, heat-resistant spore-forming bacteria which produces a potent neurotoxin. Foodborne botulism is a severe type of food poisoning caused by the ingestion of foods containing the potent neurotoxin formed during the growth of Clostridium botulinum. The spores of Clostridium botulinum must be destroyed or effectively inhibited to avoid germination and subsequent production of the deadly toxin which causes botulism. Traditionally, conventional canning has been used to process low-acid food products to ensure the destruction of Clostridium botulinum spores (U.S. Food and Drug Administration, 1992).
retortable semirigid plastic containers or pouches, doubles seaming or heat sealing, followed by heating and cooling in a pressurized batch or continuous retort. Conventional canning produces commercially sterile and shelf stable product. Commercial sterility refers to absence of disease causing microorganisms, absence of toxic substances, and absence of spoilage causing microorganisms capable of multiplying under normal nonrefrigerated conditions of storage and distribution. Canning usually involves excessive thermal treatment of the product because heat transfer from the wall of the can to the center of the can is mainly by conduction and convection. Excessive thermal treatment of the product in conventional canning results in degradation of color, flavor, texture, and nutrients (David et al., 1996).
space requirement, eliminating the need for refrigeration, and easy adaptability to automation (David et al., 1996; Sastry and Cornelius, 2002).
Aseptic processing of liquid foods such as milk, fruit juices, salad dressings, and liquid eggs has been in place for several decades. Foods containing small particles (smaller than 3.2 mm) such as baby foods, cottage cheese, soups, and rice desserts have also been aseptically processed. However, aseptic processing of low-acid multiphase foods containing large particulates (larger than 3.2 mm) such as soups containing meatballs or vegetables has not been a commercial reality in the U.S. even though it has been in place in the European market for several years (Morris-Lee, 2004). In recent years, there has been an increasing interest in aseptic processing of low-acid multiphase food products. One such product is salsa con queso which is a commercially successful product with continued expansion. Currently, salsa con queso products are sterilized by the conventional retort process which is associated with degradation of color, flavor, texture, and nutrients.
aseptic process along with those of microwave heating.
However, aseptic processing of low-acid multiphase foods containing large particles (larger than 3.2 mm) such as soups containing meatballs or vegetables has not yet been a commercial reality in the U.S. even though it has been in place in the European market for several years (Morris-Lee, 2004). The main reason for this is that unlike in European countries, where approval of a process is based on spoilage tests, in the U.S., the FDA requires that the processor demonstrate by means of experiments and mathematical modeling that every part of the food product receives adequate heat treatment to ensure commercial sterility.
The time-temperature data of the critical point within the product is needed to show that the product receives adequate heat treatment. The critical point in a multiphase product is usually the center of the particle that receives the least heat treatment (critical particle). The critical particle in a system containing only one type and size of particle is the fastest moving particle in the holding tube. In a multiphase (multi particle) product, the fastest moving particle may not be the critical particle because the fastest moving particle with a high thermal diffusivity can receive more heat treatment that a slower moving particle with a low thermal diffusivity. The main problem in determining the critical particle in a multiphase product has been the inability to measure the temperature of particles suspended in a carrier fluid and flowing in a continuous system.
and 1996. The workshop participants included industry & university personnel and the FDA. The conclusions from the workshop were that determination of the residence time distribution (RTD) of at least 299 particulates in the products, determination of the heat transfer coefficient between the particulates and the fluid, and mathematical modeling are vital in process validation (CAPPS and NCFST, 1995, 1996). Tetra Pak, Inc. (IL, USA) made use of results from this study to successfully develop an aseptic process for a diced potato soup in a modified starch suspension and received a “no-objection letter” from the FDA for the process (Palaniappan and Sizer, 1997). Despite interest in the food industry, cost and time involved in the validation didn’t encourage Tetra Pak to market such a product. Campbell Soup Co. brought aseptic Gold Label soups in market in 2005, but small size and number of particles in the soup limit its widespread use among consumers.
Based on the results of the NCFST-CAPPS workshop, identification of the critical particle was essential for successful validation of a low-acid multiphase food product. Conservative (slowest heating) simulated particles can be designed and further used to validate aseptic processing of a food product. Conservative design means that the thermal protection provided by the design particles to its center is at least equivalent or greater than the thermal protection provided by the critical particle to its center under identical heating conditions.
Chapter 2
REVIEW OF LITERATURE 2.1 Thermal processing of food materials
Thermal processing of food materials is the most widely used method of food preservation. The extent of thermal treatment given to a food product depends on whether the food product is a high-acid product or a low-acid product. A high-acid food product is one with a natural equilibrium pH of less than 4.6 and a water activity equal to or greater than 0.85. These food products include jams, jellies, tomato-based sauces, and pickled products. High-acid food products are typically treated at 90-95 EC for a period of 30-90 s to inactivate yeasts, molds, and bacteria (Lactobacillus species). A low-acid food product is one with a natural equilibrium pH of greater than 4.6 and a water activity equal to or greater than 0.85. These food products include butter, cheese, fresh eggs, pears, papaya, sweet apples, and raisins (Skudder, 1993).
(U.S. Food and Drug Administration, 1992). Low-acid food products come under regulatory authority of either the FDA or the USDA depending on the proportion of meat or poultry in the food product. The general thermal process requirements of both regulatory agencies are similar and they are compiled in 21 CFR Parts 108 and 113 (FDA) and 9 CFR Parts 308, 318, 320, 327, and 381 (USDA) (Chandrana, 1992).
2.1.1 Methods of thermal processing
There are several methods of thermal processing of foods with pasteurization and sterilization being the two most widely used. Pasteurization refers to heat treatment of a product to kill all pathogenic vegetative microorganisms in it. The time temperature combinations for the pasteurization of milk are 63 EC for 30 min which is referred to as a low temperature long time (LTLT) process and 71.5 EC for 15 s which is referred to as a high temperature short time (HTST) process. The heat treatment in pasteurization is not sufficient to inactivate all spoilage causing vegetative cells or heat resistant spores. Therefore, the shelf life of pasteurized low-acid products such as milks and dairy products is approximately 2 to 3 weeks under refrigerated conditions.
microorganisms, toxic substances, and spoilage causing microorganisms capable of multiplying under normal nonrefrigerated conditions of storage and distribution. Shelf-stable food products can be stored without refrigeration at ambient environmental conditions (David et al., 1996).
Ultrapasteurization refers to pasteurization at temperatures of 138 EC or above for 2 s. This process further extends the shelf life of the product. Ultrapasteurization is sufficient to destroy a greater proportion of spoilage microorganisms, leading to extended shelf life of about 6 to 8 weeks. This process has been used for chocolate and flavored milks and non-dairy creamers in portion pack cups (David et al., 1996).
&dN
dt ' KTN (1)
N N0 ' e
&kTt
(2)
log10 N N0 '
&t
D (3)
2.1.2 Kinetics in thermal processing
When a homogeneous population of viable spores is subjected to a constant temperature, T, the rate of destruction of spores follows a first order reaction kinetics and is given by (David et al., 1996):
where, N is the number of spores surviving after time t (s) and KT is the reaction rate (s-1). Integration of equation 1 from time 0 to time t yields:
where, N0 is the number of spores at time t = 0. Equation (2) can be re-written as:
log10 DT Dref '
(Tref & T)
z (4) F ' m t 0 Ldt ' m t 0 10
T &Tref
z dt ' &D
ref log NN 0
(5)
where, DT is the D-value at temperature T and z is the change in temperature required to change the D value by 90%. The ratio of Dref to D is refereed to as the lethal rate (Lr). F value for a process is defined as the processing time at any temperature to achieve a certain level of microbial kill. F value can be computed in terms of lethal rate as (Ball, 1923):
The F value at a reference temperature of 121.1 EC (250 EF) and a z value of 10 EC (18 EF) is referred to as the F0 value. The F0 value required to achieve a 12 log reduction of Clostridium botulinum in a low-acid food product is 3 min. An F0 value of 3 min indicates that the process is equivalent to a heat treatment of 3 min at 121.1 EC. Thus, many combinations of time and temperature can yield an F0 value of 3 min. The ratio of F0 value of the process to the F0 value required for commercial sterility is known as lethality. Thus, process lethality must be at least 1.0 for commercial sterility. The product of F0 value required for commercial sterility and 10 (T
ref - T) / z is known as the thermal death time (TDT). TDT is the time required for total destruction of a microbial population or the time required for destruction of microorganisms to an acceptable level.
C ' m
t
0
10
T& Tref zc
dt (6)
quantified by cook value (C) which has been defined by Mansfield (1962) as:
The C value at a reference temperature of 100 EC (212 EF) and a zc value of 33.1 EC (91.5 EF) is referred to as the C0 value.
The objective of a food processor is to produce a commercially sterile product which retains nutritional and quality attributes at an acceptable level. Therefore, appropriate combination of time and temperature used for processing is based on factors such as nutrient retention and enzyme inactivation. D and zc values for destruction of nutritional and quality attributes are larger than that of the microorganisms. This implies that the rate of destruction of microorganisms at higher temperature will be much higher than the rate of destruction of nutritional and quality attributes. This forms the basis for aseptic processing of food materials. The benefits of aseptic processing arises from ultra high temperature (UHT) sterilization of food materials. UHT sterilization involves exposing the food product to very high temperatures in the range of 130-145 EC for a very short time (2 to 45 s). Thus, aseptic processing of food materials can achieve commercial sterility with better retention of nutritional and quality attributes (David et al., 1996).
2.2 Aseptic processing of food materials
thermal process in which the product and container are sterilized separately and brought together in a sterile environment. It involves pumping, deaeration, and sterilization of a food product, followed by holding it for a specified period of time in a holding tube, cooling it, and finally packaging it in a sterile container. The use of high temperature for a short period of time in aseptic processing yields a high quality product as compared to that by conventional canning. In addition, it is also possible to fill the finished product into flexible packages of different sizes and shapes. Some of the other advantages of aseptic processing include longer shelf life (1 to 2 years at ambient temperatures), less energy consumption, less space requirement, eliminating the need for refrigeration, easy adaptability to automation, and fewer operators. However, some of the disadvantages of aseptic processing include slower filler speeds, higher overall cost, need for better quality control of raw products, better trained personnel, better control of process variables and equipments, and stringent and extensive validation procedure (David et al., 1996; Sastry and Cornelius, 2002).
2.2.1 History of aseptic processing
temperatures as high as 450 EF (since dry heat requires higher temperature than wet heat), aseptic filling of the product, and sealing of the cooled product in a superheated steam environment. The first commercial aseptic plant was built in 1951 in Washington State, USA by Roy Graves and Jack Stambaugh. The process was based on one of the aseptic canning machines used in the Dole process. The early 1960s was marked with the advent of a form-fill-seal tetrahedron package made of polyethylene in Switzerland for aseptic filling of milk. This development was the starting point for expanding to different package types and sizes. The late 1960s saw the advent of the Tetra Brick aseptic processing machine. The late 1970s saw the advent of the Combibloc aseptic system which used carton blanks instead of roll stocks. Soon, aseptic filling in drums and bag-in-box fillers were established. The use of hydrogen peroxide for the sterilization of packaging surfaces was approved by the FDA in 1981 (David et al., 1996, Buchner, 1993).
to ensure commercial sterility.
2.2.2 Aseptic processing of particulate foods
The development of aseptic processing of particulate foods has been hindered by the requirement to demonstrate an adequate thermal treatment for every part of the food product. In the mid-to-late 1980s, FDA received two filings for aseptically processed low-acid food products containing particles. FDA had several discussions with each firm about the establishment of a scheduled process. Both firms withdrew the filings from further consideration. In the early 1990s, the National Food Processors Association (NFPA) made an effort to develop protocols for the establishment of an aseptic multiphase food process. FDA was still unable to resolve several fundamental issues after lengthy discussions with NFPA (Larkin, 1997).
N ' log (1 & Ci) log (1 & P) (7)
where, N is the population size, Ci is the confidence level (95%), and P is the fraction of
fastest particle (1%).
Tetra Pak, Inc. (Vernon Hills, IL) made use of the results from the above mentioned
workshop to successfully develop an aseptic process for a diced potato soup in a modified
starch suspension and received a “no-objection letter” from the FDA for the process.
Simulated potato particles made of epoxy with embedded small permanent magnets were
used as the particulates in the suspension. The density of the simulated particles was adjusted
so that the final density was less than the density of potato particles and close to the density
of the carrier fluid. Since particles having a density similar to the density of the carrier fluid
move faster along the holding tube, this yielded a conservative approach in the determination
of residence times (less than the residence times of real potato particles). Real potato
particles were also included in the RTD study to verify that the simulated particles yielded
conservative residence time values. Magnetic coils were placed at the entrance and exit of
the final heater, holding tube, and the pre-cooling unit. The electromotive force generated
by the magnet-containing simulated particles was recorded by a data acquisition system, and
the residence times in each section were obtained using the entrance and exit times. A finite
difference program was used to calculate the temperatures of the fluid and the particle, and
the accumulated lethality values were determined. The model was biologically validated
had a density that would yield shorter residence times than those of real potato particles. The
process proved to be safe based on the results of the mathematical model and the biological
validation (Palaniappan and Sizer, 1997). Though this product was not commercially
marketed, it demonstrated the feasibility of validating an aseptic process for multiphase
foods.
2.2.2.1 Challenges in aseptic processing of particulate foods
Despite the success of Tetra Pak in developing a validated process for aseptic
processing of multiphase foods, no such product has been commercially marketed by any
company. There are several reasons for this. The first and most important factor is the cost
and time involved in the extensive validation process (Larkin, 1997). This is partly due to
the necessity to determine the RTD of 299 particles and the heat transfer coefficient between
particles and the fluid. This necessity arises due to the fact that we are currently unable to
measure the time-temperature history at the “critical point” within particulates as they flow
through the processing system (Chandarana, 1992). The “critical point” is the slowest
heating portion of the product. For a food product containing only one type of particle, this
is the center of the fastest moving particle. However, for a food product containing several
types of particles, the “critical point” is the center of the slowest heating particle which may
not necessarily be the fastest particle in the system. Thus, if we are able to determine the
“critical particle” in a system and use that as the carrier of the microorganism of concern for
that particular food product, it would simplify the validation process and make the process
relatively inexpensive.
developing a filing of low-acid multiphase food product (Dignan et al., 1989).
1. Identification and selection of appropriate F0 value
2. Development of a conservative model that predicts the F0 value delivered to
the critical point
3. Quantitative microbiological validation of the F0 value delivered to the
critical point
4. Listing of critical factors and procedures for controlling the F0 value
2.2.3 Components of an aseptic processing system
An aseptic processing system has the following components -- product supply tank, pump, deaerator, heating section, holding tube, cooling section, flow diversion valve, aseptic surge tank, back pressure valve, and packaging system. A schematic representation of an aseptic processing system is shown in figure 1. The product is pumped from the product supply tank to the deaerator using a pump. The deaerator is a vessel maintained at a certain degree of vacuum by means of a vacuum pump. The product is fed into the deaerator at 55-70 EC. The product is deaerated to minimize oxidative reactions which may reduce the quality of the product during processing and storage. The deaerated product is discharged through the bottom and pumped to the heating section where the product is heated to the sterilization temperature.
Several heating systems are used for heating the product in an aseptic process. The choice of heating system is based on the characteristics of the product. Some of them have been described below (Skudder, 1993):
1. Steam injection: This is used for homogeneous and high viscosity products and is particularly suited for shear sensitive products such as creams, desserts, and viscous sauces. The liquid product is heated by injection of steam. The rapid heating by steam combined with rapid methods of cooling can yield a high quality product. However, this method is only suitable for liquids with no particles. Another disadvantage of this method is the reduced heat recovery of about 50%.
and is particularly suited for shear sensitive products such as creams and desserts. This method, similar to steam injection, involves infusing a thin film of liquid product into an atmosphere of steam which provides rapid heating.
3. Plate heat exchangers: These are used for homogeneous and low viscosity products (milk, juice, and thin sauce) containing particle sizes up to approximately 5 mm. These heat exchangers consist of closely spaced parallel stainless steel plates pressed together in a frame. Gaskets made of natural rubber or synthetic rubber seal the plate edges. These heat exchangers provide a rapid rate of heat transfer due to the large surface area for heat transfer and turbulent flow characteristics.
4. Tubular heat exchangers: These are used for homogeneous and high viscosity products (soups and fruit purees) containing particles of sizes up to approximately 10 mm. The simplest tubular heat exchanger is a double pipe heat exchanger consisting of a pipe located concentrically inside another pipe. These heat exchangers are the most widely used ones for UHT sterilization.
the scraping blades prevents fouling on the heat exchanger surface and improves the rate of heat transfer. These exchangers are the best choice for viscous products containing particulates. A disadvantage of these exchangers is that particles are likely to be damaged because of excessive physical action of the blades (Carlson, 1991).
6. Microwave heating unit: Continuous flow microwave heating is an emerging technology in the food industry with a potential to replace the conventional heating process. In contrast to conventional heating, heating by microwave provide volumetric heating of the entire food product. Instant start-up and rapid heating of food products make microwave heating suitable for aseptic processing of low-acid multiphase food products. Continuous flow microwave sterilization is also associated with improved color, flavor, texture, and nutrient retention. Thus, aseptic processing of a low-acid multiphase food product using continuous flow microwave heating system can combine the advantages of an aseptic process along with those of microwave heating.
given in the heating section because the temperature distribution within the product in the heating section is uncertain. Credit is not given in the cooling section because particulates could possibly break up in the cooling section and thus cool rapidly, thereby not accumulating significant amount of F-value. Therefore, an appropriate combination of time and temperature in the hold tube must be selected to ensure adequate accumulation of F-value for commercial sterility of the product.
Another important part of an aseptic processing system is the back pressure valve which provides sufficient pressure to prevent boiling of the product at processing temperatures which can be as high as 125-130 EC. An aseptic surge tank provides the means for the product to be continuously processed even if the packaging system is not operational due to any malfunction. It can also be used to package the sterilized product while the processing section is being resterilized.
2.3 Microwave heating of food materials
Microwaves are a part of the electromagnetic spectrum and have a frequency
between 300 MHz and 300 GHz. They lie between the radio (3 kHz - 300 MHz) and infrared
(300 GHz - 400 THz) frequencies of the electromagnetic spectrum. Microwave radiation has
the ability to heat materials by penetrating and dissipating heat in them. This behavior is
used for obtaining controlled and precise heating for materials development and process
engineering. Microwaves have got applications in the polymer and ceramic industries
(joining, sintering, combustion synthesis, melting, epoxy curing, preheating rubbers, and
thermosetting), medicine (thawing frozen tissues, warming blood, and tumor therapies), and
textiles (drying) (Saltiel and Datta, 1999). Microwaves have been used for several food
processing operations including thawing, blanching, pasteurization, sterilization,
dehydration, baking, and roasting (Bengtsson and Ohlsson, 1973). Key components required
for the design of a microwave processing system are: capability to produce radiation in the
spectrum that will couple with the material being processed, efficient delivery of the
radiation to the sample, and control of power distribution. In the U.S., only four microwave
frequencies (915 ± 13, 2,450 ± 50, 5,800 ± 75, and 24,150 ± 125 MHz) are permitted by
Federal Communications Commission (FCC) for industrial, scientific, and medical
applications (47 CFR18.301, 2005).
The important advantages in microwave heating application as compared with
conventional heating include instant start-up, faster and selective heating, and energy
efficiency. The main disadvantage associated with microwave heating is non-uniform
2.3.1 History of microwaves
Percy Spencer (Raytheon Manufacturing Laboratories, Massachusetts, 1945) was the
first to conceptualize the use of microwaves for heating food. The first patent (American
Patent no. 2495-429) was filed by him in 1945 which described two magnetrons in parallel
feeding a waveguide. The microwaves exiting the waveguide impinged upon food on a
conveyor belt and cooked it. He filed another patent (American Patent no. 2480-679) which
described the terms microwave oven and cavity for the first time. This patent was granted
in 1949. Spencer got a patent (American Patent no. 2605-383) for conveying materials
through a microwave oven in 1952. A prototype microwave oven operating at 915 MHz for
thawing and precooking frozen meals was reported by General Electric in 1947. The
Radarange®, the first commercial microwave oven, was demonstrated by Raytheon in 1947.
This provided an output power of 1.6 kW from one water-cooled permanent magnet
magnetron. K.J. Steiffel developed the first slotted waveguide (American Patent no.
2560-903) and first discussed the idea of using a metallic cover for reflecting microwaves
surrounding foodstuffs. Raytheon established an industrial microwave division under the
direction of W.C. Brown in the 1950s. The first commercial microwave oven for heating
foods became available from Raytheon in the early 1950s. The first tunnel oven was
manufactured in 1948 by Thomsan-Houston (French Patent no. 640783). The first
multimode cavity incorporating wavetraps was introduced by Wolfgang Schmidt (German
Patent no. 3048-686). The British company AEI developed the BM 25A magnetron that
delivered 25 kW at 896 MHz. Microwave ovens were first introduced on a large scale in
commonplace household applications (Osepchuk, 1984; Saltiel and Datta, 1999).
2.3.2 Components of a microwave heating system
A microwave heating system, either batch or continuous, have three major
components -- a microwave generator, a wave guide, and an applicator. Apart from these
three major components, circulator, directional coupler, and tuner form part of a continuous
flow microwave heating system.
2.3.2.1 Microwave generator
Microwave radiation is generated by acceleration of charge. A number of electronic
devices are capable of generating microwave radiation. Solid state microwave devices are
not able to deliver the high power required for heating applications. Currently, vacuum tubes
(linear beam tubes including klystron and traveling wave tubes and crossfield beam tubes
which includes magnetron) are used for generating microwaves. The klystron modulates the
movement of electrons using linear fashioned resonant cavities. The klystron was first
invented in 1935 by Oscar Heil and A. Arsenjewa-Heil of the C. Lorenz AG company in
Berlin.
Similar to klystrons, traveling wave tubes are linear-beam tubes that employ electron
beams to amplify a microwave signal. Travelling wave tubes are used to generate variable
frequency microwaves. A voltage controlled oscillator generates the microwave signal. The
frequency of the microwave signal is controlled by the input voltage. Signal is then sent to
the traveling wave tube for amplification. The traveling wave tube (figure 2) consists of a
electron gun and a helical transmission line. The heated cathode emits a stream of electrons
Figure 2. Schematic diagram of a traveling wave tube
field. The helical transmission line slows the velocity of the microwave in the axial direction
(phase velocity) of the helix to make it equal to the velocity of the electron beam. The axial
component of the microwave propagating along the helix interacts with the electron beam.
This accelerates or decelerates the electrons within the electron beam. When the velocity of
the electron beam becomes faster than phase velocity of the microwave, more electrons are
decelerated than accelerated. Thus, microwave signal is amplified because energy is
transferred from the electron beam to the microwave field (Thostenson and Chou, 1999).
The magnetron, a diode-type electronic tube that converts an electrical voltage to
microwave radiation, was first conceived in 1921 by Albert Wallace Hull. Magnetron is a
circular symmetric tube that consists of a metallic cathode as the central axis of the tube and
a hollow cylindrical anode vanes around the circumference (figure 3). The cathode is usually
a helix of tungsten that is heated to emit electron by passing electric current through it. The
cathode. These resonant cavities act as tuned circuits to determine the output frequency of
the microwave. Since anode is at a higher potential as compared to cathode, the potential
difference between them produces a strong electric field. This strong electric field heats the
cathode to remove loosely bound valence electrons. The magnetron operates by controlling
the flow of electrons from the cathode toward the anode. A magnetic field is applied parallel
to the axis of the anode and perpendicular to the electron path. This ensures that the electrons
travel in a quasi-circular path around the cathode and form an electron cloud. The electron
cloud moves continuously and induces positive charges in each cavity segment as it rotates
around the axis. This leads to oscillations in the cavities and the frequency of oscillation
depends on the size of the cavities. The excess microwave energy is extracted from one of
the resonant cavities to the waveguide by a coupling probe. Antenna is an example of a
coupling probe which transmits microwave energy from magnetron to waveguide in the form
of a transverse electromagnetic (TEM) wave. The average power output of a magnetron can
be controlled by adjusting the anode current and the magnetic field strength. Magnetrons are
widely used because of their compactness and inexpensive cost (Saltiel and Datta, 1999;
2.3.2.2 Waveguide
At low frequencies, wavelength of signals are much larger than the length of the circuit conductors. Therefore, a simple wire is used for carrying the signal. At higher frequencies, the wavelength of signals are comparable or much smaller than the length of the conductors. In this case, guided structure is needed for efficient power transmission. Two commonly used guided structures for propagation of microwaves are transmission lines and waveguides. Transmission line propagation (two-wire transmission lines and coaxial cable) is used extensively at lower frequencies because it becomes inefficient at higher frequencies (3-300 GHz) due to dielectric losses. Waveguides are hollow metal tubes used for propagation of microwaves at higher frequencies. The waveguide concept was first proposed by J.J. Thomson in 1893 and experimentally verified by O.J. Lodge in 1894 using electromagnetic waveguides. The mathematical analysis of the propagating modes of electromagnetic waves within a hollow metal cylinder was first performed by Lord Rayleigh in 1897. One major difference between a transmission line and waveguide is that a transmission line can only support transverse electromagnetic wave whereas a waveguide can support many possible field configurations (Sadiku, 2001).
x, y, and z directions. These
modes of the electric and magnetic fields have been classified in four categories as follows (Sadiku, 2001).
1. Transverse electromagnetic modes (TEM) -- In this mode, both E and H fields are transverse to the propagation of the wave [Hz = Ez = 0]. TEM modes are not supported by rectangular waveguides.
2. Transverse electric modes (TE) -- The components of the electric field are transverse to the propagation of the wave, while the magnetic field is parallel to the propagation.
3. Transverse magnetic modes (TM) -- The components of the magnetic field are transverse to the propagation of the wave, while the electric field is parallel to the propagation of the wave.
4. Hybrid modes -- Neither the electric or magnetic field are transverse to the propagation of the wave
fc ' u) 2
m a
2
% n
b
2
(8)
u) ' 1
µε (9)
ηTE ' η)
1 & fc f
2 (10)
η) ' µ
ε (11)
of the waveguide. For a rectangular waveguide of width a and height b filled with a lossless dielectric material, cut-off frequency is given by:
where, uN is given by:
The intrinsic wave impedance (ηTE) of the mode is obtained from the following equation:
where, ηr is the intrinsic impedance of the uniform plane wave in the dielectric medium and is given as:
(Sadiku, 2001).
The transmission of microwaves in a waveguide generates a standing wave, but the application of a load changes the shape of the standing wave and increases reflection of the waves. The impedance of the load has to be matched to the impedance of the waveguide to maintain the standing wave ratio and minimize reflection of waves. Impedance matching in a waveguide by tuners.
2.3.2.3 Applicator
The applicator transfers electromagnetic energy from the waveguide to the material to be heated. The size and shape of the applicator depend on (1) the operating frequency, (2) the properties, size, and shape of the material, and (3) type of processing (batch vs. continuous). There are three types of applicator by the type of electromagnetic field configurations - near field applicators, single mode applicators, and multi mode applicators. Microwaves are applied directly to the material in near field applicator. A part of the microwaves, not absorbed by the material, should be transformed into heat by dielectric loads (usually water) behind the materials. These applicators can yield a homogeneous electric field distribution since a standing wave can not develop. They work best with materials which are good absorbers of microwaves.
Many modes are established in multimode applicators as the cavity dimensions are large as compared to the wavelength of the microwaves. The design of multi mode applicators is based on trial and error and experience rather than the solution of Maxwell equations. Despite the high number of modes, a non-uniform electric field distribution is developed in mutli mode applicators as opposed to single mode applicators. Multi mode applicator is used in home microwave ovens. The presence of different modes results in multiple hot spots within a microwave cavity of multi mode applicator. These hot spots result in localized over heating. Several techniques are used to reduce the effects of hot spots and to obtain uniform heating. The size of the cavity can be increased to improve the uniformity of the microwave field. Turntables move the food material through areas of high and low power to achieve time averaged uniformity. Mode stirrers can also be used along with multi mode applicators to improve the uniformity of the microwave field. Mode stirrers are reflectors which redistribute the microwave field by rotating within the cavity near the waveguide input.(Saltiel and Datta, 1999; Thostenson and Chou, 1999; Regier and Schubert, 2001).
2.3.2.4 Circulator
power that is reflected back to the microwave generator is absorbed by the dummy load (Thostenson and Chou, 1999).
2.3.2.5 Directional coupler
Directional coupler measures the magnitude of forward and reflected power in a microwave heating system. They are designed such that a small portion of forward and reflected microwaves are separated and measured by power meters (Thostenson and Chou, 1999).
2.3.2.6 Tuner
The impedance of the load has to be matched to the impedance of the waveguide to maximize power absorption and minimize reflection of waves. Tuners (irises, three stub tuners, and E-H plane tuners) are used for impedance matching which is done by placing small rods of a conductive material at a known distance from the load and changing the depth of their insertion (Thostenson and Chou, 1999).
2.3.3 Dielectric properties
Dielectric polarization and ionic conduction are primarily responsible for heat generation in dielectric materials under a microwave field. When an external electric field is applied, bound charges in polar molecules create electric dipoles by shifting relative to each other. The dipole is represented in vector form by the dipole moment. Polarization is the average dipole moment per unit volume. There are four main types of dielectric polarization, namely, electronic polarization, atomic polarization, orientation polarization and, space charge polarization. Electronic polarization, which occurs in atoms, is due to the displacement of electrons with respect to the nucleus. Atomic polarization is due to the separation of positive and negative ions in a molecule. Orientation polarization occurs when dipoles try to follow a rapidly changing electric field. Unlike electronic and atomic polarization, orientation polarization is dependent on temperature. Space charge polarization is due to the separation of charges when free electrons are restricted by obstacles. This is also referred to as interfacial or Maxwell-Wagner polarization. The other important mechanism is ionic conduction. When exposed to an external electric field, ions move in the direction of the electric field and energy is transferred by their movement. The relative importance of dielectric polarization and ionic conduction depends on the operating frequency and temperature. Ionic conduction predominates at frequencies below 1 GHz whereas polarization losses are important at frequencies above 1 GHz (Saltiel and Datta, 1999; Ryynanen, 1995).
2.3.3.1 Dielectric constant and loss factor
D ' εE (12)
B ' µH (13)
J ' σeE (14)
ε ' ε0(ε) & jε)))
(15)
parameters relate field strength vectors to their respective flux densities by the following equations (Saltiel and Datta, 1999):
where, D, B, and J are the vector electric, magnetic, and current flux densities respectively, and E and H are the electric and magnetic field strengths. dielectric properties is important for the design of a continuous flow microwave heating system. Dielectric properties consist of dielectric constant (ε') and dielectric loss factor (ε"). Dielectric constant is a measure of the ability of a material to store electromagnetic energy whereas dielectric loss factor is a measure of the ability of a material to convert electromagnetic energy to heat (Metaxas and Meredith, 1983). Dielectric constant and dielectric loss factor can be defined in terms of complex permittivity (ε). The complex permittivity (ε) is composed of a real part (ε', relative dielectric constant) and an imaginary part (ε", effective relative dielectric loss factor) and is given by the equation (Saltiel and Datta, 1999):
where, j = (-1)0.5 and ε
ε))
r(ω) 'ε))d(ω) % ε))e(ω) % ε))a % ε))s %
σe
ε0ω (16)
µ ' µ0(µ) & j µ)))
(17)
ε00 is the loss contribution from all microwave-material interaction mechanisms and is given by (Saltiel and Datta, 1999):
where, ω is the angular frequency (2πf); the subscripts d, e, a, and s refer to dipolar, electronic, atomic, and space charge respectively; and the last term is the contribution due to ionic conduction losses. Loss tangent (tan δ), a parameter used to describe how well a product absorbs microwave energy, is the ratio of dielectric loss factor (ε") to the dielectric constant (ε'). A product with a higher loss tangent will heat faster under microwave field as compared to a product with a lower loss tangent (Saltiel and Datta, 1999).
Similarly, losses in magnetic materials can be defined by a complex permeability (µ) as (Saltiel and Datta, 1999):
where, µ0 is the relative permeability, µ00 is the effective relative magnetic loss factor, and µ0 is the permeability of the free space (4π × 10-7 H/m). Magnetic loss is neglected while considering food materials as most of them are magnetically transparent (Saltiel and Datta, 1999).
δs ' λ
π 2ε) 1 % (ε))
ε)) 2
& 1 (18)
δs ' nrλ
kr2π (19)
δp ' δs
2 (20)
where, λ is the wavelength of the microwave in free space in meters. The above equation is valid for a plane wave incident upon a semi-infinite slab.
In terms of the optimal parameters, it can be defined as:
where, nr and kr are the real and imaginary indices of refraction respectively, and λ refers to the wavelength (Saltiel and Datta, 1999).
Power penetration depth (δp), often used in microwave heating applications, is the distance at which power drops to e-1 of its value at the surface of the material and is related to the skin depth as (Nelson and Datta, 2001):
2.3.3.2 Factors affecting dielectric properties
ε ' ε4 % εs & ε4 1 % jω τ (21)
where, ε4 is the dielectric constant at very high frequencies
εs is the dielectric constant at very low frequencies
j is &1
τ is the relaxation time
ω is the frequency of radiation
εN ' ε4 % εs & ε4
1 % ω2τ2 (22)
εNN ' (εs & ε4)ω τ 1 % ω2τ2 (23)
dielectric properties of particulate materials.
2.3.3.2.1 Frequency
The dielectric properties of most materials vary considerably with the frequency of the applied electric field. Dielectric polarization contributes to the frequency dependence of the dielectric properties. The frequency dependence of dielectric properties for pure polar materials is described by the following equation (Debye, 1929):
Equation (21) can be separated into real and imaginary parts as:
ε ' εs & ε4
1 % (jω τ)1&αs (24)
frequencies because the dipoles have enough time to follow the variations of the applied electric field. The dielectric constant has a minimum value of ε4, which is constant, at very high frequencies because the dipoles are not able to follow the rapidly changing electric field. The dielectric loss factor is small at both very high and very low frequencies. The polar molecules in a solution aligns themselves along the direction of any external electric field applied. The time taken by the molecules to achieve their random orientation from this aligned state on removing the electric field is known as the relaxation time (τ). The dielectric loss factor has a maximum value at the relaxation frequency (ω = 1/τ). The dielectric constant changes from a very high value before the relaxation frequency to a very low value after the relaxation frequency. The relaxation frequency for pure water at 20 EC is 17.004 GHz. Therefore, the most effective conversion of microwave energy into thermal energy should occur in this frequency region The maximum value of tan δ occurs at slightly higher frequency than the relaxation frequency (Gabriel et al., 1998). Equation (21) can be represented in the complex plane as a ‘Cole-Cole’ diagram (Cole and Cole, 1941). The ‘Cole-Cole’ diagram is a semicircle with a locus of a point ranging from (ε0 = εs, ε00 = 0) at the low frequency limit to (ε0 = ε4, ε00 = 0) at the high frequency limit.
The frequency dependency of dielectric properties of materials which are not pure polar can be given by the Cole-Cole equation (Cole and Cole, 1941):
2.3.3.2.2 Temperature
Temperature has a significant effect on the dielectric properties of materials. The temperature dependence of the dielectric properties of water is a function of the dielectric relaxation processes. The relaxation time decreases with increase in temperature which shifts the peak of the dielectric loss factor to higher frequencies. Since relaxation time is the time taken by polar molecules to align themselves along the direction of the field, a decrease in its value decreases the dipolar contribution to the dielectric constant. Thus, the dielectric constant in the region of relaxation frequency increases with an increase in temperature whereas the dielectric loss factor may either increase or decrease depending on whether the operating frequency is higher or lower than the relaxation frequency. (Nelson and Datta, 2001). The dielectric loss factor of a salt solution is due to the combined effect of dielectric polarization and ionic conduction. Contribution to dielectric loss factor from dielectric polarization decreases with temperature whereas contribution from ionic conduction increases with temperature. The increase in ionic conduction can be attributed to the decreasing viscosity, which in turn increases the mobility of ions (Datta et al., 2005).
2.3.3.2.3 Composition
frequencies, but they can effect the dielectric properties by forming hydrogen bonds with water. For carbohydrate solutions, effect of free water on dielectric properties becomes significant. Gelatinization of starch increases dielectric properties by binding less water to its structure and thus increasing the amount of free water. Proteins do no significantly interact with microwaves. However, protein denaturation affects the dielectric properties of food materials. The dielectric properties of fats and lipids are very low and their only effect on dielectric properties is due to dilution of water (Datta et al., 2005).
The dielectric constant of a fibrous material is higher than that of a granular material. The effect of pH is not significant at the pH levels typical in foods. There is a positive correlation between the dielectric constant and the water content whereas the correlation for the dielectric loss factor is uncertain. Fat influences the dielectric properties by diluting the water content of the material (Ryynanen, 1995).
2.3.3.2.4 Density
ε1/2 ' υ
1(ε1)1/2 % υ2(ε2)1/2 (25)
ε1/3 ' υ
1(ε1)1/3 % υ2(ε2)1/3 (26)
ε & ε1
3ε ' υ2
ε2 & ε1
ε2 % 2ε (27)
ε & ε1 ε1 & ε2
ε1 ε
1/3
' 1 & υ2 (28)
ε & ε1
ε % 2ε1 ' υ2
ε2 & ε1
2ε1 % ε2 (29)
lnε ' υ1ln(ε1) % υ2ln(ε2) (30) Complex refractive index mixture equation:
Landau and Lifschitz, Looyenga equation (Landau and Lifschitz, 1967; Looyenga, 1965):
Bottcher equation (Bottcher,1944):
Bruggeman-Hanai equation:
Rayleigh equation:
where, ε represents the permittivity of the mixture
ε1 is the permittivity of the medium in which particles of permittivity ε2 are dispersed
υ1 and υ2 are the volume fractions of the respectivecomponents where υ1 % υ2 ' 1
2.3.3.2.5 Change of phase
Change of phase is responsible for a very sharp change in the dielectric properties of food materials. Thus, accurate determination of dielectric properties of frozen and partially frozen products is important to determine the rate and uniformity of heating of those products during microwave thawing. The dielectric constant and the dielectric loss factor increase significantly when ice melts. Thus, portions of frozen products, that thaw first, can start boiling by absorbing more microwave energy and heating up at increasing rates while the other portions of the same product are still frozen. This undesirable phenomena is commnoly known as runaway heating. Runaway heating is the ability of a material to absorb increasing amount of microwave energy with an increase in its temperature (Datta et al., 2005).
2.3.3.3 Measurement of dielectric properties
accuracy required (Nelson, 1999).
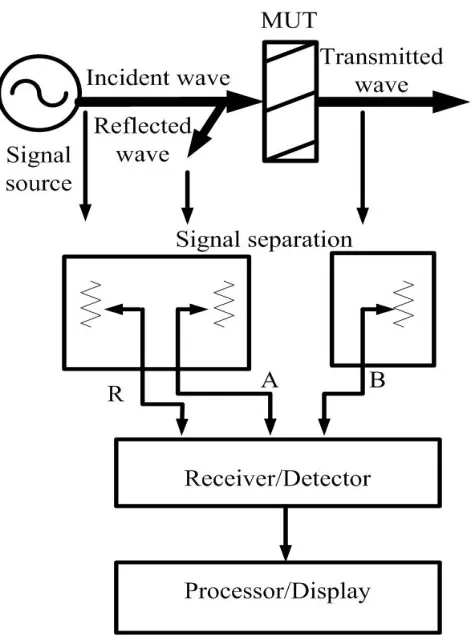
Dielectric property measurement of a material-under-test (MUT) consist of the following steps -- generate a microwave signal at the frequencies of interest, direct the signal through the MUT, measure the changes in the signal caused by the MUT, and compute the permittivity (ε). Measurement of dielectric properties involves incident, reflected, and transmitted waves traveling along transmission lines. Specifically it involves accurate measurement of the ratio of the reflected signal to the incident signal and/or the transmitted signal to the incident signal. A network analyzer is an instrument used to analyze the properties associated with reflection and transmission of electrical signals. The basic principles of working of a network analyzer has been described below (Ball, 1998).
2.3.3.3.1. Network analyzer
V(t) ' Vosin(2πfot) (31)
Figure 4. Block diagram of a network analyzer
Signal source section
A signal source produces sine waves. The sine wave in time domain is expressed as:
The frequency and amplitude of the sine wave can be set to a desired value in most of the CW sources. A swept source can automatically vary the output frequency or amplitude of the sine wave over a range of frequencies or amplitudes. There are two types of frequency sweeps -- ramp sweep and step sweep. The frequency of the output sine wave is increased from a start frequency to a stop frequency in ramp sweep. The frequency of the output sine wave is abruptly changed from one frequency to another in step sweep. A signal generator can add modulation to the sine wave. Thus, signal generators output signals that can carry information. Basic signal generators have amplitude, frequency, and phase modulation capabilities. The ability to generate modulated signals is the main difference between a signal generator and a CW source.
output.
Signal separation section
Signal separation section performs two functions. The first is to measure a portion of the incident signal to provide a reference for ratioing. This is done with splitters or directional couplers. Directional couplers are preferred as they have very low insertion loss and good isolation of the signal and directivity. Directivity is a measure of how well a coupler can separate signals moving in opposite directions. The second function of this section is to separate the incident wave and reflected wave at the surface of MUT. Directional couplers are ideal for this function, but due to difficulty in making broadband couplers, bridges are often used. Bridges operate similar to the simple wheatstone bridge and are very useful in measuring reflection because they can work over a very wide range of frequencies. If all four arms of the bridge are equal in resistance (usually 50 Ω), a zero voltage is measured and the bridge is balanced. If the test port load is not 50 Ω, the voltage across the bridge is proportional to the mismatch by MUT. The magnitude and phase angle of the voltage gives the complex impedance at the test port.
Receiver/detector section
magnitude and phase information of the signal is extracted by an analog-to-digital converter (ADC) digital signal processing (DSP). Tuned receivers provide the best sensitivity and dynamic range. A tuned receiver can be used in both scalar and vector network analyzers.
Processor/display section
The processor displays the results from the reflection and transmission data obtained. This section has features such as linear and logarithmic sweeps, linear and log formats, polar plots, smith charts etc.
Overview of the HP 8753C network analyzer
The source produces a highly stable and accurate output signal by phase locking a YIG (Yttrium-iron-garnet) oscillator to a harmonic of the synthesized VCO (voltage controlled oscillator). The output is a CW or swept signal between 300 kHz and 3 GHz with a maximum leveled power of +20 dBm and minimum power of -5 dBm. The full frequency range of the source is produced in 11 subsweeps, 2 in low band (300 kHz to 16 MHz) and 9 in high band (16 MHz to 3 GHz). The high band frequencies are achieved by harmonic mixing with a different harmonic number for each subsweep. The low band frequencies are down-converted by fundamental mixing (Agilent Manual).
The three most popular methods for measuring dielectric properties are the open-ended coaxial probe, transmission line, and resonance cavity methods (Engelder and Buffler, 1991) and they are described in detail below.
2.3.3.3.2 Open-ended coaxial probe method
source section of the network analyzer sends a microwave signal down the probe. The signal is reflected from the interface formed by the probe-end and the MUT. The receiver section of the network analyzer detects the magnitude and phase shift of the reflected signal. A computer program in the processor section calculates the dielectric constant (ε0) and dielectric loss factor (ε00) from this data. The advantages of this method are -- measurement over a wide frequency range, easy to use as it needs no particular sample shape, and suitability to food products as the probe is water tight, easy to clean, and measures dielectric properties of both liquids and solids. Despite these advantages, the probe has limited accuracy when it is used to measure materials with low values of dielectric constant and dielectric loss factor (oils and fats). The sample should have a flat surface to have a direct contact between the probe and the sample.
Transmission line
Figure 5. Distributed line parameters of a two conductor transmission line
transmission line to a load, impedance of source and load (ZL) should match Zo. When the load impedance is equal to Zo, there is no reflected signal. When the transmission line is terminated in a short circuit, the magnitude of the reflected wave is equal to that of the incident wave and 180E out of phase with it. When the transmission line is terminated in open circuit, the reflected current wave is 180E out of phase with respect with the incident wave.
Transmission line parameters
The line parameters of a transmission line are resistance per unit length (R), inductance per unit length (L), conductance per unit length (G), and capacitance per unit length (C) (figure 5). The line parameters are distributed uniformly along the entire length of the transmission line as shown in figure 5. For each line, conductors are characterized by
LC ' µε and G C '
σ
ε (32)
d2V s
dz2 & γ 2
Vs ' 0
d2I s
dz2 & γ 2I
s ' 0
(33) For each line,
Propagation of an electromagnetic wave (EM) along transmission line
A coaxial transmission line probe connecting generator to the load has been shown in figure 6. When the inner conductor is made positive with respect to the outer conductor, Electric field (E) is radially outward from inner to outer conductor. Ampere’s law states that the magnetic field (H) encircles the current carrying conductors. Thus, the Poynting vector (E × H) is long the transmission line. Thus, transmission line can transmit power by propagating a transverse electromagnetic (TEM) wave along its length (Sadiku, 2001).
Transmission line equations
Voltage and current in the circuit of figure 6 can be calculated by applying Kirchoff’s law. Harmonic time dependence of voltage and current is considered. The equations for voltage (Vs) and current (Is) in the circuit are (Sadiku, 2001):
γ ' αc % jβc ' (R % jωL)(G % jωC) (34)
λ ' 2π
βc (35)
Zo ' (R % jωL)
(G % jωC) ' Ro % j Xo (36)
Figure 6. Coaxial line probe connecting the generator to the load
where, αc is the attenuation constant (in nepers per meter or decibels per meter) and βc is the phase constant (radians per meter).
The wavelength (λ) is related to βc by the following equation:
Zo ' L
C ' Ro (37)
Γ ' Vreflected
Vincident ' ρrpΦ '
ZL&ZO
ZL%ZO (38)
Return loss ' &20log(ρr) (39) where, Ro and Xo are the real and imaginary parts of Zo.
The propagation constant (γ) and the characteristic impedance (Zo) are important properties of transmission line because they depend on the line parameters R, L, G, and C and the frequency of operation. A transmission line is said to be lossless if the conductors (σc = 4) are perfect and the dielectric medium separating them is lossless (σ = 0). For such a line R = G = 0 and equation (36) becomes:
Voltage reflection coefficient (Γ) is the ratio of the reflected signal voltage to the incident signal voltage and is given as:
where, ρr is the magnitude portion of the reflection coefficient. The range for possible values of ρr is between 0 to 1.