Search for the process e
+e
−→
D
∗(2007) with the CMD-3
de-tector
D. N. Shemyakin1,2,∗, R. R. Akhmetshin1,2, A. N. Amirkhanov1,2, A. V. Anisenkov1,2, V. M. Aulchenko1,2, V. Sh. Banzarov1, N. S. Bashtovoy1, D. E. Berkaev1,2, A. E. Bondar1,2, A. V. Bragin1, S. I. Eidelman1,2,5, D. A. Epifanov1,2, L. B. Epshteyn1,2,3, A. L. Erofeev1,2, G. V. Fedotovich1,2, S. E. Gayazov1,2, A. A. Grebenuk1,2, S. S. Gribanov1,2, D. N. Grigoriev1,2,3, F. V. Ignatov1,2, V. L. Ivanov1,2, S. V. Karpov1, A. S. Kasaev1, V. F. Kazanin1,2, I. A. Koop1,2, A. A. Korobov1,2, A. N. Kozyrev1,3, E. A. Kozyrev1,2, P. P. Krokovny1,2, A. E. Kuzmenko1,2, A. S. Kuzmin1,2, I. B. Logashenko1,2, A. P. Lysenko1, P. A. Lukin1,2, K. Yu. Mikhailov1, V. S. Okhapkin1, A. V. Otboev1, E. A. Perevedentsev1,2, Yu. N. Pestov1, A. S. Popov1,2, G. P. Razuvaev1,2, A. A. Ruban1, N. M. Ryskulov1, A. E. Ryzhenenkov1,2, A. V. Semenov1,2, A. I. Senchenko1, Yu. M. Shatunov1, V. E. Shebalin1,2, B. A. Shwartz1,2, D. B. Shwartz1,2, A. L. Sibidanov1,4, E. P. Solodov1,2, V. M. Titov1, A. A. Talyshev1,2, S. S. Tolmachev1,2, A. I. Vorobiov1, and Yu. V. Yudin1,2
1Budker Institute of Nuclear Physics, SB RAS, Novosibirsk, 630090, Russia 2Novosibirsk State University, Novosibirsk, 630090, Russia
3Novosibirsk State Technical University, Novosibirsk, 630092, Russia 4University of Victoria, Victoria, BC, Canada V8W 3P6
5Lebedev Physical Institute RAS, Moscow, 119333, Russia
Abstract. A search for the process e+e−→
D∗0(2007) has been performed
with the CMD-3 detector at the VEPP-2000e+e−
-collider. Two main decay modes of theD∗0(2007) decay,D0π0andD0γ, followed byD0→K+π−π+π−
are used in this analysis. With an integrated luminosity of 3.7 pb−1 collected at
the center-of-mass energy Ec.m.=2006.62 MeV our preliminary upper limit is
BD∗0→e+e−<1.6×10⁻⁶at 90%C.L.
1 Introduction
The processe+e−→D∗is a good probe for New Physics. Estimation of the lower limit on the branching fraction in Standard ModelB(D∗→e+e−)∼(0.1 – 5)×10−19gives a much smaller value than in some other models. For example, in model with Z – mediated gauge interaction the branching fraction isB(e+e− →D∗)<2.5×10⁻¹¹ [1]. The processe+e− →D∗has clear advantages with respect to the D0 →e+e−decay: the helicity suppression is absent, and a richer set of effective operators can be probed.
In this paper we report a search for the process e+e− → D∗, then D∗0 →
D0π0(BD∗0→D0π0=64.7±0.9%) andD∗0 → D0γ(BD∗0→D0γ=35.3±0.9%) decay chains [2]. We reconstructed D0 in the modeD0 → K+π−π+π−(BD0→K+π−π+π−=8.11±0.15%). Four particles with only one kaon in final state lead to low physical background.
2 CMD-3 detector and data set
The Cryogenic Magnetic Detector (CMD-3) described elsewhere [3] is installed in one of the two interaction regions of the VEPP-2000e+e−collider [4]. The detector tracking system consists of the cylindrical drift chamber (DC) and double-layer cylindrical multiwire propor-tional Z-chamber, both installed inside a thin (0.085X0) superconducting solenoid with 1.3 T magnetic field. DC contains 1218 hexagonal cells and provides a measurement of charged particle momentum and of the polar (θ) and azimuthal (φ) angles. An amplitude informa-tion from the DC wires is used to measure the ionizainforma-tion lossesdE/dxof charged particles withσdE/dx ≈11-14% accuracy for minimum ionizing particles. A barrel electromagnetic
calorimeter placed outside the solenoid consists of two subsystems: an inner liquid xenon (LXe) calorimeter (5.4X0thick) surrounded by a scintillation CsI crystal calorimeter (8.1X0 thick). BGO crystals with 13.4X0are used as an endcap calorimeter. The detector has two triggers: neutral and charged. A signal for neutral one is generated by the information from calorimeters, while the charged trigger comes from the tracking system. The return yoke of the detector is surrounded by scintillation counters which serve as a veto for cosmic events.
To obtain a detection efficiency, Monte Carlo (MC) simulation of the detector based on the GEANT4 [5] package has been developed. Simulated events are subject to the same reconstruction and selection procedures as the data. MC simulation includes photon jet radi-ation by initial electrons calculated according to Refs. [6]. Background was estimated using the multihadronic Monte Carlo generator MHG2000 [7].
The search is based on the 3.7 pb−1 of an integrated luminosity collected with the CMD-3 detector at the center-of-mass (c.m.) energy close to the nominal D∗0(2007) mass:
mD∗0 =2006.85±0.05 MeV/c2[2]. During the whole period of data taking the collider beam energy was continuously monitored using the Back-Scattering-Laser-Light system[8, 9]. The average value of the c.m. energy is Eav.
c.m.=2006.632±0.008 MeV and the beam energy spread of the VEPP-2000 collider isσEc.m. =0.954±0.053 MeV.
3 K/
π
separation
To perform kaon/pion separation, we use the probability density functions (PDF)
fK/π(p,dE/dxDC) for charged K/πwith the momentum p to produce the energy losses dE/dx in the DC. The parameters of PDF are determined by approximating thedE/dxDC versus momentum distribution. First we use a sample ofe+e− → π+π−π+π− events to determine
fπ(p,dE/dxDC), then the function fK(p,dE/dxDC) is determined usinge+e− → K+K−π+π− events. This procedure is performed separately for simulation and experiment.
The log-likelihood function (LLF) for the hypothesis that for i=(1,2,..,Ntracks) the particle
with the momentum pi and energy losses (dE/dx)i is the particle of αi type (αi=K orπ) is
defined as:
LKπππ=log
Qfi
α(p,dE/dxDC) Q[fi
π(p,dE/dxDC)+fKi(p,dE/dxDC)] !
.
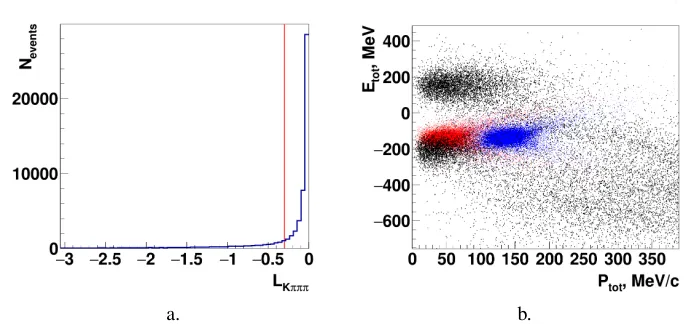
We search for the combination of (α1,α2,α3,α4), for which LLF is maximum and assume that there are one kaon and three pions in an event (LKπππ). Figure 1(a) shows the LKπππvalue
for four-track events from simulation ofD∗0→D0π0.
4 Event Selection
a. b.
Figure 1.a.) Etotvs Ptot. Black points correspond to experimental data, red points –D∗0→D0π0
sim-ulation, blue points –D∗0→D0γ simulation. b.) L
Kπππvalue forD∗0→D0π0 simulation.
P4
i=1 q
p2
i +m2π−2Ebeam. The distribution of Etotvs Ptot(total momentum of four particles) is
presented in Fig. 1(b). Black points correspond to experimental data, red points – simulation of the processD∗0 → D0π0, blue points – simulation of the processD∗0 → D0γ. Selection criteria are:
D∗0→D0π0
• |Etot-141.6|<40 MeV
• |Ptot-46|<50 MeV/c
D∗0→D0γ
• |Etot-136.6|<40 MeV
• |Ptot-138.6|<50 MeV/c
The detector efficiency after imposing conditions on energy and momentum is about 25% and is mainly determined by the acceptance of the drift chamber.
According to simulation with the multihadronic generator MHG2000 [7], the main background processes are e+e− → π+π−π+π−, K+K−π+π−, π+π−π+π−π0, π+π−π+π−π0π0, π+π−π+π−π+π−, K0
SK
±π∓, K0
SK
±π∓π0. To suppress physical background with K
S we use
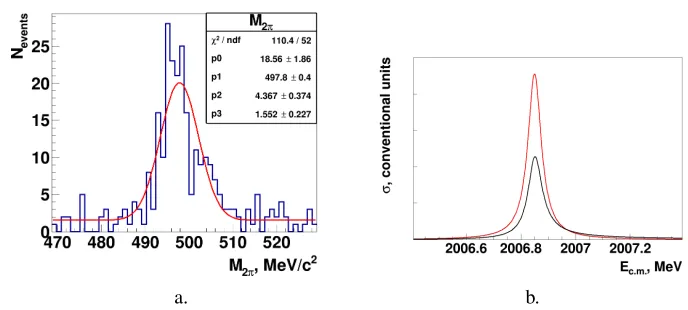
a condition on the invariant mass of two pions:|Mπ+π−−498|>15 MeV/c2. The distribution of Mπ+π−forK0
SK
±π∓andK0
SK
±π∓π0events is presented in Fig. 2(a). The last condition reduces the efficiency by∼3%.
We also use a condition on LLF for physical background suppression:
• LKπππ>-0.3 (all background events, this condition is presented in Fig. 1(a) as a red line.)
• LKKππ<-3 (K+K−π+π−events)
• Lππππ<-3 (π+π−π+π−events)
a. b.
Figure 2. a.) Mπ+π− forK0
SK
±π∓
andK0
SK
±π∓π0 events b.) The red line — cross section ofe+e−→
D∗0 →D0π0 in a standard resonance form, the black line — cross section convolved with the radiator
function.
5 Upper limit calculation
The cross section ofe+e−→D∗0→D0π0can be written in a standard resonance form:
σ(E)= 12π
m2
D∗
BD∗→e+e−BD∗0→D0π0
m2
D∗Γ2D∗ (m2
D∗−E2)2+E2Γ2D∗
, (1)
One can calculate the actual value of theD∗0width from the measured total width of the chargedD∗+meson:Γ
D∗0=60 keV [1].
The integrated production cross section is calculated using the energy spread σEc.m. and
the radiator function F(x,E) [6, 10]:
σint= Z Ebeam
0
dE
Z 1
0 1 √
2πσEc.m. e
−(Eavc.m..−E)2 2σ2
Ec.m. ·F(x,E)·σ(E(1−x))dx, (2)
The comparison of cross section of the processe+e−→D∗0 → D0π0in a standard reso-nance form (red line) and the cross section convolved with the radiator function (black line) is presented on figure 2(b). These radiative corrections decrease the number of signal events by approximately 40% and the ratio of the energy spread to theΓD0 decreases the number of signal events by approximately a factor of 30.
The final formula for the branching fraction is:
B= N
Lint·D∗0→f· BD∗0→f· BD0→K+π−π+π−·C
. (3)
where L=3701 nbn−1– integrated luminosity collected at the c.m. energy E
c.m.=2006.6 MeV,
D∗→D0π0=13.4% andD∗→D0γ =13.2% – efficiencies,C=62769 – calculated constant. For evaluating the number of background events the event selection procedure was per-formed for low energy points Ec.m.=1900-2000 MeV.
We got two candidates forD0γevents with the estimated background=1.2±0.5 and one
Acknowledgements
The authors are grateful to A. Khodjamirian, Th. Mannel and A. A. Petrov for useful discus-sions that motivated this work.
This study was partially supported by the grants of the Russian Foundation for Basic Research 17-02-00897-A and 17-02-00847-A. Development of the multihadron generator MHG2000 was supported by the Ministry of Science and Higher Education of Russian Fed-eration, Agreement 14.W03.31.0026.
REFERENCES
[1] A. Khodjamirian, Th. Mannel and A. A. Petrov, JHEP1511, 142 (2015). [2] M. Tanabashiet al.(Particle Data Group), Phys. Rev. D98, 030001 (2018). [3] B. I. Khazinet al., Nucl. Phys. B (Proc. Suppl.)376, 181 (2008).
[4] Yu. M. Shatunovet al., in Proceedings of the 7th European Particle Accelerator Confer-ence, Vienna, 2000, p. 439.
[5] S. Agostinelliet al.(GEANT4 Collaboration), Nucl. Instr. and Meth. A506, 250 (2003). [6] S. Actiset al., Eur. Phys. J. C66, 585 (2010).
[7] H. Czy˙zet al., arXiv:1312.0454.
[8] E. V. Abakumovaet al., Nucl. Instrum. Methods Phys. Res., Sect. A744, 35 (2014). [9] E. V. Abakumovaet. al., JINST10, T09001 (2015).