MCCULLEN, SETH DYLAN. Development, Characterization, and Function of Electrospun Nanocomposites for Tissue Engineering. (Under guidance of Dr. Russell E. Gorga and Dr. Elizabeth G. Loboa.)
by
Seth Dylan McCullen
A thesis submitted to the Graduate Faculty of North Carolina State University and University of North Carolina at Chapel Hill in partial fulfillment of the requirements
for the Degree of Master of Science
TEXTILE ENGINEERING BIOMEDICAL ENGINEERING
Raleigh, North Carolina 2006
Approved By:
_______________________________ ____________________________________ Dr. Russell E. Gorga, Co-Chair (TE) Dr. Elizabeth G. Loboa, Co-Chair (BME)
_______________________________________ Dr. Wendy E. Krause, Committee Member (TE)
This work has been developed and supported by many individuals. I would like to thank my committee for all of their ideas and acceptance of this project. I would like to thank Dr. Gorga for his energy, positive outlook, and being available to discuss research and other matters. I hope we remain friends throughout our careers. I would like to thank Dr. Loboa for her drive, ambition, and constant motivation throughout the project. I would like to thank Dr. Krause for her insightful knowledge and practical ideas on everything. I would like to thank Dr. Monteiro-Riviere for her analysis of transmission electron micrographs and meeting with me throughout my research. I would like to express my sincere thanks to Dr. Clarke and her entire research team for all of their assistance and their pivotal role of the conductance measurements for this work. I would like to thank Dr. Bernacki for teaching me tissue culture techniques and for all her work during this project. I would like to thank Mr. Al Inman for all his technical assistance with the transmission electron microscope. Finally, I would like to thank Dr. Rust, for his support and guidance from the transition from undergraduate to graduate and beyond.
List of Figures………..vii
Chapter 1... 1
Introduction... 1
1.1 General Introduction ... 1
1.2 Relevance... 6
1.3 Overall Objective ... 8
1.4 References... 9
Chapter 2... 11
Literature Review... 11
2.1 Introduction... 11
2.2 Nanocomposite Materials ... 11
2.3 Tissue Engineering... 15
2.31 Scaffold Fabrication... 21
2.32 Nanocomposite Scaffolds ... 23
2.33 Stem cells in Tissue Engineering... 25
2.4 Functional Tissue Engineering ... 26
2.5 References... 29
Chapter 3... 34
Research Objectives... 34
3.1 Research Objectives... 34
Chapter 4... 38
Morphological, electrical, and mechanical characterization of electrospun nanofiber mats containing multi-walled carbon nanotubes ... 38
4.1 Abstract ... 38
4.2 Introduction... 39
4.3 Experimental ... 42
4.4 Results and Discussion ... 47
4.5 Conclusions... 60
4.6 Acknowledgements... 61
4.7 References... 61
Chapter 5... 67
Development of electrospun poly (L-D-lactic acid) fibers containing multi-walled carbon nanotubes for tissue engineering scaffolds and optimization of fiber morphology... 67
5.2 Introduction... 68
5.3 Materials and Methods... 72
5.31. Fabrication ... 72
5.32 Materials ... 72
5.33 Characterization ... 73
5.33.1 Scanning Electron Microscopy ... 73
5.33.2 Transmission Electron Microscopy ... 73
5.33.3 Fourier Transform Infrared Spectroscopy ... 74
5.33.4 Statistical Analysis... 74
5.4 Results and Discussion ... 75
5.45 Effect of Solvent System ... 79
5.46 Effect of MWNT Addition... 80
5.5 Conclusions... 89
5.6 Acknowledgements... 90
5.7 References... 90
Chapter 6... 94
Electrospun conductive nanocomposites with adipose-derived human mesenchymal stem cells for tissue engineering applications ... 94
6.1 Abstract ... 94
6.1 Introduction... 95
6.3 Materials and Methods... 99
6.31 Materials ... 99
6.32 Electrospinning Solution Preparation ... 99
6.33 Electrospinning Apparatus... 100
6.34 Electrospun Scaffold Characterization ... 101
6.35 Human Mesenchymal Stem Cell Isolation and Expansion... 102
6.36 Cell Seeding ... 103
6.4 Results... 104
6.41 Scaffold Characterization... 104
6.42 Cell/Scaffold Interaction... 108
6.5 Discussion ... 112
6.51 Scaffold Characterization... 112
6.52 Human MSC/Scaffold Interaction ... 115
6.6 Conclusions... 116
6.7 Acknowledgements... 116
6.8 References... 117
Chapter 7... 121
Conclusions... 121
7.1 Conclusions... 121
Chapter 8... 122
Future Work ... 122
Table 1.1 Outline of the number of procedures per number of patients occurring per year for the United States……….………...…3 Table 4.1 Parameters for the three conductance models. *Gm was held at the conductance limit of our system. Gn, Gm, a' and c' are the conductance equivalents of the conductivity quantities given the text..………..………...………59
components………3 Figure 2.1 Image of a single-walled carbon nanotube and multi-walled carbon nanotube………...12 Figure 2.2 Twist structure of carbon nanotubes and the indicative conductive behavior………...13 Figure 2.3 Design Scheme I for soft tissue scaffold displaying the relationship between mechanical integrity and degradation………..18 Figure 2.4 Design Scheme II for hard tissue scaffold displaying the relationship between mechanical integrity and degradation...19 Figure 2.5 Diagram of electrospinning with labeled entities………...22 Figure 2.6 Picture of actual electrospinning setup………...23 Figure 2.7 Diagram of Yasuda’s Hypothesis depicting that applied electrical currents can produce an adaptive response in bone tissue...27 Figure 4.1 Schematic of the electrospinning apparatus used to produce the nanocomposite samples. Each component is labeled. ………...44 Figure 4.2 Flow curve plot of viscosity vs. shear rate for MWNT/PEO solutions……...48 Figure 4.3 : SEM of aligned and random nanofibers (1 wt % MWNT in 4 wt % PEO). Images were captured at 10,000X. The scale bar is 1 μm………..………50 Figure 4.4 a-f: SEM images of electrospun nanocomposites. 4.4a-b images of 3 wt% PEO, 4.4c-d images of 4 wt% PEO, 4.4e-f images of 4 wt% PEO with 1 wt% MWNT. By increasing the polymer concentration by 1%, we were able to produce uniform nanofibers. Images a, c, and e have scale bars of 1 μm, where images b, d, and f have scale bars of 100 nm………..………..51
conductance demonstrates a percolation threshold for the random mats. The three fits are
described in the text, with fit parameters presented in Table 1………...56
Figure 5.1a-c SEM Images of electrospun PLDLA at varying concentrations………...76
Figure 5.2a-c SEM images of electrospun 20 wt% PLDLA at varying voltages…...…...79
Figure 5.3a-b SEM images of electrospun 20 wt% PLDLA with different solvent systems………...80
Figure 5.4 SEM images of a) electrospun 20 wt% PLDLA and b) 1wt% MWNT/ 20% PLDLA...81
Figure 5.5 Distribution of fiber diameters for electrospun PLDLA...83
Figure 5.6 Distribution of fiber diameters for electrospun MWNT/PLDLA………...83
Figure 5.7 Bivariate plot of electrospun PLDLA fiber diameter by MWNT concentration………...84
Figure 5.8 TEM image of electrospun MWNT/PLDLA. The arrows indicate the MWNT………...86
Figure 5.9 Contour Plot for Electrospun PLDLA fiber diameters...87
Figure 5.10 Contour plot for Electrospun MWNT/PLDLA fiber diameters …………...88
Figure 5.11 Absorbance spectrum for PLDLA from FTIR………...89
Figure 5.12 Absorbance spectrum for PLDLA and the individual solvents (chloroform and DMF) from FTIR……….90
Figure 6.1 Labeled schematic of the electrospinning apparatus used to produce the nanocomposite samples………...101
Figure 6.2 SEM image of electrospun PLA, containing a) 1 wt% MWNTs and b) 0 wt% MWNTs.………105
Figure 6.3 TEM images of electrospun nanocomposite, a: showing MWNT alignment along fiber axis and b: showing MWNT aggregation………...106
Chapter 1
Introduction
1.1 General Introduction
Advances in the fields of medicine and engineering have awakened the need and desire to engineer human tissues, catalyzed by the demand for replacement organs. To date, there has not been an absolute success in the development of full-functioning organs created in vitro.
Hence, better solutions have been under development and are reaching a turning point in society by attracting awareness from all fields of science.
Tissue engineering is an emerging field with the goal of replacing diseased or malfunctioning tissues and organs. Therefore, scientists have been working in multi-disciplinary teams that are progressing toward solutions to regenerate organs outside of the human body, for transplantation into multiple recipients.
indicative that better solutions must be developed if society is to make significant advances in any one of these procedure types.
Table 1.1 : Outline of the number of procedures per number of patients occurring per
year for the United States.1
Procedure Indication or patients/yr
Skin Burns(*) 2,150,000 Pressure sores 1,500,000
Venous stasis ulcers
500,000
Diabetic ulcers
600,000
Neuromuscular disorder
200,000
Spinal cord and nerves
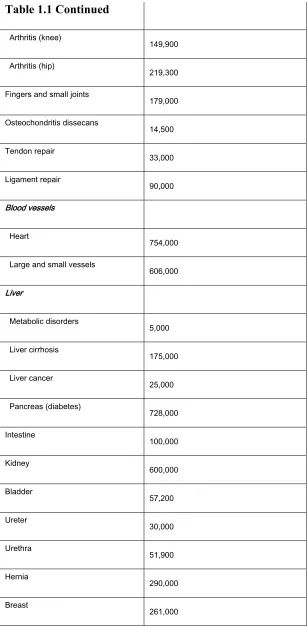
Table 1.1 Continued
Arthritis (knee)
149,900
Arthritis (hip)
219,300
Fingers and small joints
179,000 Osteochondritis dissecans 14,500 Tendon repair 33,000 Ligament repair 90,000 Blood vessels Heart 754,000
Large and small vessels
Table 1.1 Continued
Blood transfusion
18,000,000
Dental
10,000,000
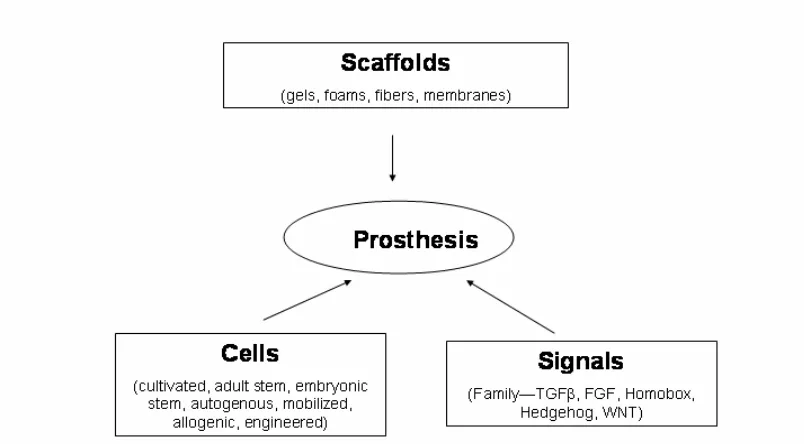
Tissue engineering is a unique and contemporary field where scientists are trying to recreate functional tissues and organs. Tissue engineering contains three entities: cells, growth hormones, and a scaffold as viewed schematically in Figure 1.1.
Figure 1.1 : Diagram of the tissue engineering method and the three required components.1
The main idea in tissue engineering is to seed a scaffold with a specific cell line and influence growth and development through application of specific signaling agents including hormones, proteins, growth media, and environmental stimuli. The research plan for these three entities can be classified into six main phases2:
II: Seeding of cell populations into the polymeric scaffold in a static culture dish III: Growth of premature tissue in a dynamic environment
IV: Growth of mature tissue in a physiologic environment V: Surgical transplantation
VI: Tissue-engineered transplant assimilation/remodeling
The scaffold is of high interest since it is the physical carrier that allows the arrangement of cells onto a construct and is where the cells are able to arrange into anatomically correct structures, where they can form functional units. The scaffold is the three-dimensional finite space that structurally supports the cells of interest and allows the cells to proliferate and differentiate by being able to undergo mass transfer. The scaffold must be able to degrade and be resorbed at a controlled rate at the same time as the specific tissue cells seeded into the three-dimensional construct attach, spread, and increase in quantity and quality. Selecting and designing the biomaterial for a scaffold is the most critical aspect of tissue engineering due to the material’s properties having the most profound effect on the success of the tissue engineering method by dictating biocompatibility.3
The following parameters have been identified as key factors in the production of tissue scaffolds to obtain the optimum properties necessary for tissue growth. These parameters include1:
• Biocompatibility: acceptance within the body without causing biofouling where the
• Biodegradability: ability to degrade in the body into compatible by-products without
causing inflammatory responses
• Mechanical integrity: ability to maintain the original structure and mechanical
properties upon exposure to the body’s environment, i.e. 37˚C, pH 7.4, saline solution
• High porosity: ability to allow the transfer of nutrients/oxygen and removal of wastes
via diffusion
• Bioactivity: ability to transform or conform depending upon the influence from the
internal milieu that surrounds the scaffold seeded with cells
1.2 Relevance
Osteogenicity refers to the use of mesenchymal stem cells which can either be recruited from the host bed or transplanted directly on the graft.5
For bone grafts, approximately 500,000 cases occur annually within the United States, and continue to be an increasing trend, due to the aging population of baby boomers and high impact lifestyles that many individuals live today.6 The gold standard for this is the autograft where 9 out of 10 surgeries performed use this option. There are many limitations and problems associated with autografts including limited supply and infection or pain at the donor site. This standard requires two surgical sites, the first site to remove the bone graft, and the second site to implant it. The medical industry has struggled with developing an alternative strategy for autografts. Current synthetic products for bone graft substitutes are based on old technologies that utilize inert and dead materials and do not allow for the material or product to be integrated successfully within the body, to form fully functional tissue.4
Current trends in tissue engineering have moved towards what is known as functional tissue engineering. Functional tissue engineering uses physical stimulation to direct cell populations to produce functional tissue with anatomically correct structures. This physical stimulation can range from electric-magnetic fields, mechanical forces, ultrasonic waves, and chemical stimuli.7-9 The purpose of this research is to design and fabricate an electrospun nanocomposite tissue scaffold to produce an enhanced conductive scaffold for the localization and delivery of an electric field to direct human mesenchymal stem cells into osteogenesis for bone formation. Bone produces electrical potentials when mechanically stressed, and this is thought to be an essential portion of cellular events in regenerative healing.10
1.3 Overall Objective
other treatment methods. This strategy will make use of a composite consisting of a polymeric matrix of poly (lactic acid) (PLA) reinforced with multi-walled carbon nanotubes (MWNT). By producing a conductive scaffold and utilizing functional tissue engineering scenarios, this work aims to direct human mesenchymal stem cells into the bone cell lineage. These topics will be discussed in detail in Chapter 2.
1.4 References
1. R. Lanza, R. Langerand J. Vacanti, Principles of Tissue Engineering, Academic
Press, Boston, 2000.
2. Hutmacher, Biomaterials, 21, 2529-2543 (2000).
3. V. Thomas, D. R. Deanand Y. K. Vohra, Current Nanoscience, 2, 155-177 (2006).
4. www.bonejointdecade.org
5. F. G. Lieberman Jay, Bone Regeneration and Repair: Biology and Clinical
Applications, Humana Press, Totowa, 2005.
6. C. Laurencin, Bone Graft Substitutes, ASTM International, Bridgeport, 2003.
7. M. Ochi, P. L. Wang, K. Ohura, S. Takashima, H. Kagami, Y. Hirose, T. Kakuand K. Sakaguchi, Clinical Oral Implants Research, 14, 294-302 (2003).
8. J. A. Spadoro, Bioelectromagnetics, 18, 193-202 (1997).
9. H. P. Wiesmann, M. Hartig, U. Stratmann, U. Meyerand U. Joos, Biochimica Et
Biophysica Acta-Molecular Cell Research, 1538, 28-37 (2001).
10. R. O. Becker, Clinical Orthopaedics and Related Research, 83, 255-262 (1972).
12. N. Alobaid, H. J. Salacinski, K. M. Sales, B. Ramesh, R. Y. Kannan, G. Hamiltonand A. M. Seifalian, European Journal Of Vascular And Endovascular Surgery, 32, 76-83
(2006).
13. X. F. Shi, J. L. Hudson, P. P. Spicer, J. M. Tour, R. Krishnamoortiand A. G. Mikos,
Biomacromolecules, 7, 2237-2242 (2006).
14. E. P. S. Tanand C. T. Lim, Composites Science And Technology, 66, 1102-1111
(2006).
15. R. Muruganand S. Ramakrishna, Composites Science And Technology, 65, 2385-2406
(2005).
16. Y. Z. Zhang, C. T. Lim, S. Ramakrishnaand Z. M. Huang, Journal Of Materials
Science-Materials In Medicine, 16, 933-946 (2005).
17. X. F. Shi, J. L. Hudson, P. P. Spicer, J. M. Tour, R. Krishnamoortiand A. G. Mikos,
Nanotechnology, 16, S531-S538 (2005).
18. M. Y. Li, M. J. Mondrinos, M. R. Gandhi, F. K. Ko, A. S. Weissand P. I. Lelkes,
Biomaterials, 26, 5999-6008 (2005).
19. M. El Frayand A. R. Boccaccini, Materials Letters, 59, 2300-2304 (2005).
20. V. M. Rusu, C. H. Ng, M. Wilke, B. Tiersch, P. Fratzland M. G. Peter, Biomaterials, 26, 5414-5426 (2005).
21. H. W. Kim, H. E. Kimand V. Salih, Biomaterials, 26, 5221-5230 (2005).
22. S. Kalamburand S. S. H. Rizvi, Journal Of Applied Polymer Science, 96, 1072-1082
(2005).
23. A. Tampieri, G. Celotti, E. Landi, M. Sandri, N. Roveriand G. Falini. in Euro
Chapter 2
Literature Review
2.1 Introduction
This chapter provides an indepth overview of a range of disciplines related to the fabrication of nanocomposite materials for functional tissue engineering scaffolds. In Section 2.2, a review of nanocomposite materials is discussed with emphasis on carbon nanotube composites. In Section 2.3 tissue engineering is discussed including development of nanocomposite scaffolds with an emphasis on carbon nanotube based scaffolds and the use of stem cell based therapies. In Section 2.4, a review on functional tissue engineering is discussed, highlighting electrical stimulation theory and application, including previous research that has demonstrated its usefulness in tissue engineering scenarios.
2.2 Nanocomposite Materials
Materials that have been researched extensively in nanocomposites are carbon nanotubes. Carbon nanotubes can be envisioned as sheets of sp2hybridized carbon atoms rolled into a tubular structure and capped with half a fullerene on each end. Carbon nanotubes were discovered by Iijima, a Japanese microscopist in 1991.10 Carbon nanotubes differ in morphology by the number of tubes or walls that are coaxial to one another, being divided into two categories, single-walled carbon nanotubes and multi-walled carbon nanotubes as seen in Figure 2.1.
Figure 2.1: Image of a single-walled carbon nanotube and multi-walled carbon
nanotube.
Figure 2.2: Twist structure of carbon nanotubes and the indicative conductive behavior.
Though carbon nanotubes have extraordinary physical properties, there has been a large variance in the report of the apparent properties due to their physical integration of the carbon nanotubes into the polymer matrices; specifically the dispersion and orientation of the carbon nanotubes. Due to their high surface area, carbon nanotubes tend to agglomerate and form aggregates by the interaction of the van der Waals forces between the nanotubes. To combat this, surfactants and physical stimulation can be used to break apart the aggregates and adequately disperse the tubes.19,20 Surfactants work by modifying the phase interfaces between two or more materials and creating a colloidal suspension by reducing the interfacial energy between the two materials and retarding phase separation by absorption of the surfactant at the surface of the matrials.21 Typically, this has been done with carbon nanotubes suspended in a solvent.
streamlines from the flow of solution and direction of the electric field, so that aligned carbon nanotubes are drafted into the electrospun jet and become oriented. Ko has investigated the fabrication of electrospun continuous carbon nanotubes-filled nanofibers through morphological and mechanical property analysis.7 However, that work showed much aggregation with single-walled carbon nanotubes, and resulting poor mechanical properties. This can be attributed to the aggregated carbon nanotubes acting as stress concentrators within the electrospun matrix. For this research, a main goal is to increase the conductivity of mats of nanofibers. Past work has investigated the influence of carbon nanotubes loading and resulting conductivity.25-29 In composite systems, increased conductivity is indicative of percolation of the conducting component. For carbon nanotubes their high conductivity renders them an ideal material for conducting composites. Previous investigations have been unable to determine a percolation threshold below 0.05 wt% carbon nanotubes in electrospun fibers.28 For carbon nanotubes conducting composites, the increase in conductance is attributed to a “hopping” of electrons from one conducting pathway to the next. By increasing the percentage of carbon nanotubes within a system, there is a greater likelihood that electrons will be able to continue on a conducting pathway and not terminate in the matrix of the composite. Chapter 4 will highlight the percolative behavior of carbon nanotubes in electrospun nanofiber mats.
2.3 Tissue Engineering
proliferate, differentiate, and maintain normal function. The scaffold itself is merely an imitation of the extracellular matrix (ECM) found within the body. The ECM is composed of proteoglycans and proteins that contain specific amino acid sequences. Proteins within the ECM are known as glycoproteins and have short chains of carbohydrate residues attached to them. Glycoproteins are amino acids covalently linked together containing both hydrophilic and hydrophobic groups. Glycoproteins have an N-terminus, where the chain ends with an amine group (NH2), and a C-terminus, where chain ends with an carboxylic acid group (COOH).30 The ECM participates in promoting cell adhesion, migration, growth, and differentiation.30 It provides a framework for how the cells interact with each other and the finite space that transforms and organizes the cells into three dimensional tissues and organs. The ECM is a fibrous structure and is organized in a three-dimensional fiber network composed primarily of collagen fibers that are formed hierarchically by nanometer-scale multi fibrils, thus the dimensions of the components of a tissue-engineered scaffold should be on the same scale with those of natural ECM. The size of the ECM is on the angstrom to micro level, and thus the scaffold should be able to resemble the size of the ECM on a similar scale. Currently, many researchers are using scaffolds that are assembled on the nano-scale. These will be discussed further in the scaffold fabrication section (2.3.1).31-33
of harmful reaction, then the body will reject the scaffold and cells will not proliferate on the scaffold. Also massive release of acidic degradation and resorption by-products results in inflammatory reactions which is a sign of rejection.34,35
One main issue for scaffold formation is the balance of temporary mechanical function with mass transport to aid biological delivery and tissue regeneration. Mechanical integrity and high porosity or permeability are two criteria that are the most difficult to achieve, in that the very nature of each requirement contradicts the other. In some research it is suggested that the ideal porosity of the scaffold should be in the range of 80-90% which could result in a faster degradation rate of the scaffold.36 Nutrient transport within the scaffold is of extreme importance and controls how the cells proliferate and differentiate. In general, tissues in vivo
have access to vasculature that provides most of the nutrients essential for cells to functions. However, since a blood supply does not exist in vitro, the scaffold must be designed and
scaffold is mainly a function of diffusion which encompasses oxygen delivery, waste removal, nutrient arrival, protein transport, and cell migration. Figure 2.3 and 2.4 represent two different schemes that display two methods for the design of degradation of scaffolds within the body. The first scheme allows molecular weight loss of the scaffold as early as the second week of implantation. This method does not offer mechanical integrity and overall strength to the tissue but does allow for adequate mass transfer, and accommodates the ingrowth of tissue into the scaffold by being engineered for mass loss to occur. Thus this type of scaffold would be designed for soft tissues which do not require the structural stability of structural tissues such as bone.
Figure 2.4 displays a more structurally inert scaffold that offers mechanical integrity in the timeframe of months compared to the week timescale of scheme 1 (Figure 2.3). When viewing the diagram the molecular weight loss starts to occur around month 3. The main mechanism for this is that scheme 2 (Figure 2.4) requires a more crystalline polymer in order to limit the amount of water that diffuses into the amorphous regions. It is in the amorphous regions that hydrolysis can take place. This process usually occurs in reduction in molecular weight in amorphous regions with little mass loss, further molecular weight decrease followed by mass loss, and finally total hydrolysis to soluble materials which is the degradation of the crystalline regions of the polymer scaffold.
Figures 2.4: Design Scheme II for hard tissue scaffold displaying the relationship
2.31 Scaffold Fabrication
The fabrication technique for the creation of the scaffold is also of prime importance for this work by understanding and developing processes that are able to reproduce what only nature has been able to achieve. These formation processes of polymers include particulate-leaching, casting of thin films, phase separation of polymer blends, CAD fabrication programs, and electrospinning. Particulate-leaching is a process where salt particles are finely ground and mixed with a polymer solution that is cast into a mold40. After evaporation of the solvent, the salt crystals are leached away using water to form pores of the scaffold. The pore size can be controlled by numerous parameters including the size of the salt crystals and the porosity of the salt/polymer ratio.40 Another fabrication method is phase separation where a homogenous multi-component system separates under thermodynamically unstable conditions and separates into different phases based on the order of free energy.37 Finally, casting of thin films can produce uneven thicknesses and CAD fabrication requires expensive industrial machinery for production.
the syringe needle to form a droplet, and the electric field overcomes the droplet’s surface tension.
Figure 2.5: Diagram of electrospinning with labeled entities.
area to volume ratio, improving diffusional properties. High porosity allows for adequate diffusion to and from the cells and provides ample space for cell growth, as well as sufficient surface area on the nanofibers for attachment and adhesion. This set-up for electrospinning is quite straightforward is a popular method for creating tissue scaffolds due to size of the fibers formed being on the nano scale.
Figure 2.6: Picture of actual electrospinning setup.
2.32 Nanocomposite Scaffolds
Recent studies have investigated the use of carbon nanotubes as scaffolds for tissue engineering in both neat systems and in conjunction with biocompatible polymers.29,45,46 Chen et. al was able to graft oligomers of poly (L-lactic acid) (PLLA) to the surface of the
MWNT; however, the grafting was not uniform and left much of the MWNT surface bare.45
interlukin-8 (IL-8).19,48 However, the carbon nanotubes were in solution and not incorporated into a nanocomposite configuration. For this study, carbon nanotubes will be incorporated into electrospun nanofibers with a biocompatible polymer acting as an interface between the seeded cells and the carbon nanotubes.
2.33 Stem cells in Tissue Engineering
stem cells were originally found in the bone marrow of guinea pigs by Friedenstein in 1970 and have a fibroblastic morphololgy.50 These cells were capable of differentiation into osteoblasts and adipose cells and to express smooth muscle actin. 50 Stem cells from adipose tissue have been shown to have similar differentiation potential. De Ugarte et al. has suggested that there is little difference between cells from marrow and fat in terms of yield, growth kinetics, multi-lineage differentiation capacity, and gene transduction efficiency.51
2.4 Functional Tissue Engineering
A major challenge of tissue engineering is directing the cells to establish physiological structure and function of the tissue across different hierarchical scales. Researchers tend to be moving more towards what is being labeled “functional tissue engineering” in which in
vivo interactions are being emulated in vitro. These interactions include electromagnetic
alone could stimulate the response. Bone produces electrical potentials when mechanical stressed, and this is thought to be essential component of cellular events in regenerative healing.
Figure 2.7: Diagram of Yasuda’s Hypothesis depicting that applied electrical currents
can produce an adaptive response in bone tissue.55
biocompatible polymer solutions. Electrospinning will afford a high degree of porosity as well as encapsulate the carbon nanotubes within polymeric nanofibers. By encapsulating the carbon nanotubes within the nanofibers, we will create a biocompatible interface, as well as a conductive tissue scaffold. These research objectives and the means for accomplishment will be discussed in detail in Chapter 3.
2.5 References
1. J. Ayutsede, M. Gandhi, S. Sukigara, H. H. Ye, C. M. Hsu, Y. Gogotsiand F. Ko,
Biomacromolecules, 7, 208-214 (2006).
2. W. E. Donderoand R. E. Gorga, Journal Of Polymer Science Part B-Polymer Physics, 44, 864-878 (2006).
3. Dror Yael, Salalha Wael, Khalfin Rafail, Cohen Yachin, Yarin Alexanderand Z. Eyal,
Langmuir, 19, 7012-7020 (2003).
4. M. El Frayand A. R. Boccaccini, Materials Letters, 59, 2300-2304 (2005).
5. R. E. Gorgaand R. E. Cohen, Journal Of Polymer Science Part B-Polymer Physics, 42, 2690-2702 (2004).
6. H. Hou, Chemical Materials, 967-973 (2005).
7. F. Ko, Y. Gogotsi, A. Ali, N. Naguib, H. H. Ye, G. L. Yang, C. Liand P. Willis,
Advanced Materials, 15, 1161-+ (2003).
8. J. J. Mack, L. M. Viculis, A. Ali, R. Luoh, G. L. Yang, H. T. Hahn, F. K. Koand R. B. Kaner, Advanced Materials, 17, 77-+ (2005).
9. V. Thomas, D. R. Deanand Y. K. Vohra, Current Nanoscience, 2, 155-177 (2006).
11. Phys. Rev. Lett., 79, 1297-1300 (1997).
12. Carbon, 33, 925-930 (1995).
13. Phys. Rev. Lett., 82 (1999).
14. C. Journetand e. al., Nature, 388(1997).
15. A. Thessand e. al., Science, 273(1996).
16. J. Kongand e. al., Chem. Phys. Lett., 292(1998).
17. J. Hafnerand e. al., Chem. Phys. Lett., 296(1998).
18. M. Suand e. al, Chem. Phys. Lett., 322 (2000).
19. N. Monteiro-Riviere, A. Inman, Y. Wangand R. Nemanich, Nanomedicine:
Nanotechnology, Biology, and Medicine 1, 293-299 (2005).
20. V. C. Moore, M. S. Strano, E. H. Haroz, R. H. Haugeand R. E. Smalley, Nano
Letters, 3, 1379-1382 (2003).
21. D. Myers, Surfactant Science and Technology, John Wiley & Sons, Inc., Hoboken,
New Jersey, 2006.
22. H. J. Gong, X. P. Yang, G. Q. Chen, T. Q. Liu, S. M. Zhang, X. L. Dengand X. Y.
Hu, Acta Polymerica Sinica, 297-300 (2005).
23. C. Li, C. Vepari, H.-J. Jin, H. J. Kimand D. Kaplan, Biomaterials, 27, 3115-3124
(2006).
24. I. D. Norris, M. M. Shaker, F. K. Koand A. G. MacDiarmid, Synthetic Metals, 114,
109-114 (2000).
25. M. Grujicic, G. Caoand W. N. Roy, Journal Of Materials Science, 39, 4441-4449
(2004).
27. J. Sandler, M. S. P. Shaffer, T. Prasse, W. Bauhofer, K. Schulteand A. H. Windle,
Polymer, 40, 5967-5971 (1999).
28. Sundaray Bibekananda, Subramanian V.and N. T.S., Applied Physics Letters, 88(2006).
29. D. Zhang, M. A. Kandadai, J. Cech, S. Rothand S. Curran, Journal of Physical
Chemistry B, 110, 12910-12915 (2006).
30. Yaszemski, Tissue Engineering and Novel Delivery Systems, Marcel Dekker, Inc.,
New York, 2004.
31. W. J. Li, R. Tuli, X. X. Huang, P. Laquerriereand R. S. Tuan, Biomaterials, 26,
5158-5166 (2005).
32. E. A. Minguell JJ, Conget P, Society for Experimental Biology and Medicine, 226,
507-520 (2001).
33. Venugopal, Nanotechnology, 16, 2138-2142 (2005).
34. Bergsma, Journal of Maxillofacial Surgery, 51, 666-670 (1993).
35. Bergsma, Biomaterials, 16, 25-31 (1995).
36. Karande, Annals of Biomedical Engineering, 32, 1728-1743 (2004).
37. R. Lanza, R. Langerand J. Vacanti, Principles of Tissue Engineering, Academic
Press, Boston, 2000.
38. Hutmacher, Biomaterials, 21, 2529-2543 (2000).
39. McCrum, Principles of Polymer Engineering, Oxford Science, Oxford, 1986.
40. Ma, Materials Today, 30-40 (2004).
41. E. D. Boland, G. L. Bowlin, D. G. Simpsonand G. E. Wnek, Abstracts Of Papers Of
42. E. D. Boland, J. A. Matthews, K. J. Pawlowski, D. G. Simpson, G. E. Wnekand G. L. Bowlin, Frontiers In Bioscience, 9, 1422-1432 (2004).
43. E. D. Boland, D. G. Simpson, G. E. Wnekand G. L. Bowlin, Abstracts Of Papers Of
The American Chemical Society, 226, U436-U436 (2003).
44. Li, Advanced Materials, 16(2004).
45. G.-X. Chen, H.-S. Kim, B. H. Parkand J.-S. Yoon, Journal of Physical Chemistry B, 109, 22237-22243 (2005).
46. R. A. MacDonald, B. F. Laurenzi, G. Viswanathan, P. M. Ajayanand J. P. Stegemann,
Journal Of Biomedical Materials Research Part A, 74A, 489-496 (2005).
47. S. K. Smart, A. I. Cassady, G. Q. Luand D. J. Martin, Carbon, 44, 1034-1047 (2006).
48. N. Monteiro-Riviere, Toxicology Letters, 155, 377-384 (2005).
49. A. Battlerand J. Leor, Stem Cell and Gene-Based Therapy, Springer, London, UK,
2006.
50. N. Habib, M. Gordon, N. Levicar, L. Jiaoand G. Thomas-Black, Stem Cell Repair and
Regeneration, Imperial College Press, London, UK, 2005.
51. D. A. De Ugarte, K. Morizono, A. Elbarbary, Z. Alfonso, P. A. Zuk, M. Zhu, J. L. Dragoo, P. Ashjiian, B. Thomas, P. Benhaim, I. Chen, J. Fraserand M. H. Hedrick, Cells
Tissues Organs, 173, 101-109 (2003).
52. R. O. Becker, Clinical Orthopaedics and Related Research, 83, 255-262 (1972).
53. R. B. Borgens, J. W. Vanable Jr.and L. F. Jaffe, Developmental Biology, 74,
4528-4532 (1977).
54. R. B. Borgens, J. W. Vanable Jr.and L. F. Jaffe, Journal of Exploratory Zoology, 200,
55. M. Hartig, U. Joosand H. P. Wiesmann, European Biophysics Journal With
Biophysics Letters, 29, 499-506 (2000).
56. M. Ochi, P. L. Wang, K. Ohura, S. Takashima, H. Kagami, Y. Hirose, T. Kakuand K. Sakaguchi, Clinical Oral Implants Research, 14, 294-302 (2003).
57. J. A. Spadoro, Bioelectromagnetics, 18, 193-202 (1997).
58. H. P. Wiesmann, M. Hartig, U. Stratmann, U. Meyerand U. Joos, Biochimica Et
Biophysica Acta-Molecular Cell Research, 1538, 28-37 (2001).
Chapter 3
Research Objectives
3.1 Research Objectives
Due to the overwhelming significance that has been placed on tissue engineering, it has become important to investigate new functional materials as scaffolds in tissue engineering scenarios. For this research, the focus will be on the fabrication of electrospun scaffolds with multi-walled carbon nanotubes, ascertaining the specific physical properties of interest, and investigating the interaction of human mesenchymal stem cells with the scaffold and the influence of electrical stimulation on human mesenchymal stem cells seeded on the scaffold. Specifically, the objectives of this research are as follows.
(1) Fabricate multi-walled carbon nanotube / polymer composites via electrospinning and as a function of multi-walled carbon nanotubes concentration. This will be accomplished by:
a. determining the rheological properties of the polymer solutions and the effect of multi-walled carbon nanotube addition
b. analyzing the electrospun nanocomposites via scanning and transmission electron microscopy to confirm proper fiber formation and multi-walled carbon nanotube integration into the as-spun fiber.
c. determining any improvements in mechanical properties and electrical conductivity via tensile testing and sensitive conductivity measurements, respectively.
a. analyzing the electrospun nanocomposites via scanning and transmission electrospun fibers to confirm proper fiber formation and multi-walled carbon nanotube integration into the as-spun fiber.
b. determining the ideal processing parameters for the electrospinning process including solution concentration, applied voltage (kV), working distance (cm), flow rate (mL/min), solvent system, and multi-walled carbon nanotubes addition using response surface methodology.
c. using tensile testing and sensitive conductivity measurements, for quantitating the physical properties of the scaffold.
(3) Determine the efficacy of the electrospun tissue scaffold and compare the addition of multi-walled carbon nanotubes with human mesenchymal stem cells. This will be accomplished by:
a. analyzing viability of the cells in vitro for fourteen days using a live / dead
fluorescence stain with fluorescence microscopy.
b. analyzing proliferation of the cells by quantifying the amount of DNA present at specific time-points (days 1, 3, 7, and 14) over the course of the experiment c. analyzing cellular orientation on the electrospun scaffolds via scanning
electron microscopy (days 1 and 14)
(4) Determine the use of the electrospun scaffold with multi-wall carbon nanotubes in a functional tissue engineering set-up incorporating electric field stimulation. This will be accomplished by:
b. analyzing cytokine expression of interleukin-1β, interleukin-6, interleukin-8, and TNF-α (days 1, 7, 14)
c. analyzing amount of calcium deposition via scanning electron microscopy using electron x-ray dispersive spectroscopy (day 21)
The first objective will focus on incorporation of multi-walled carbon nanotubes into electrospun nanofibrous mats and will be a staging ground for determining the electrical conductivity in these isotropic mats. This work will allow us to establish the optimal concentration of multi-walled carbon nanotubes for electrospun nanocomposites.
The second objective involves replicating the advancements in physical properties of electrospun fiberous mats in a biocompatible polymeric system. Response surface methodology will be utilized to establish the optimal processing parameters for the electrospinning process and investigate the physical properties of the electrospun mats using the indicated techniques.
The third objective allows for the implementation of the electrospun scaffold in a static cell culture environment with human mesenchymal stem cells. The efficacy of the electrospun scaffold will be elucidated as to what effect the multi-walled carbon nanotubes will have when in close proximity with the cells when compared to a control electrospun scaffold.
Chapter 4
Morphological, electrical, and mechanical characterization of electrospun nanofiber mats containing multi-walled carbon nanotubes
Seth D. McCullen1, Derrick R. Stevens2, Wesley A. Roberts3, Satyajeet S. Ojha4, Laura I. Clarke5, and Russell E. Gorga61
4.1 Abstract
This work focuses on the development of electrically-conducting porous nanocomposite structures by the incorporation of multiwalled carbon nanotubes (MWNT) into electrospun poly (ethylene oxide) (PEO) nanofibers. Electron microscopy confirmed the presence of individual aligned MWNT encapsulated within the fibers and showed fiber morphologies with diameters of 100-200 nm. Electrical conductance measurements of the random nanofiber mats showed that by increasing the concentration of MWNT, we were able to produce porous nanocomposite structures with dramatically improved electrical conductivity. Above a percolation threshold of 0.365 +/- 0.09 MWNT weight percent (wt%) in PEO the conductance increased by a factor of 1012 and then became approximately constant as the concentration of MWNT was further increased. Due to this percolation threshold, for a 1 wt% loading of MWNT, the conductivity is essentially maximized. Mechanical testing confirmed that the tensile strength did not change, and there was a three-fold increase in the Young’s modulus when comparing a 1 wt% MWNT loading to the pure electrospun PEO.
1Primary author and researcher, Department of Textile Engineering, Chemistry, and Science, NCSU 2Graduate student who assisted with conductance measurements, Department of Physics, NCSU 3Undergraduate student who assisted with conductance measurements, Department of Physics, NCSU
Thus the optimal MWNT concentration for PEO nanofiber mats with enhanced mechanical and electrical properties is approximately 1 wt%.
4.2 Introduction
the system with a goal of simultaneously optimizing the mechanical and electrical properties of random fibrous mats.
Carbon nanotubes are graphitic sheets rolled into seamless tubes (i.e., arrangements of
carbon hexagons into tube-like fullerenes) and have diameters ranging from about a nanometer to tens of nanometers with lengths up to centimeters. Nanotubes have received much attention due to their interesting properties (high modulus and electrical/thermal conductivity) since their discovery by Iijima in 1991.5, 6 Since then, significant effort has gone into fabricating polymer/nanotube composites for improved strength and conductivity. 7-22 In general, for improved mechanical properties, the interaction between the filler material
and polymeric matrix is the key to sustaining a compatible interface through the adhesive contact of the two materials.23, 24 When a conductive composite is desired, the most important parameter besides the apparent conductivity of the filler is the geometric shape; in particular, it is most advantageous to utilize fillers with an aspect ratio (length/diameter) greater than 1. Cylindrical materials such as carbon nanotubes exhibit this large aspect ratio, in the range of thousands, which alleviates the processing of the nanocomposite by assuring that only a low mass fraction is needed to obtain large increases in physical properties. Thus, carbon nanotubes are ideal candidates for nanocomposite applications and have demonstrated large increases in physical properties with relatively low mass fractions.
electrostatic repulsion and the coulombic forces due to an external electric field applied to a polymer solution.25, 26 By applying a critical voltage between the metallic needle of a syringe filled with polymer solution and a grounded collector, a polymer jet is generated which creates fibers that can be collected at the grounded plate.25, 27, 28 The end result is a randomly oriented mat of fibers with a high porosity due to the high ratio of surface area to volume. This aspect of electrospun fibers is advantageous for use as a means of production for nanocomposites by generating an intimate level of interaction between the matrix and the filler due to both being on similar size scales.
Previous work on fibrous nanocomposites has highlighted the need for adequate dispersion of the filler in the matrix for enhanced mechanical properties.4, 21, 22 Past research has shown that dispersion and orientation of the carbon nanotubes within a nanocomposite improves physical properties.4, 21, 22 However, most of this work has utilized traditional polymer processing techniques such as melt-blending and coagulation spinning to name a few.4 Dror et al. dispersed carbon nanotubes with the additive gum arabic to create a colloidal suspension of carbon nanotubes in solution prior to electrospinning and achieved a high level of carbon nanotube orientation within the nanofibers.29 Here we utilize the Dror technique to form nanofibers with ~100 nm diameters.
With respect to electrical properties of composite fibers, Sundaray was able to show an increase of ten orders of magnitude in conductivity between 0 weight percent (wt %) and 2 wt% carbon nanotube loading in single electrospun fiber.33 However, this work did not display evidence of a percolation threshold between 0.05-2 wt % and the authors hypothesized that, if present, the threshold was much lower than 0.05 wt%. Through this work, our aim is to produce electrospun nanocomposites containing varying mass fractions of carbon nanotubes, to determine if the conductance of the nonwoven mat (not the individual fiber) follows a percolation model, and to report the percolation threshold via thorough conductance measurements. Again, it is essential to quantify the properties of the random fibrous mat to determine how the material behaves in bulk.
All measurements in this work were conducted on samples consisting of random nanofiber mats produced from electrospinning. By utilizing planar interdigitated electrodes onto which the mat can be directly electrospun, we can measure these extremely porous mats in their native state without concern of pinhole defects which can occur in a "sandwich" electrode configuration. In summary, we propose to optimize the parameters for the electrospinning process of PEO/carbon nanotube solutions, to determine if the conductance exhibits percolative behavior, and to measure the tensile properties of electrospun fibrous mats.
4.3 Experimental
ammonia with an iron catalyst and grown on a mesoporous silica substrate.34 The MWNT used had a diameter of 15 +/- 5 nm and length of 5- 20 µm at 95% purity. The MWNT were dispersed using an Ultrasonic Model 2000U generator and probe operating at 25 Hz. Varying masses of MWNT were added to 50 mL deionized water and the dispersing agent gum arabic at a concentration of 3% and sonicated for one hour. The sonicated solutions of MWNT and PEO in deionized water were combined and mixed by stirring. The solution was inspected optically for up to 30 days. Solutions containing gum arabic exhibited homogenous suspensions through the 30 day period; whereas the nanotubes in solutions without gum arabic immediately fell out of suspension after sonication. The final solutions produced contained varying concentrations of MWNT from 0-3 wt % in 4 wt% PEO solution No further processing occurred before electrospinning.
Figure 4.1: Schematic of the electrospinning apparatus used to produce the
nanocomposite samples. Each component is labeled.
The fibers were collected on either a plate or a pair of aligned collector bars. The plate produced a random nonwoven array, whereas the collector bars produced oriented fibers along the same axis between the bars. The electrospun mats were deposited onto aluminum foil, which was placed over the collector plate. For scanning electron microscopy (SEM) and mechanical testing, the samples were removed from the collector. For transmission electron microscopy (TEM) and conductance testing, samples were deposited directly onto TEM grids and microelectrodes, respectively.
4.31 Electrospun Nanocomposite Characterization
For SEM, a JEOL JSM-6400 FE w/ EDS, operating at 5 kV, was used to determine fiber morphology of the electrospun samples. The electrospun samples were coated by a K-550X Sputter Coater with Au/Pd approximately 100 Å thick to reduce charging. Digital images were captured and analyzed using Scion ImageTM software. TEM was performed on a JEOL 100S with samples spun directly on a Cu 400 mesh grid coated with holey thin carbon film. Micrographs were developed, digitally scanned, and were not further modified.
interdigitated electrodes are known to penetrate into a film a distance roughly equivalent to the spacing between the digits. From the measured thickness of the mat as 1 - 3 μm, we
expect some response from the fringing fields.35 Consequently, the geometrical parameters needed to calculate the conductivity will be slightly altered. Furthermore, the extreme porosity of the nanocomposite mat makes a clear determination of the polymer density difficult. Thus, as a matter of convenience, we report conductance results only. A calibration to correct for the fringing fields is underway in our laboratory and will be reported in a future publication.
Mechanical properties were tested using an InstronModel 5544 using the BluehillTMVersion
1.00 software. Samples were prepared according to ASTM standard D4762-04. Each sample tested up to seven specimens with a sample width of 2 cm and a gauge length of 2.54 cm. The testing rate was approximately 25.4 cm/min. Samples were tested within 24 hours of fabrication.
4.4 Results and Discussion
1.00E+01 1.00E+02 1.00E+03
1.00E+00 1.00E+01 1.00E+02 1.00E+03 1.00E+04 Shear rate (1/s)
V
isc
osi
ty (cP)
0 wt% MWNT 0.25 wt% MWNT 1 wt% MWNT 2 wt% MWNT
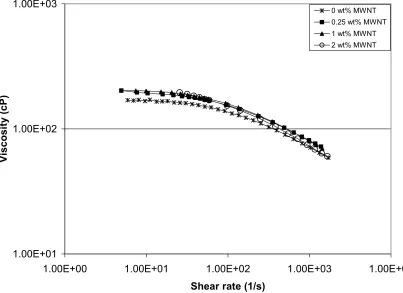
Figure 4.2: Flow curve plot of viscosity vs. shear rate for MWNT/PEO solutions.
The flow of material during electrospinning is determined using the equation Q = ΔP/R, where Q is the flow rate, ΔP is the pressure difference, and R is the resistance, equal to 8ηL/
πr4. For this equation L is the length of the capillary, r is the radius of the capillary, and η is the viscosity of the polymer solution. In order to determine the viscosity experienced during fiber formation, we can calculate the shear rate (Ψ) of our system with the following
below 20 s-1. When viewing the flow curve we can easily observe that no shear thinning is occuring at this range. The effects of interfacial bond strength, particle size, and shape distribution can be analyzed from the strain dependence of dispersions. For this system the particles in solution are the MWNT. When these particles are dispersed, each individual MWNT is separated from other MWNT and no aggregates are present. Smaller particles and stronger interfacial bonds will increase the low strain modulus of a dispersion with a given particle concentration. Forces acting on the particle in solution include gravity and random thermal (Brownian) fluctuations. In Figure 2, the viscosity plots for the different suspensions of MWNT in PEO show that the samples are within the same range, and that the MWNT do not significantly increase the viscosity of the solution. Thus, Figure 2 displays that the viscosity of PEO behaves similarly even with the addition of low mass fractions of MWNT. Also, the addition of MWNT does not change the shape of the flow curve for this polymer.
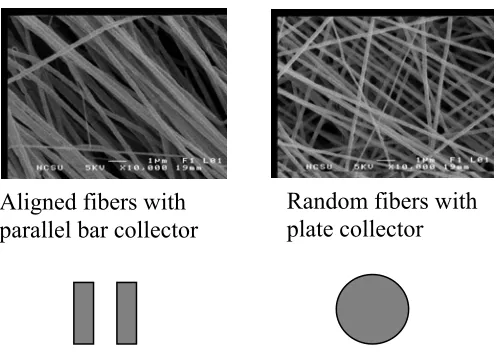
Aligned fibers with parallel bar collector
Random fibers with plate collector
Figure 4.3: SEM of aligned and random nanofibers (1 wt % MWNT in 4 wt % PEO).
Images were captured at 10,000X. The scale bar is 1 μm.
Figures 4.4a-f: SEM images of electrospun nanocomposites. 4.4a-b images of 3 w
PEO, 4.4c-d images of 4 wt% PEO, 4.4e-f images of 4 wt% PEO with 1 wt
c
e
d
b
f
t%
% MWNT.
did contain oriented MWNT, TEM was utilized view the alignment and orientation of MWNT within the nanofibers produced. The
By increasing the polymer concentration by 1%, we were able to produce uniform
nanofibers. Images a, c, and e have scale bars of 1 μm, where images b, d, and f have
scale bars of 100 nm.
In order to quantify that the produced fibers to
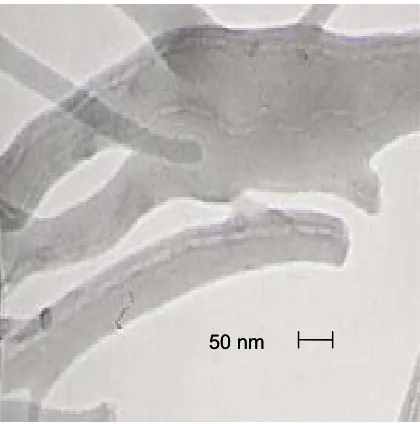
arrangement of the nanotubes within the fibers is able to influence the behavior of the composite when testing for conductivity and mechanical properties. If the MWNT have a high orientation within the fibers, then the apparent properties of the nanotubes should become superimposed within the electrospun fibers. Figure 4.5 confirms that the MWNT are aligned along the fiber axis via the flow and electric field direction. In some instances it can be seen that more than one MWNT was encapsulated within the produced nanofibers.
a
c
e
d
b
f
1 μm 1 μm
100
1 μm
a
When more than one MWNT was encapsulated, a misshaped (or branched) nanofiber was produced as shown in Figure 4.5b. However, these fibers show numerous MWNT all dispersed and oriented along the axis of numerous fibers bonded together. Bonding of the fibers could have taken place due to the solvent evaporating too slowly, connecting the fibers together.
50 nm 50 nm 50 nm
Figure 4.5a: TEM image of 2 wt % MWNT in 4 wt% PEO nanofibers showing
50 nm 50 nm 50 nm
Figure 4.5b: TEM image of 2 wt% MWNT in 4 wt% PEO sample. This image captures
four multi-walled carbon nanotubes within several nanofibers bonded together.
electrospun MWNT/PEO system.38-40 As shown above, the embedded nanotubes are generally aligned along the fiber axis, rather than being randomly oriented.41-45 In addition, because the polymer and nanotubes are innately entangled, it is unlikely that true percolating paths, where all MWNT along the path are in physical contact, are formed and more likely that tunneling or hopping between MWNT plays a role in conduction.38, 46, 47 Percolation theory has been extensively and successfully used to describe nanocomposite conductivity and, as shown below, our results also indicate a percolation effect.
carried predominantly along individual fibers. Here the percolation threshold of the mat might be similar to that of the fiber.
Thus rather than generating universal values for the critical doping of MWNT in PEO nanofibers, we expect that our results are specific to the degree of nanotube alignment, the interface between the polymer and nanotube, the fiber size, the morphology of the mat, and the contact between fibers therein. This research represents a specific example of a conducting mat and an attempt to begin understanding the relative importance of these morphological factors.
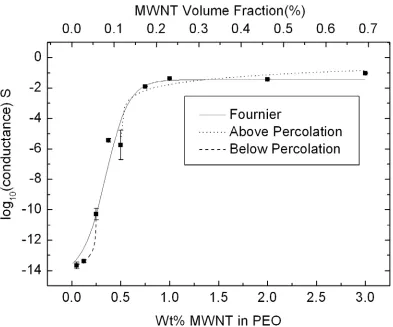
Figure 4.6: Electrical conductance vs. MWNT concentration in 4 wt% PEO or
alternatively, versus the measured volume fraction of MWNT. With increasing MWNT
concentration, the conductance demonstrates a percolation threshold for the random
mats. The three fits are described in the text, with fit parameters presented in Table 1.
lower limit of our measurement range. With the addition of MWNT to the PEO solution, the conductance versus MWNT concentration curve showed a dramatic increase consistent with a percolating behavior as seen in Figure 4.6. Figure 4.6 shows the conductance data plotted against two axes: the variable controlled in the experiment (the wt% of MWNT in the PEO solution) or alternatively, the experimentally observed volume fraction of MWNT. In the latter approach, the top layer of an SEM image of mats at 0 and 1 wt % MWNT was analyzed to determine the fraction of fiber and void space. Taking an average of four measurements for each image, the void space represented 74.79 +/- 2% and 74.85 +/- 2% for pure PEO and 1 wt% MWNT, respectively. Based upon these measurements, we conclude that the void space is constant over the nanotube doping range used in this work. Because the void and polymer are both insulating, the system is modeled as conducting MWNT embedded in this combined matrix. Based on the known doping, the fraction of MWNT to total volume is calculated. We observed that small variations in sample preparation, including dispersion of the MWNT in solution, can introduce significant changes in the resulting conductance. This can account for the 0.5 wt% sample having a slightly lower conductance than the 0.35 wt%. The placement of these points did not affect our overall results.
We characterize the conductance versus MWNT concentration curves with three alternative fits. Here we focus on the experimentally-controlled variable, the MWNT wt%; equivalent volume fraction values can be obtained by scaling according to Figure 6. The data is best represented by the Fournier model: log(σ)=log(σn)+ [log(σm)-log(σn)]/(1+exp[b(p-pc)]) which fits points above, below and throughout the percolation threshold region.52, 53 Here, σ,
σn and σm are the composite, nanotube and polymer conductivity, respectively. MWNT concentration is represented by p, with pc the critical weight percentage to obtain percolation. The empirical parameter b directs the change in conductance across the threshold.Data above the percolation threshold were also fit with σ=a(p-pc)tfrom classical percolation theory. Data
below the threshold can be fit with a similar functional form: σ=c(pc -p)-s.47 In these cases, a,
c, s, and t are fit parameters. Because conductance G ∝ σ , with a proportionality constant
that depends only on the geometry of the sample, pc, b, t and s should be unaffected by fitting conductance (rather than conductivity) data.
The fits and parameters can be seen in Figure 4.6 and Table 4.1. While the Fournier form yields the best fit to the data, all three fits give similar percolation thresholds of 0.35 +/- 0.04, 0.50 +/- 0.01, and 0.25 +/- 0.04 wt% MWNT, respectively. These values are higher than the percolation threshold of < 0.05 MWNT wt% observed for a single composite fiber of larger diameter (diameter 200 nm - 6μm) from poly-methylmethacrylate.33 We find an exponent
similar low exponents47, 54, 57-59 Nevertheless, the observation of an exponent with reduced dimensionality may reflect the influence of the fiber geometry on the percolation60; in particular polymer-blend systems where the dopant is constrained to the interface between the polymers have shown similar results.57, 61, 62 We find a value of s =1.39 +/- 0.7 which is greater than the expected value of ~0.7- 0.9 in 3-D and consistent with s = 1.3 in 2-D. 47, 61, 63 Finally, recent studies linked composite systems with t > 2 to tunneling between conductive elements due to an intermediate insulating layer (poor constant between doping elements).54, 64 Our value of t indicates no evidence of this effect.
Table 4.1: Parameters for the three conductance models. *Gm was held at the
conductance limit of our system. Gn, Gm, a' and c' are the conductance equivalents of
the conductivity quantities given the text.
Fournier Above Percolation Below Percolation
G
n0.036 ± 0.04 S
a'
0.043 ±0.02 S
c'
2.3e-15± 4e-15
S
G
m6.3e-15 S *
t
1.3 ± 0.6
s
1.4 ± 0.7
B
8.5 ± 1.8
p
c0.35 ± 0.04
p
c0.45 ± 0.01
p
c0.25± 0.04
accounts for the void volume fraction (75%), which was determined to be independent of MWNT concentration (as discussed earlier). With the addition of MWNT, both the 1 and 3 % samples demonstrated a statistically significant reduction in elongation. The 1 wt% MWNT/PEO sample maintained the same tensile stress yet had a statistically significant increase in modulus when compared to the pure PEO sample. However, the 3 wt% MWNT/PEO sample demonstrated a reduction in tensile stress with no change in modulus as compared to the pure PEO sample. This can be attributed to agglomeration of MWNT at the higher concentration, which could act as stress concentrations, leading to premature breaking.
Table 4.2: Modulus and tensile strength as a function of nanotube concentration.
Sample Modulus (MPa) Tensile Strength (MPa) 0%
MWNT 12.28 ± 1.54 9.96 ± .20 1%
MWNT 37.68 ± 2.14 9.40 ± 0.36 3%
MWNT 23.56 ± 1.67 5.04 ± 0.25
4.5 Conclusions
was required for the formation of uniform diameter fibers. Conductance measurements on random mats showed a percolation threshold at ~ 0.35 wt% MWNT, depending on the model used for fitting. Above, about 1 wt%, the conductivity was maximized. Mechanical testing of the random mats showed an optimal Young's modulus also at the value of 1 wt % MWNT, indicating that this loading value is optimal for maximizing both mechanical and electrical properties.
4.6 Acknowledgements
This work was funded by the Nanotechnology Initiative at NC State University. W.A.R. acknowledges an Undergraduate Research Award from NC State. We especially thank Alfred Inman and Dr. Nancy Monteiro-Riviere for their time and assistance with electron microscopy. We also thank Dr. Wendy Krause for use of her rheometer and Rebecca Klossner, and Kelly Stano for their technical assistance.
4.7 References
1. Andrews, R.; Weisenberger, M. C. Current Opinion in Solid State and Materials
Science 2004, 8, 31-37.
2. Harris, P. J. F. International Materials Review 2004, 49, (1), 31-43.
3. Hussain, F.; Hojjati, M.; Okamot, M.; Gorga, R. E. Journal of Composite Materials 2006, 40, (17), 1511-1575.
4. Moniruzzaman, M.; Winey, K. I. Macromolecules 2006, 39, (16), 5194-5205. 5. Iijima, S. Science 1991, 354, (6348), 56-58.
7. Schadler, L. S.; Giannaris, S. C.; Ajayan, P. M. Applied Physics Letters 1998, 73, (26), 3842-3844.
8. Haggenmueller, R.; Gommans, H. H.; Rinzler, A. G.; Fischer, J. E.; Winey, K. I.
Chem. Phys. Lett. 2000, 330, (3,4), 219-225.
9. Qian, D.; Dickey, E. C.; Andrews, R.; Rantell, T. Applied Physics Letters 2000, 76, (20), 2868-2870.
10. Lozano, K.; Bonilla-Rios, J.; Barrera, E. V. Journal of Applied Polymer Science 2001, 80, (8), 1162-1172.
11. Lozano, K.; Barrera, E. V. Journal of Applied Polymer Science 2000, 79, (1), 125-133.
12. Jin, L.; Bower, C.; Zhou, O. Applied Physics Letters 1998, 73, (9), 1197-1199. 13. Jia, Z.; Wang, Z.; Xu, C.; Liang, J.; We, B.; Wu, D.; Zhu, S. Materials Science and
Engineering A 1999, (271), 395-400.
14. Gong, X.; Liu, J.; Baskaran, S.; Voise, R. D.; Young, J. S. Chemistry Of Materials 2000, 12, (4), 1049-1052.
15. Jin, Z.; Pramoda, K. P.; Xu, G.; Goh, S. H. Chem. Phys. Lett. 2001, 337, (1), 43-47. 16. Safadi, B.; Andrews, R.; Grulke, E. A. Journal of Applied Polymer Science 2002, 84, (14), 2660-2669.
17. Kearns, J. C.; Shambaugh, R. L. Journal of Applied Polymer Science 2002, 86, (8), 2079-2084.
18. Cooper, C. A.; Ravich, D.; Lips, D.; Mayer, J.; Wagner, H. D. Composites Science
19. Bower, C.; Rosen, R.; Jin, L.; Han, J.; Zhou, O. Applied Physics Letters 1999, 74, (22), 3317-3319.
20. Pötschke, P.; Fornes, T. D.; Paul, D. R. Polymer 2002, 43, (11), 3247-3255.
21. Dondero, W. E.; Gorga, R. E. Journal Of Polymer Science Part B-Polymer Physics 2006, 44, (5), 864-878.
22. Gorga, R. E.; Cohen, R. E. Journal Of Polymer Science Part B-Polymer Physics 2004, 42, (14), 2690-2702.
23. Ponomarenko, A. T.; Shevchenko, V. G.; Enikolopyan, N. S. Advances in Polymer
Science 1990, 96, 125-145.
24. Hooper, J. B.; Schweizer, K. S. Macromolecules 2006, 39, (15), 5133-5142. 25. Formhals, A. Process and Apparatus for Preparing Artificial Threads, 1,975,504. 1934.
26. Li, D.; Xia, Y. Advanced Materials 2004, 16, (14), 1151-1170.
27. Matthews, J. A.; Boland, E. D.; Wnek, G. E.; Simpson, D. G.; Bowlin, G. L. Journal
Of Bioactive And Compatible Polymers 2003, 18, (2), 125-134.
28. Buttafoco, L.; Kolkman, N. G.; Poot, A. A.; Dijkstra, P. J.; Vermes, I.; Feijen, J.
Journal Of Controlled Release 2005, 101, (1-3), 322-324.
29. Dror, Y.; Salalha, W.; Khalfin, R. L.; Cohen, Y.; Yarin, A. L.; Zussman, E. Langmuir 2003, 19, 7012-7020.
30. Ayutsede, J.; Gandhi, M.; Sukigara, S.; Ye, H. H.; Hsu, C. M.; Gogotsi, Y.; Ko, F.
Biomacromolecules 2006, 7, (1), 208-214.
31. Ko, F.; Gogotsi, Y.; Ali, A.; Naguib, N.; Ye, H. H.; Yang, G. L.; Li, C.; Willis, P.
32. Mack, J. J.; Viculis, L. M.; Ali, A.; Luoh, R.; Yang, G. L.; Hahn, H. T.; Ko, F. K.; Kaner, R. B. Advanced Materials 2005, 17, (1), 77-80.
33. Sundaray, B.; Subramanian, V.; Natarajan, T. S.; Krishnamurthy, K. Applied Physics
Letters 2006, 88, (143114).
34. Ren, Z. F.; Huang, Z. P.; Xu, J. W.; Wang, J. K.; Bush, P.; Siegel, M. P.; Provencio,
P. Science 1998, 282, 1105-1107.
35. Van Gerwen, P.; Laureyn, W.; Laureys, W.; Huyberechts, G.; Op De Beeck, M.; Baert, K.; Suls, J.; Sansen, W.; Jacobs, P.; Hermans, L.; Mertens, R. Sensor Actuatorts B 1998, 49, 73-80.
36. Brydson, J., Flow Properties of Polymer Melts. 1st ed.; Van Nostrand Reinhold
Company: London, 1970.
37. Stauffer, D.; Aharony, A., Introduction to Percolation Theory. 2nd ed.; Taylor &
Francis: Washington DC, 1992.
38. Cheah, K.; Simon, G. P.; Forsyth, M. Polymer Int. 2001, 50, 27-36.
39. Mamunya, E. P.; Davidenko, V. V.; Lebedev, E. V. Polymer Composites 1995, 16, 319-324.
40. Rahatekar, S. S.; Hamm, M.; Shaffer, M. S. P.; Eliott, J. A. J. Chem. Phys. 2005, 123, 134702.
41. Balberg, I.; Binenbaum, N.; Wagner, N. Physical Review Letters 1984, 52, 1465-1468.
42. Du, F.; Fischer, J. E.; Winey, K. I. Phys. Rev. B 2005, 72, 121404(R).
44. Natsuki, T.; Endo, M.; Takahashi, T. Physica A 2005, 352, 498-508. 45. Ueda, N.; Taya, M. Journal of Applied Physics 1986, 60, 459-461.
46. Hobbie, E. K.; Obrzut, J.; Kharchenko, S. B.; Grulke, E. A. J. Chem. Phys. 2006, 125, 044712.
47. McLachlan, D. S. Journal of Electroceramics 2000, 5, (2), 93-110.
48. Cheah, K.; Forsyth, M.; Simon, G. P. J. Poly. Sci B: Poly. Phys. 2000, 38, 3106-3119. 49. Huang, J.-C. Advances in Polymer Technology 2002, 21, 299-313.
50. Thongruang, W.; Balik, C. M.; Spontak, R. J. J. Poly. Sci B: Poly. Phys. 2002, 40, 1013-1023.
51. Thongruang, W.; Spontak, R. J.; Balik, C. M. Polymer 2002, 43, 3717-3725.
52. Fournier, J.; Boiteux, G.; Seytre, G.; Marichy, G. Synthetic Metals 1997, 84, 839-840. 53. Coleman, J. N.; Curran, S.; Dalton, A. B.; Davey, A. P.; McCarthy, B.; Blau, W.; Barklie, R. C. Phys. Rev. B 1998, 58, (12), R7492-7495.
54. Vionnet-Menot, S.; Grimaldi, C.; Maeder, T.; Strässler, S.; Ryser, P. Phys. Rev. B 2005, 71, 064201.
55. Frank, D. J.; Lobb, C. J., Phys. Rev. B 1988, 37, 302-307. 56. Smith, L. N.; Lobb, C. J. Phys. Rev. B 1979, 20, 3653-3658.
57. Gubbels, F.; Jerómé, R.; Teyssié, P.; Vanlathem, E.; Deltour, R.; Calderone, A.; Parenta, V.; Brédas, J. L. Macromolecules 1994, 27, 1972-1974.
58. Kilbride, B. E.; Coleman, J. N.; Fraysse, J.; Fournet, P.; Cadek, M.; Drury, A.; Hutzler, S.; Roth, S.; Blau, W. J. J. Journal of Applied Physics 2002, 92, 4024-30.