Clay - Fly Ash Burnt Bricks - An Experimental
Study
Jayant L. Patil1, Dr. Arun Kumar Dwivedi2
Lecturer in Civil Engineering, MET Institute of Technology, Bhujbal Knowledge City,Adgaon, Nashik (MS), India, 422 0031
Principal, K.V.N.Naik Institute of Engineering Education & Research, Canda Corner, Nashik (MS), India, 422 0022
ABSTRACT: The fly ash for the purpose of experimentation was collected from the Thermal Power Station (Eklahre) in Nashik, Maharashtra. The mixtures of clay available at the site and the fly ash with different percentages by weight are prepared. These mixtures are used to make the bricks of clay and fly ash with different proportions. The bricks are marked with specific numbers in their frog to identify them at the time of testing. These bricks are air dried in open atmosphere for 4 - 5 days as per usual practice. The firing of the bricks is done in a traditional way as is done in and around Dhule town. These bricks are fired for fourteen days. At the end of the 14 days, the kiln is allowed to cool as per usual practice. The bricks are taken out from the kiln and stacked in the testing lab of the institute where the sample bricks are tested for water absorption, density and compressive strength as per BIS procedures. KEYWORDS: Burnt Clay Brick, Compressive Strength, Density, Fly Ash, Waste Management, Water Absorption
I. BACKGROUND
Energy efficiency through improved technologies and the use of fly ash can reduce fuel consumption and pollution levels. Fly ash entails a 30 per cent saving in fuel in firing as compared to traditional clay brick technology as well the improved technological options such as vertical shaft kilns, Habla kilns and tunnel kilns. An Austrian company, “Wienerberger Porotherm”, has noted about 60 per cent of energy saving compared to
conventional methods [Nirvan (2008)].At the same time
the use of fly-ash in bricks can minimize the problem of
disposal of this waste material to a large extent, in addition, to the saving of the fertile crest of the earth. The fly-ash can also be used in combination with clay or with lime and sand to produce clay-fly-ash bricks and fly-ash-sand-lime bricks respectively. The fly ash can be utilized to make bricks and blocks in one of several ways -
i. To substitute for a portion of the cement and/or
aggregates in making concrete bricks and blocks. This is commonly used nowadays in many countries.
ii. To substitute a portion of the clay used in making clay bricks. This uses the same process for making clay bricks, which requires heating the bricks in kilns to more than 2,000oF, which consumes excessive fossil fuel and generates air pollutants and carbon dioxides due to the combustion of the fossil fuel.
iii. To substitute for all the clay used in making clay bricks, using the same process which requires burning fossil fuel to heat the kilns at over 2,000 oF. This uses the same process and has the same drawback of (ii) except that 100% fly ash is used in making bricks.
iv. Use 100% fly ash to make bricks without firing
in kilns. It implies “the 100% fly ash brick made without cement or any other binder, and without kiln firing or autoclave curing.” The curing method used for fly ash bricks uses much less energy than either kiln firing or autoclave curing. [Henry (2009)]
extraction of valuable materials. Amongst the many uses of FA, its use as a building material is particularly suitable because it is anticipated, that there would be a considerable shortfall in production of various building materials. According to a study, there is a huge short-fall in the production of bricks—to the tune of 25 billion bricks on an estimated demand of 100 billion bricks per year in India as of today [Mishra & Patel (2004)]. To tackle the problem and encourage the use of FA for making building materials, the Government of India has imposed restriction (Gazette notification of 14th September 1999, issued by the Ministry of Environment and Forests) on brick manufacturers to use at least 25% of FA on weight–to–weight basis if the brick kiln is located within a radius of 50 km from a coal or lignite based thermal power plant. [Goyal (2000)]
II. ENVIRONMENTAL IMPACT OF BRICK PRODUCTION
The construction sector uses up the earth's resources and contributes to its pollution. This is an increasing concern. Whilst other components of construction, also play a role, it is generally agreed that the production of building materials is the main culprit. Materials production, for instance, requires about 75% of the energy used in construction. In India, it is estimated that the brick industry produces 22% of the CO2 emissions of the
construction sector and requires about 27% of the energy used in building materials production [PA(2007)]. This is because the small and medium scale sectors are predominant and are generally more polluting than modern large-scale industry.
The strategy towards more sustainable construction leaving lesser carbon foot prints, is to promote the use of alternative, low-energy or renewable materials. A combination of factors, including urbanization, attitudes and inappropriate building standards are generating a rise in demand for conventional materials such as steel, bricks and cement, which do have a substantial negative environmental impact. This trend is hard to reverse and it is necessary to aim in mitigating this impact [Pandey and Agrawal (2002)].
The impact of brick-making on the environment is quite significant. “Low efficiency and high coal fuel consumption results in significant air pollution. In
addition to the emissions from the chimney, the work environment is also polluted. During the dry summer months, the wind carries a lot of dust particles from brick kilns. The consumption of coal in brick-making contributes to the greenhouse gases. In addition to air pollution, it also contributes to water pollution and degradation of soil quality due to top soil erosion [FAUP (2005)].
The production of conventional building materials impacts the environment in several ways. Poor quarry management generates lots of waste and leaves behind disused pits. Smoke and dust affects the health of workers and neighboring residents alike. The biggest impact is, however, usually caused by its energy use. Apart from the metal industry, the binders and heavy clay industries are the principal energy users. The production of bricks and lime is carried out by Small and Medium Scale Enterprise (SMEs). The production of bricks by SMEs in some developing nations like Bangladesh and Sri Lanka in South Asia often relies on fuel wood as its main source of energy. Wood consists of nearly 50% carbon; if burnt completely, one kg of wood releases around 1.8 kg CO2, the main greenhouse gas.
Moreover, each tree cut down for fuel reduces the "CO2
sink", the environment's capacity to absorb this gas from the air [PA (2007)]. The inefficient use of wood fuel by SMEs, thus contributes to the global environmental crisis. Energy efficiency, therefore, lies at the heart of the commercial viability and sustainability of SMEs. The challenges are therefore to improve the energy efficiency of brick production at the SME level and explore alternatives. [Bhattacharjee and Kandpal (2000)]
The brick industry which is vital to the housing industry forms a significant amount of the budget that goes into raw material. This apart, the industry employs a large number of people directly and indirectly. It is, therefore, necessary to bring in technology and awareness to harness the potential of this industry further, and decrease its contribution to pollution levels [Tutunlu and Umit (2001)].
III. MATERIALS & METHODS
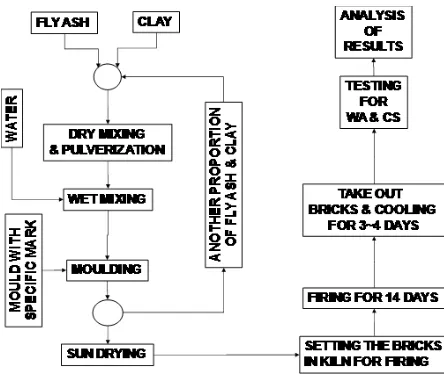
fly ash for this purpose is collected from Thermal Power Station (Eklahre) at Nashik, Maharashtra. The fly ash is mixed with the soil for making the brick, at a local kiln site. The mixtures of clay available at the site and the fly ash with different percentage by weight are prepared. These mixtures are mixed thoroughly by adding the appropriate amount of water and used to make the bricks of clay and fly ash with different proportions. The special wooden mould is prepared for this purpose, with a marking of SSVPS and the brick’s batch numbers varying from 0 – 15. The bricks with different % of fly ash are marked with specific numbers in their frog to identify them at the time of testing. These bricks are dried in an open atmosphere for 4 - 5 days and thereafter, fired in a separate open kiln. The firing of bricks is been done in a traditional way as is the manufacturing practice around Dhule. These bricks are fired for a total of fourteen days. At the end of 14 days, the kiln is allowed to cool for four days. The bricks are taken out from kiln and stacked in an open sky for six days and then brought to the testing laboratory of the Institute, where bricks are tested for water absorption and compressive strength as per BIS procedures [BIS-1077 (1982)]. The complete process is explained in Figure 1 in a flow chart.
Figure – 1 : Flowchart Showing Methodology
IV. EXPERIMENTATION Water Absorption Test
The water absorption test is carried out on the batches of bricks and the observations are taken. The % water absorption as calculated for different samples of bricks are shown in Table - 1. The dry density of the brick is calculated for the sample of bricks and the results are shown in Table – 2.
Table – 1 : “WATER ABSORPTION OF THE BRICKS”
MAR K
% OF FLY ASH ADDE D
WATER ABSORPTION (%)
SA-1
SA-2
SA-3
AVERAG E
0 0.00
14.0 4
16.2 1
16.1
4 15.463
1 15.00
14.2 3
15.9 8
15.8
4 15.348
2 20.00
12.9 8
16.5 5
12.7
4 14.090
3 25.00
13.8 5
16.3 6
15.9
7 15.394
4 30.00
19.2 3
17.5 4
16.8
3 17.865
5 35.00
17.6 1
19.7 7
19.6
7 19.015
6 40.00
16.7 9
16.6 8
16.3
6 16.607
7 45.00
17.4 5
17.9 4
17.6
6 17.684
8 50.00
21.0 2
20.5 0
20.5
7 20.696
9 55.00
20.0 7
19.2 6
18.9
4 19.423
10 60.00
18.2 5
18.6 0
18.3
9 18.410
12 65.00
20.7 9
20.8 6
21.6
2 21.093
13 70.00
24.3 9
21.8 1
21.1
3 22.441
14 75.00
25.3 2
25.8 0
23.4
Table – 2 : “DENSITY OF THE BRICKS (DRY)”
MARK % OF
FLY ASH
DENSITY OF BRICK (DRY) (N/m3)
SAMPLE-1
SAMPLE-2
SAMPLE-3 AVERAGE
0 0.00 17146.49 16913.20 16755.39 16938.36
1 15.00 16673.05 16165.32 16474.08 16437.48
2 20.00 16467.21 15952.61 16398.60 16272.81
3 25.00 16261.37 16137.87 16206.48 16201.91
4 30.00 16192.76 16261.37 16076.12 16176.75
5 35.00 16055.53 16124.15 16055.53 16078.41
6 40.00 15986.92 16041.81 15719.33 15916.02
7 45.00 15774.22 15691.88 15643.85 15703.32
8 50.00 15438.01 15410.57 15369.40 15405.99
9 55.00 15300.79 15273.34 15156.70 15243.61
10 60.00 15156.70 15108.67 15074.36 15113.24
12 65.00 15081.22 15197.87 14998.89 15092.66
13 70.00 14889.11 15081.22 14985.17 14985.17
14 75.00 13859.91 13791.29 14168.67 13939.95
Compressive Strength Test –
The dimensions of all sample bricks are measured and the average dimension is taken for the calculation of the compressive strength. It is also observed that the dimensions within group itself are also different. However, for the purpose of the calculation of the compressive strength the following dimensions are taken as average dimension.
SIZE OF
BRICK Length Width Height
Plan Area (mm2) (mm) 215.00 95.00 70.00 20425.00 It is obvious from the observations that the clay – fly ash bricks with 45% fly ash content the strength is optimum. The compressive strength as calculated for different samples of bricks are shown in Table - 3.
Table – 3 : “Results of Compressive Strength Test”
M
A
R
K % OF
FLY ASH ADDED
COMPRESSIVE STRENGTH (N/mm2)
SA-1 SA-2 SA-3 SA-4 SA-5 AVERAGE
0 0.00 4.32 4.32 4.80 4.56 3.60 4.323
1 15.00 4.80 5.28 5.76 5.52 4.80 5.235
2 20.00 6.24 7.68 6.24 6.72 6.48 6.676
3 25.00 7.20 7.68 7.20 6.96 6.72 7.156
4 30.00 8.16 8.16 8.16 7.92 7.92 8.069
5 35.00 9.13 8.65 8.16 8.65 8.65 8.645
6 40.00 9.13 8.65 9.13 8.65 9.13 8.933
7 45.00 9.61 9.13 8.65 8.89 9.37 9.126
8 50.00 8.65 6.24 6.72 8.89 8.41 7.781
9 55.00 8.16 5.28 6.72 8.16 7.20 7.108
10 60.00 7.68 5.28 6.72 8.16 6.24 6.820
12 65.00 4.32 4.80 6.24 7.68 4.80 5.571
13 70.00 3.84 3.84 5.28 6.24 3.84 4.611
14 75.00 4.08 4.32 4.32 4.80 3.84 4.275
V. CONCLUSIONS Water Absorption
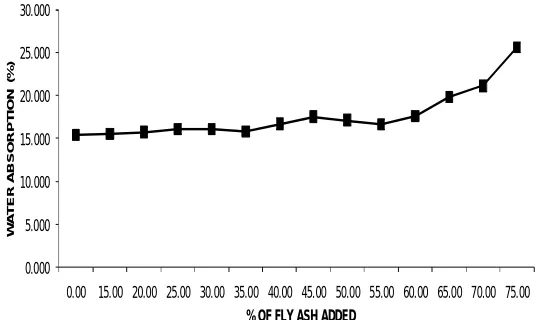
The water absorption % of the bricks increases with every increase in the fly ash % in the bricks. The variation is from 15.463 % at 0% fly ash to 25.545 % at 75% fly ash. The variations in water absorption % with fly ash addition are shown in Figure - 2.
Figure – 2 : “Variation in Water Absorption with Fly Ash”
0.000 5.000 10.000 15.000 20.000 25.000 30.000
0.00 15.00 20.00 25.00 30.00 35.00 40.00 45.00 50.00 55.00 60.00 65.00 70.00 75.00
W
A
T
E
R
A
B
S
O
R
P
T
IO
N
(
%
)
% OF FLY ASH ADDED
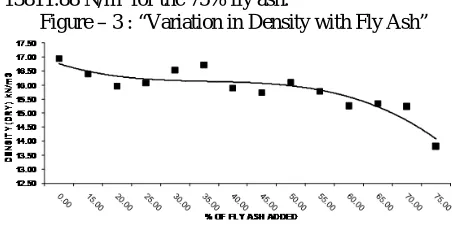
Dry Density
decreasing from 16938.36 N/m3 for 0% fly ash to 13811.88 N/m3 for the 75% fly ash.
Figure – 3 : “Variation in Density with Fly Ash”
Compressive Strength
The compressive strengths of the bricks increases with addition in fly ash % up to 40% to 50 % and there after starts decreases. The variation in compressive strength with the % increase of fly ash is shown in Figure – 4. The optimum compressive strength of the brick is 9.126 N/mm2 at 45% addition of fly ash with clay.
Figure – 3 : “Variation in Compressive Strength with Fly Ash”
Comments on Quality of Clay - Fly Ash Burnt Bricks The following are the properties of the fly ash – clay burnt bricks which are experimented –
Optimum % of fly ash addition :
45%
Water Absorption (at 45% Fly Ash) :
17.539 %
Compressive Strength (at 45% Fly Ash) :
9.126 N/mm2
Density (Dry) (at 45% Fly Ash) :
15703.32 N/m3
The bricks may be termed as class 7.5 as per BIS 1077 - 1982. As per BIS : 3492 – Part – 2 : 1992, the water absorption up to class 12.5 should be less than 20%. The bricks prepared confirm to this criterion too.
REFERENCES
[i] BIS-1077-1982, Indian Standard “Common Burnt Clay Bricks
Specifications – Fifth Revesion”, Bureau of Indian Standard, Manak Bhavan, 9, Bahadur Shah Zafar Marg, New Delhi, 110002, Second Reprint August 1996
[ii] Bhattacharjee Ujjwal & Kandpal Tara Chandra (2000), “Potential
of Fly Ash Utilization in India”, Energy, 27 (1) ;151-166.
[iii] Chou Mie-In (2002), “Fired Bricks from Fly Ash”, A Report Published by the Illinois State Geological Survey, a Division of the Illinois, Department of Natural Resources, 615 East Peabody Drive Champaign, IL 61820-6964, USA, 2002
[iv] Foner H.A., Thomas R.L., Hower J.C. and Graham U.M. (1999),
“Characterization of Fly Ash from Israel with Reference to its Possible Utilization”. Fuel, 78 (1) : 215-233.
[v] FAUP (2005), “Fly Ash Management in India : An Integrated,
Approach”, Fly Ash India 2005, International Congress, organized under Fly Ash Utilisation Programme (FAUP), Technology Information, Forecasting & Assessment Council, Department of Science & Technology, Government of India at New Delhi, India, December 2 – 5, 2005
[vi] Goyal Jagvir (2000), “Promoting Fly-ash Brick”, The Tribune
(Online Edition) Science Tribune, Thursday, Chandigarh, India, December 14, 2000.
[vii] Henry Liu (2009), “Use of Fly-ash to Make Bricks”, Freight Pipeline Company, United State of America, February 2009.
[viii] Hewat James M. (1996), “Approaches to the Conservation of Salt Deteriorated Brick”, A Thesis for the Post Graduate Program, Degree of Master of Science, University of Pennsylvania , 1996.
[ix] Mishra P. C. and Patel R. K. (2004), “Management of Fly Ash, in
the Context of its Growing Production”, Report of Research Project, Department of Chemistry, National Institute of Technology in Rourkela, India.
[x] Nirvan G. (2008), “It’s Time to Go in for Green Bricks now”,
PrachaR – Integrated Communications Consultant, The Hindu, On-line Edition, September 6th, 2008.
[xi] Okunade Emmanuel Akintunde (2008), “Engineering Properties of
Locally Manufactured Burnt Brick Pavers for Agrarian and Rural Earth Roads”, Graduate Thesis, Department of Civil Engineering,
University of Ado-Ekiti, Cengage Learning , Science
Publications.
[xii] Pandey Piyush Kant & Agrawal Raj Kumar (2002), “Utilization of Mixed Pond Ash in Integrated Steel Plant for Manufacturing Superior Quality Bricks”, Bulletin - Material Science, Indian Academy of Sciences, 25 (5) ; 443–447.
[xiii] PA (2007), Practical Action, “Sustainable Small-Scale Brick Production: A Question of Energy”, Technical Brief Note, The Schumacher Centre for Technology and Development Bourton-on-Dunsmore Rugby Warwickshire, CV23 9QZ, United Kingdom.