LIU, HONGYANG. Interaction Design of New Technology for Older Adults from the Ease of Learning Perspective (Under the direction of Dr. Sharon Joines).
In this dissertation research, three studies were conducted to understand older adults’ technology learning processes and evaluate learnability focused features (LFFs) tailored to older adults with different levels of technology experience.
In Study 1, eight focus groups were conducted among 40 older adults (aged 65 and over) with varied levels of technology experience. The focus group data provided insights into older adults’ learning experiences by identifying their learning barriers, learning method preferences, as well as the key aspects that effect older adults’ attitudes toward learning new technology.
In Study 2, six LFFs were evaluated by 17 older adults. During the evaluation, participants were asked to interact with LFFs on two mobile app prototypes. Data collection methods included task performance observations, questionnaires, and structured interviews. Results from the ratings of prototype learnability and older adults’ preferences in the six LFFs were discussed.
In Study 3, a total of 15 user interface and user experience (UI/UX) designers were recruited to evaluate six LFFs by using the cognitive walkthrough (CW) as an evaluation method. Four older adult personas were used as target users for the CW, including a first-time novice user, a first-time proficient user, a returning novice user, and a returning proficient user. LFFs were evaluated from the aspects of accessibility, ease-of-use, and usefulness.
by Hongyang Liu
A dissertation submitted to the Graduate Faculty of North Carolina State University
in partial fulfillment of the requirements for the degree of
Doctor of Philosophy
Design
Raleigh, North Carolina 2020
APPROVED BY:
_______________________________ _______________________________
Dr. Sharon Joines Dr. Russell Flinchum
Committee Chair
_______________________________ _______________________________
DEDICATION
Hi, Mom & Dad /wave and smile☺/
Hi, Bohan /♥ #mary&shan/
Hi, Sharon
BIOGRAPHY
Hongyang Liu is a doctoral candidate in the College of Design at North Carolina State University (NCSU) and works as a research assistant at Research in Ergonomics and Design (RED) Lab. She has experience in user experience research, human factors and ergonomics performance assessment, and interaction design. Before joining NCSU, Hongyang received her Bachelor of Engineering in Industrial Design from Beijing University of Technology in China and her Master of Science in Design from Arizona State University.
Hongyang is a researcher and designer. She has backgrounds in industrial design and cognitive science. Her current research focuses on investigating the relationship between
interface design and the learning processes of new technology among older adults. She combines cognitive psychology and user experience research techniques to develop design
ACKNOWLEDGMENTS
This dissertation would not be possible without the support and help from numerous people. First, I would like to thank my committee chair, Dr. Sharon Joines, for her guidance and patience. It was a long journey, but one that will not be forgotten. I could not have asked for a better advisor or role model. Next, I would like to thank my committee members. I thank Dr. Russell Flinchum for his enthusiasm for research and his belief in me. I thank Dr. Derek Ham for his wisdom and support. I thank Dr. Chris Mayhorn for his expertise in gerontology and valuable suggestions throughout the research design process.
I thank all the older adult participants for sharing their experiences and reflections with me. I am also grateful to all the designer participants who gave up their weekends and vacations to participate in the study. I also thank everyone who helped me with the participants’
recruitment. I thank them for their kindness in contributing their time and effort to these research studies, and their trust and belief in design research and design researchers.
My sincerest gratitude goes to my parents. (Mom & Dad, thank you so much for your endless love, support, understanding, encouragement, and patience. I am eternally grateful.) I thank my boyfriend, Bohan. (Bohan, you are my best friend and my partner in crime. And it was watching you work on your dissertation that gave me the strength to keep moving.) I also want to thank my two grandmas for their love and support.
TABLE OF CONTENTS
LIST OF TABLES ... viii
LIST OF FIGURES ... ix
Chapter 1: Introduction ... 1
Background ... 1
Research Focus and Scope ... 2
Research Objectives and Research Questions ... 5
Definitions of Key Terms ... 6
Research Paradigm... 7
Conceptual Framework ... 8
Research Design... 9
Study 1 – Exploration ... 9
Study 2 – Evaluation (by users) ... 10
Study 3 – Evaluation (by subject matter experts) ... 10
Overview of the Dissertation ... 10
Chapter 2: Literature Review ... 12
Older Adults and New Technology ... 12
Use of technology among older adults ... 12
Benefits of technology for older adults ... 12
Barriers and difficulties in learning new technology ... 13
Older Adults as Technology Users – User Characteristics ... 15
Physical abilities ... 15
Cognitive abilities ... 15
Technology experience ... 16
The Complexity of Learning: From Learning Theories to Learning Methods ... 19
Stages of learning ... 19
Learning theories: behaviorism vs. constructivism ... 20
Learning methods... 22
Interaction Design for Older Adults ... 22
Interaction design principles ... 22
Interaction design guidelines ... 23
Learnability of technologies ... 25
Summary of literature review ... 27
Chapter 3: Older Adults’ Experience with Learning New Technology ... 30
Introduction ... 31
Background ... 31
Related work ... 31
Study overview ... 33
Method ... 33
Screening test ... 33
Pilot tests ... 33
Focus groups ... 34
Data analysis ... 34
Results ... 35
Learning barriers ... 39
Learning methods... 40
Starting points ... 42
User needs ... 43
Discussion ... 43
Acknowledgment ... 47
References ... 48
Chapter 4: Interface Features, Product Learnability, and Older Adults ... 51
Introduction ... 52
Background ... 52
Older adults’ learning experiences... 52
Designing for learnability ... 52
Study Overview ... 53
Method ... 54
Participants ... 54
Materials ... 56
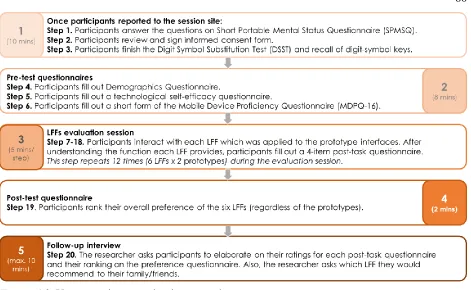
Procedures ... 59
Data analysis ... 60
Results ... 60
Learnability ratings within the prototype ... 60
Learnability ratings between two prototypes ... 64
Preferences ... 65
Follow-up interviews (recommending the LFF to others) ... 65
Discussion ... 66
Acknowledgment ... 70
References ... 71
Chapter 5: Design Professionals’ Assessment of Learnability Focused Features ... 73
Background ... 74
User Characteristics ... 74
Design for Older Adults ... 75
Cognitive Walkthrough ... 76
Learnability focused features (LFFs) ... 76
Participants ... 77
Materials ... 77
Procedures ... 79
Data Synthesis ... 81
Findings and Insights ... 85
Feature category 1: onboarding display ... 85
Feature category 2: action guidance ... 87
Feature category 3: customize settings ... 87
General insights ... 88
Limitations and Future Studies ... 89
References ... 90
Chapter 6: Conclusions ... 92
Summary of Findings across Three Studies... 92
Theoretical Contributions and Practical Contributions ... 96
Research Limitations and Future Studies ... 97
References ... 98
Appendices ... 108
Appendix A. IRB Approval Letter for Study 1 (Chapter 3) ... 109
Appendix B. Participant Characteristics in Study 1 (Chapter 3) ... 110
Appendix C. Focus Group Discussion Guideline for Study 1 (Chapter 3) ... 111
Appendix D. Segment and Coding Scheme in Study 1 (Chapter 3) ... 113
Appendix E. Distribution of Codes in Study 1 (Chapter 3) ... 116
Appendix F. Overview of All Categories and Themes in Study 1 (Chapter 3) ... 122
Appendix G. IRB Approval Letter (and renewal) for Study 2 (Chapter 4) ... 123
Appendix H. Reliability of the Questionnaires in Study 2 (Chapter 4) ... 125
Appendix I. Demographics Questionnaire for Study 2 (Chapter 4) ... 126
Appendix J. Technological Self-Efficacy Questionnaire for Study 2 (Chapter 4) ... 127
Appendix K. Post-Task Questionnaire for Study 2 (Chapter 4) ... 128
Appendix L. Learnability Focused Features (LFFs) in Study 2 (Chapter 4) ... 130
Appendix M. Prototypes in Study 2 (Chapter 4) ... 131
Appendix N. Structured Interview Script for Study 2 (Chapter 4) ... 133
Appendix O. Rating Results (between prototypes) in Study 2 (Chapter 4) ... 134
LIST OF TABLES
Table 2.1 Five Stages of Skill Acquisition ... 16
Table 2.2 Usability Heuristics for User Interface Design ... 23
Table 2.3 Designing for Older Adults: UI/UX Guidelines ... 24
Table 3.1 Frequency Counts of Positive Attitudes and Negative Attitude among Four Groups ... 36
Table 4.1 Participant Demographics and Technology Experience Profile (TEP) Scores ... 55
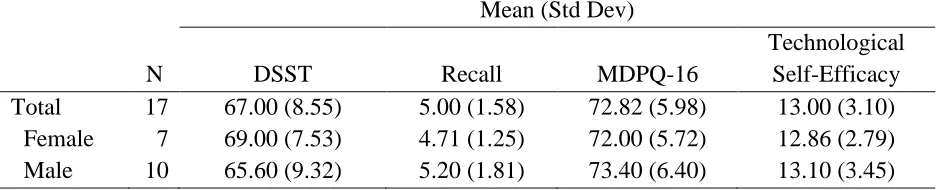
Table 4.2 Digit-Symbol Substitution Test (DSST) Sores, Recall Test Scores, Short form of the Mobile Device Proficiency Questionnaire (MDPQ-16) Sores, and Technological Self-Efficacy Sores ... 55
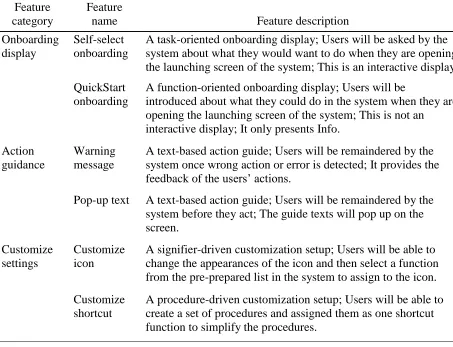
Table 4.3 Description of the Six LFFs ... 57
Table 4.4 Results from Post-Test Questionnaires in Prototype 1 (PF) ... 61
Table 4.5 Results from Post-Test Questionnaires in Prototype 2 (PB) ... 62
Table 4.6 Preference Rankings of the Six LFFs ... 65
Table 4.7 Counts of the “Most Preferred” and the “Least Preferred” ... 65
Table 4.8 Counts of “Recommending the LFF to others” ... 66
Table 5.1 Concept Description of the Six LFFs in CW Worksheet ... 78
LIST OF FIGURES
Figure 1.1 Conceptual framework of the dissertation research ... 8
Figure 2.1 Design strategies, UI/UX design elements, and the users’ learning process ... 28
Figure 3.1 Distribution of frequency counts of the themes in subcategories “positive attitudes” and “negative attitudes” ... 36
Figure 3.2 Distribution of frequency counts of the subthemes in subcategories “positive attitudes” and “negative attitudes” ... 37
Figure 3.3 Distribution of frequency counts for the subthemes “effort,” “memory,” and “time” under the positive attitudes in four technology experience groups ... 38
Figure 3.4 Distribution of frequency counts for the subthemes “effort,” “memory,” and “time” under the negative attitudes in four technology experience groups ... 38
Figure 3.5 Distribution of frequency counts for the subthemes “abilities,” “product characteristics,” and “instruction” in four technology experience groups. ... 40
Figure 3.6 Distribution of frequency counts for the subtheme “learning alone” in four technology experience groups ... 41
Figure 3.7 Distribution of frequency counts for the subthemes “learning from domain experts” and “learning from family/friends” in four technology experience groups ... 42
Figure 3.8 Distribution of frequency counts for the theme “starting points” in four technology experience groups ... 43
Figure 3.9 A synthesized older adults’ learning processes based on the findings from the focus group discussions ... 44
Figure 4.1 An overview of the concepts of the six LFFs ... 57
Figure 4.2 Screenshots of the user interfaces in the two prototypes ... 58
Figure 4.3 User experience evaluation procedures ... 60
Figure 4.4 An overview of the rating results in prototype 1 (PF) ... 63
Figure 4.5 An overview of the rating results in prototype 2 (PB) ... 63
Figure 5.1 Screenshots of the user interfaces in two prototyped systems ... 79
Figure 5.2 Steps in the scenarios of ordering food online (S1) and pairing a headphone (S2) ... 80
Figure 5.3 A user journey map for a 65 years old first-time novice user’s learning experience in pairing a headphone ... 82
Figure 5.4 Examples of the UI elements in two prototyped systems ... 83
Figure 5.5 LFFs identified by participants as meeting the criteria for older adult personas ... 85
CHAPTER 1 INTRODUCTION
“First we thought the PC was a calculator. Then we found out how to turn numbers into
letters with ASCII — and we thought it was a typewriter. Then we discovered graphics, and we thought it was a television. With the World Wide Web, we've realized it's a brochure.”
― Douglas Adams
Background
In current product design and user interface and user experience (UI/UX) fields, the concept of technology can be generally defined as any electronic device, digital service or digital system that has been designed and developed to serve particular functions. Today, with the development of new technologies, these technologies are prevalent in people’s everyday lives and mediate people’s behaviors, memories, social interactions, and more. The changes in technology, coupled with the changing capabilities of the people using technology, can lead to various interactions and outcomes (Richardson, Zorn, & Weaver, 2002). Those changes have a greater impact on the aging population than others, given the fact that most people in this
population have not had the opportunity to learn about and use technologies during their younger years.
potential benefit, lack of previous knowledge and experience, anxiety and negative attitudes toward technology, and low self-efficacy can all contribute to the barriers and difficulties of interacting with technology (Cotten, Yost, Berkowsky, Winstead, & Anderson, 2016; Kaye, Yeager, & Reed, 2008; Lee & Coughlin, 2015; Wang, Chen, & Chen, 2017).
However, proper attention to design could eliminate much of this frustration. Older adults could become interested in using and have a desire to learn to use technology if they see the relevance of it to their lives and appropriate learning methods are provided. The world
population is aging rapidly. In 2015, the proportion of the aging population reached 8.5% of the total population. This percentage is projected to jump to 17% (1.6 billion individuals) by 2050 (He, Goodkind, & Kowal, 2016, p3). The rapid increase in the number of older adults will be accompanied by a rapid pace of technology change. Therefore, when designing technologies for older adults (or when older adults are included as one of the user groups), it is important to consider the issues and difficulties that older adults could encounter, the methods they can use to overcome the barriers, and the ways to help older adults to keep up with the changing
technologies.
Research Focus and Scope
encountered when they were interacting with technologies and their experiences when they sought help in solving the problems. Interviews with family members and tech-class tutors explored the differences between teaching older adults in a casual environment (i.e., home) and a structured environment (i.e., tech-class). The observations focused on how older adults learned technology-related topics in tech-classes (e.g., how they took notes, what questions they asked).
Findings highlighted that many technologies use barriers actually occurred during learning. For example, older adults commented that just when they finally can find everything they needed in the system effortlessly, then all of a sudden, the system updated; and they had to accept the situation and start a new round of learning. Some older adults mentioned that when they interacted with a technology for the first time, they were afraid of breaking the device or messing up the default set-up. Furthermore, older adults reported increased frustration when they asked their family members (usually the younger generation) for help because the family
members would become impatient after their repetitive questions and finally give up saying “just Google it!”. One of the tech-class tutors, a 74-year old former computer sales representative, mentioned that he spent most of the time explaining each feature of the product before the class members even start to use the product. He commented that to build a good learning experience, he needed to clear up concerns or confusion about what would be expected if the setting of the feature was changed.
Continuously updated apps led to repetitive learning processes; the fear of messing up the settings created a big constraint for older adults limiting their learning opportunity. Adapting to a newer version or changing the setting were barriers due to the effort and mental workload
control and freedom. Technology with higher learnability can do so by minimizing the repetitive learning work or at least making the process easier.
When people are thinking about older adults, the common notion is that they are all alike, and most views are negative: older adults are slow; they are uninterested in new things; and they are technophobic. During the pilot study interview, the 74-year old tech-class tutor’s attitudes and views toward technology were all positive; he enjoyed learning new features, got excited about new products, and was very confident about his technology skills. So clearly, the common notion may be misleading. Older adults can be extremely diverse in many dimensions. In this case, the tutor’s previous technology experiences (i.e., a former computer sales representative) may have played an important role. When considering design for older adults, it is essential to focus on the similarities that allow the optimization of the design. However, individual
differences also need to be addressed in order to determine whom the design can and cannot accommodate.
Findings from the pilot study led to two focus areas within this dissertation research: 1) learnability of new technology; and 2) individual differences of older adults’ previous
technology experience and level of expertise.
The scope of this dissertation research was limited to 1) today’s older adults with varied levels of technology experience; 2) older adults of ages 65 and over in the United States; 3) older adults with intact intellectual function who live independently; 4) technologies that have simple functions and have interactive interfaces; 5) technologies that are intended to be used for daily living activities; and 6) investigation on learnability focused features (as defined in the
The following aspects are beyond the scope of this dissertation research: 1) older adults in other cultures and regions; 2) older adults who are experts with no barriers and difficulties in learning technology; 3) older adults who live in assisted living (e.g., memory care) communities; 4) complex technologies that have many functions and do not have interactive interfaces (e.g., smart speakers with a virtual assistant); 5) technologies heavily reliant on mechanical levers or electronic switches (e.g., a vehicle’s center fascia or dashboard); 6) technologies intended to be used with instructions and not for older adults’ daily activities (e.g., 3D printing); and 7) non-learnability focused features that could influence the learning experience (e.g., font size).
Research Objectives and Research Questions
When studying methods of improving the learnability of new technology, learning
experience is an important factor. Every time people adopt or adapt to a new technology either as new users or as returning users, the way they view themselves and the technology shifts a bit. Therefore, the experience also changes. To better understand the learning experience with new technologies among older adults, it is necessary to both learn about how learning processes build during the interaction between users and technologies as well as which learnability focused features will enhance older adults’ learning experiences.
The goal of this dissertation research was to connect cognitive psychology, user experience research techniques, and user-centered design to facilitate UI/UX designers’ understanding of older adults’ user characteristics. Therefore, the target audience of this dissertation research was UI/UX designers. The beneficiary audience was older adults with different technology experiences.
to compare the differences in the learning processes of new technologies among older adults with different technology experiences. The third objective of this research was to understand what types of learnability focused features can enhance the learning experience as well as the system’s learnability. The fourth objective of this research was to provide design recommendations for UI/UX designers by highlighting older adults’ learning experiences as well as considering individual differences among older adult users.
Research questions were developed in order to address the research objectives. The primary research questions of this research were as follows:
Research Question 1 [RQ1]: What are the differences in learning new technologies for older adults with different technology experiences?
Research Question 2 [RQ2]: What type(s) of learnability focused features can enhance the learning experience among older adults?
Research Question 3 [RQ3]: What design recommendations should be provided to UI/UX designers for the interaction design of new technologies for older adults?
Definitions of Key Terms
Interaction design: design of interactive products (or systems) in which designers focus on the dynamics between users and products for information input (from user to product) and output (from product to user).
User interface: elements of a product (or system) used to present information about the product’s status and allow users to control the product (or system) by activating the element, which enable users to interact with the product for its intended purpose (International
Technology experience: users’ knowledge or skill in using technology that they have gained from direct observation of technology use, or through participation in events or in an activity with the technology.
Learnability: the extent to which a product (or system) can be used in a specified context by users to achieve specified goals of learning to use the product (or system) effectively,
efficiently, with freedom from risk, and with satisfaction (ISO, 2011; ISO 2017).
Learnability focused feature: visual elements in a user interface that enable users with limited technology experience to learn to use a product (or system) in a specified context.
Research Paradigm
A researcher’s choice of a research design is framed by the researcher’s assumptions about both the nature of reality and how one can understand it (Groat & Wang, 2013, p. 63). Denzin and Lincoln (2011) used the term research paradigm to describe such assumptions. Groat and Wang (2013, p. 76) proposed a “three-part continuum” of research paradigms, which includes positivism/postpositivism, intersubjective, and constructivism. This dissertation research can be classified as constructivism1 in the continuum of research paradigms due to its objectives and the relationship of the researcher to the participants. Within past decades, several other terms, such as naturalistic, qualitative, and interpretive had been previously used
interchangeably to describe this approach to research (Groat & Wang, 2013, p. 78). The
knowledge generated under the constructivism paradigm requires the co-created understandings of the system or situation being studied between researcher and participant. This research valued
1 For the purposes of this dissertation, constructivism is defined as a research paradigm where the researcher would
the interactions between the researcher and the participants, which implies that the researcher played the role of a measurement device. In this dissertation research, the interaction design of new technology is viewed as a dynamic and multi-component system that involves users, activities, and environments. For example, an older adult uses a mobile app to order food at home. In a constructivism paradigm, in order to have a mobile app that supports a better
experience, the researcher needs to understand and consider the characteristics of the user (e.g., age), the activity (ordering food online), and the environment (home) by gaining perspectives from participants directly.
Conceptual Framework
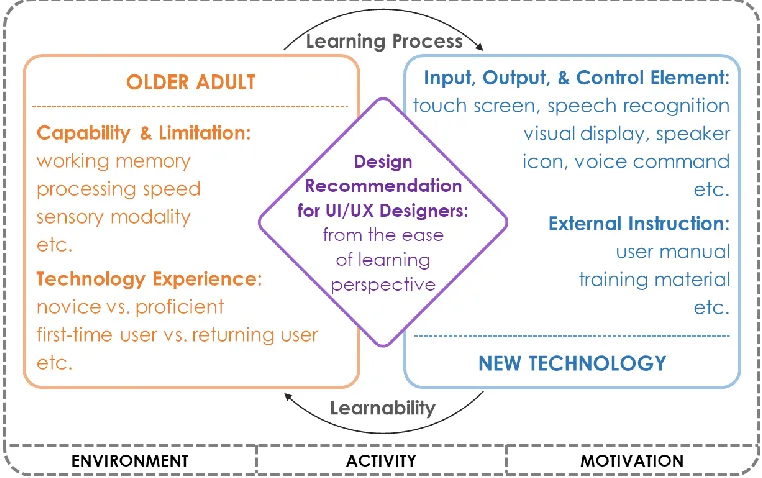
The interaction between older adults and new technologies is a dynamic system with multiple perspectives and components involved. The following conceptual framework (see Figure 1.1) described multiple perspectives and components during the interaction process.
From the perspective of user characteristics, age-related changes (e.g., working memory, processing speed) and users’ technology experiences (e.g., novice, proficient) may effect older adults’ uptake of new technologies. In contrast, from the perspective of new technology, design elements (e.g., voice command, icons) and external instructions (e.g., training materials, user manuals) can contribute to the learnability of new technology.
As a multi-component system, the interaction between older adults and new technologies involves a learning environment, an activity, and the individual’s motivation. When components are changed, older adults’ learning experiences can change as well. For example, to consider learning to use technology for video-chatting and online-banking, an older adult may use different learning methods and encounter different barriers when learning each technology.
The learning process includes methods that older adults used as well as the barriers they encountered and overcame when they interact with technologies. Learnability can be represented by the features that products (or systems) include to support an effective, efficient, risk-free, and satisfying user experience. By understanding the learning process and evaluating learnability focused features, design recommendations can be developed to improve the interaction design of new technology for older adults. The development of design recommendations was
accomplished through multiple studies over several years.
Research Design
Three studies were designed to answer the research questions [RQ1] – [RQ3]. In order to understand older adults’ learning experiences and create shared understandings with the target audience and beneficiary audience, mixed methods were used in this dissertation research.
adults’ learning experiences, learning barriers and difficulties, and preferred learning methods. Older adults with different levels of technology experience were recruited in this study.
Study 2 – Evaluation (by users). The purpose of Study 2 was to initially address [RQ2]. Informed by the findings from Study 1, prototypes with LFFs (as defined previously) were developed. Older adults evaluated six LFFs in two mock-up mobile apps during the prototypes testing sessions. Data collection methods included task performance observation, post-task questionnaire, and structured interview.
Study 3 – Evaluation (by subject matter experts). The purpose of Study 3 was to finish addressing [RQ2]. UI/UX designers inspected six LFFs during cognitive walkthrough sessions. The characteristics of LFFs was presented in the written format in the worksheet. LFFs were evaluated from the aspects of accessibility, ease-of-use, and usefulness.
The findings and insights combined from all three studies were used to answer [RQ3].
Overview of the Dissertation
CHAPTER 2 LITERATURE REVIEW Older Adults and New Technology
Use of technology among older adults. Use of today’s technologies borders on a
necessity for older adults. Technology usage among older adults is growing faster than any other age group (Cotten et al., 2016). For example, the use of Facebook has grown fastest among older generations (Vogels, 2019). As for smartphone ownership, 68% of Baby Boomers (adults aged 55-73 in 2019) and 40% of members of the Silent Generation (adults aged 74-91 in 2019) owned a smartphone (Vogels, 2019). For tablet ownership, 52% of Baby Boomers and 33% of the Silent Generation reported that they owned tablets (Vogels, 2019). Another study found that 54% of older adults were users of CD players (Selwyn, Gorard, Furlong, & Madden, 2003). Data from a poll found that 22% of older adults owned digital cameras (Gallup, 2007). It also found that 48% of older adults owned DVD players (Gallup, 2007).
Although the use of social media and digital devices among older adults is increasing, the use of technology by older adults is still lower than that of younger age groups to some extent. Older adults were much less likely than young adults to have high-speed Internet connections (Charness, Fox, & Mitchum, 2011). A study indicated that older adults’ technology usage was limited to communication or searching for information about community, health, news, and travel (Olson, O’Brien, Rogers, & Charness, 2011). Interestingly, it also found that the frequency of searching for health information did not differ across age groups (Olson et al., 2011).
Benefits of technology for older adults. The benefits of technology for older adults were being examined as early as 1973, where technology for residents in assisted living
Studies indicated that older adults who had adopted new technologies described their feelings as “keeping pace with the modern world,” and “not being left behind” (Hill, Betts, & Gardner, 2015; Richardson et al., 2002). The range of technologies encountered in the daily lives of older adults is extensive (Czaja, Boot, Charness, & Rogers, 2019). For older adults who live
independently, technology can support the majority of their activities, including many home-based tasks, such as cooking, cleaning, and house maintenance (Baltes, Maas, Wilms, Borchelt, & Little, 1999). Survey data suggested that older adults are aware that health technologies can support their living independently in their own homes (Barrett, 2008). They commented that mobile devices and medical alert systems could be lifesaving when in need of immediate help (Barrett, 2008). Technology can also aid older adults in the work domain, especially now that their participation in the workforce is increasing dramatically (Dohm & Shniper, 2007).
Barriers and difficulties in learning new technology. Although new technologies are of benefit to older adults with their daily lives, many studies suggested that older adults experience greater difficulty than young adults when learning to use new technologies (Barnard, Bradley, Hodgson, & Lloyd, 2013; Dickinson, Arnott & Prior, 2007; Kelley & Charness, 1995). For example, older adults find learning about computers more difficult than younger people do, as they are more likely to forget and take longer to reach a level of proficiency (Dickinson et al., 2007). Also, a study found that there were significant age differences in computer task
performance, as measured by older adults making fewer correct decisions and taking longer to make their decisions than younger adults (Laguna & Babcock, 1997).
digital systems (Czaja, Sharit, Ownby, Roth, & Nair, 2001; Fisk, Rogers, Charness, Czaja, & Sharit, 2009; Gregor & Dickinson, 2007). For example, significant age differences were found in the performance of a complex information search and retrieval task, which indicated the
correlation between cognitive abilities and task performance (Czaja et al., 2001).
The difficulties faced by older adults in learning to use new technologies are not confined to physical and cognitive factors (Lee & Coughlin, 2015; Selwyn, 2004). Other factors have also been recognized in many studies, including 1) familiarity with new technology (Lawhon, Ennis, & Lawhon, 1996; Turner, Turner, & Van de Walle, 2007; Wilkinson, Langdon, & Clarkson, 2010); 2) attitude toward technology (Kelley & Charness, 1995; Broady, Chan, & Caputi, 2010); 3) anxiety in learning new technology (Birdi, Pennington, & Zapf, 1997); 4) self-efficacy in learning new technology (Igbaria & Iivari, 1995; Middlemass, Vos, & Siriwardena, 2017; Tsai, Shillair, Cotten, Winstead, & Yost, 2015); and 5) usability of technology (Chun & Patterson, 2012; Hawthorn, 2000; Leung, McGrenere, & Graf, 2011; Page, 2014; Wilkinson, Langdon, & Clarkson, 2011). For example, distinct differences between older adults and young adults were observed in problem-solving and task completion, with the older adults making fewer attempts toward task completion, taking longer in overall task completion, but recording a lower rate of error in the process. Some of these differences may be attributable to older adults’ lack of familiarity with new technology (Wilkinson et al., 2010).
al. (2010) found that the factors influencing older adults regarding their use and attitudes towards technology are quite similar to those influencing young adults.
Older Adults as Technology Users – User Characteristics
Physical abilities. There are many changes in physical abilities that occur with aging that are relevant to the interaction between older adults and new technology. With increased age, there are declines in visual acuity, accommodation, contrast sensitivity, visual search skills, and the ability to detect targets against a background (Czaja & Sharit, 2016; Hutchison, Eastman, & Tirrito, 1997). For example, declines in accommodation take older adults longer for their eyes to adjust to shifts in viewing distances (e.g., the information presented on a TV screen vs. the information presented on a smartphone screen) (Piper, Brewer, & Cornejo, 2017). Hearing ability also declined with age (Czaja & Sharit, 2016). Digital systems that include a speech component can be problematic for older adults if the rate of speech is too rapid or is distorted (Sharit, Czaja, Nair, & Lee, 2003). Moreover, with the changes in motor skills that occurs with aging, mouse control movements such as cursor movement, double-clicking, fine positioning, and dragging were difficult for older adults (Czaja & Sharit, 2016).
including information searching behavior and web navigation performance (Blackler, Popovic, & Mahar, 2010; Gudur, Blackler, Popovic, & Mahar, 2009; Laberge & Scialfa, 2005; Sharit,
Hernández, Czaja, & Pirolli, 2008).
Technology experience. According to Dreyfus’s (2004) five-stage model of adult skill acquisition, learners’ level of experience can be categorized into five stages (from a low level of experience to a high level of experience): novice, advanced beginner, competent, proficient, and expert (Dreyfus, 2004). The skill model is summarized in the table below (see Table 2.1).
Table 2.1
Five Stages of Skill Acquisition
Skill Level Components Perspective Decision Commitment Novice Context-free None Analytic Detached
Advanced beginner
Context-free and
situational None Analytic Detached
Competent Context-free and
situational Chosen Analytic
Detached understanding and deciding; involved outcome Proficient Context-free and
situational Experienced Analytic
Involved understanding; detached deciding Expert Context-free and
situational Experienced Intuitive Involved Note. Adapted from Dreyfus (2004).
decision making. Commitment refers to the degree to which the learner is immersed in the learning situation regarding understanding, deciding, and action pairing (Dreyfus, 2004).
In this model, the expert represents the learner with the highest level of experience among the five stages. Experts have acquired knowledge that is organized in a way that reflects a deep understanding of their subject matter and can be retrieved fluently (National Research Council, 1999, p. 31-32). In terms of interacting with new technology, experts could be users who are very experienced in technology in general or in a specific domain. Technology experience can effect users’ task performances. A study found that experience in using digital cameras that were similar to the digital cameras used in the experiment helped participants to complete the tasks more quickly, more intuitively, and with fewer errors (Blackler et al., 2010).
Technology experience is also an important factor that effects people’s attitudes and feelings toward new technology (Holzinger, Searle, & Wernbacher, 2011; Renaud & Van Biljon, 2008; van der Wardt, Bandelow, & Hogervorst, 2010; Venkatesh, Morris, Davis, & Davis, 2003). Additionally, these studies indicated that attitudes (e.g., technology acceptance), anxiety, and self-efficacy (e.g., level of confidence) are to some extent all interconnected with each other.
Attitudes. Older adults with more knowledge of and expertise with the relevant
The Technology Acceptance Model (TAM) proposed several factors that are essential in determining user attitude towards accepting a new technology (Davis, 1989). Studies suggested that users’ technology experience effects two factors of technology acceptance: 1) the perceived ease of use (Ziefle, 2002), and 2) the perceived usefulness (Taylor & Tedd, 1995).
Anxiety. Studies found that technology experience is negatively associated with anxiety where higher computer experience is related to lower computer anxiety (Igbaria &
Chakrabarti,1990; Necessary & Parish; 1996). Moreover, many studies suggested that people with increased anxiety towards computers are more likely to have negative attitudes (e.g., lack of perceived ease of use) towards using computers (Hackbarth, Grover, & Yi, 2003; Igbaria & Chakrabarti,1990; Necessary & Parish; 1996). This finding indicated that anxiety and attitude are negatively associated with each other.
Studies suggested that, under certain conditions, technology-related anxieties increase with age (Laguna & Babcock, 1997) and decrease with technology experience (Charness, Kelley, Bosman, & Mottram, 2001). For example, older novices were observed taking longer to learn the task and making more errors than young novices during the test, which also brought out more anxieties among older novices (Charness et al., 2001). However, no age effect was observed among experienced users (Charness et al., 2001).
reported a positive relationship between computer training and computer self-efficacy (Igbaria & Iivari, 1995; Potosky, 2002; Wagner, Hassanein, & Head, 2010).
In addition, a study suggested that self-efficacy in the use of telemonitoring equipment in the healthcare environment is linked to users’ positive attitudes toward digital devices
(Middlemass, 2017). Self-efficacy was also found to be positively associated with perceived ease of use, which indicated that higher self-efficacy was related to higher technology acceptance (Chung, Park, Wang, Fulk, & McLaughlin, 2010; Hong, Thong, Wong, & Tam, 2001).
The Complexity of Learning: From Learning Theories to Learning Methods
Stages of learning. Learning is not expected to be instantaneous. When people attempt to gain knowledge or acquire a skill, the learning process is relatively complex or time-consuming and it has often been characterized as progressing through several stages (Czaja & Sharit, 2016). During the initial stage, learners are processing new information and are being challenged by the need to differentiate among various facts, rules, and concepts. Older novices may need more training and instructions than young adults and experienced older adults when learning a new technology. To compensate for the lack of technology experience, instructors for the tech-class should consider providing overviews and context for the more specific task-related information at the beginning of the training (Cotten et al., 2016). However, Czaja and Sharit (2016)
mentioned that with older learners, too much preliminary information could backfire as it may not be retained by older adults as easily. Also, it could lead to confusion and cause anxiety. Thus, it is probably best to keep such overviews brief and straightforward (Czaja & Sharit, 2016).
patterns that the novice will not (National Research Council, 1999). However, being an expert does not necessarily mean that he or she is always an out-performer. A study found that experts scored higher than novices on the tasks of locating websites but not on the tasks of locating information (Lazonder et al., 2000). The study also showed that participants (i.e., novice users) who received brief on-site training before the test performed better than participants in the control group (i.e., non-users) who had no hands-on experience regarding the subject matter (Lazonder et al., 2000). This finding indicated that even a minimum hands-on experience could benefit people when developing skills.
Learning theories: behaviorism vs. constructivism. Two learning theories can be applied to the context of the learning: behaviorism learning theory and constructivism learning theory. Behaviorism learning theory is based on Skinner’s Stimulus-Response (S-R) theory, which states that “learning is a change in a behavioral disposition that can be shaped by selective reinforcement” (Jonassen, 1993). The premise of behaviorism is that an effective way for a student to learn is to transmit knowledge from the expert to the learner (Leidner & Jarvenpaa, 1995).
In contrast, constructivism learning theory is a view of learning based on the belief that knowledge isn’t a thing that can be simply given by the instructor. Constructivism draws on the developmental work of Piaget (1977). Under this view, learning is a dynamic, constructive process. The learner is an information constructor. Learners actively construct or create their subjective representations of objective reality.
environment, learners are encouraged to be actively involved in their process of learning (Leidner & Jarvenpaa, 1995). Piaget (1977) asserted that learning occurs by active construction of meaning (i.e., learning-based approach), rather than by passive acceptance (i.e., teaching-based approach). Constructivism alters the roles between instructors and learners in the learning process. It allows learners have more control over the learning process (Yager, 1991).
Concurring with the premise of constructivism, findings from studies showed that learning is most effectively accomplished when new information is connected to and built upon a student's prior knowledge and real-life experiences (Chu & Tsai, 2009; Spigner-Littles & Anderson, 1999). The findings indicated that learners would have good experiences (e.g., learning
effectively) when information is relevant to them and when they understand why and how to use the new information.
However, there is a limitation in constructivism2. A study indicated that the learning-based approach would be more practical when it is applied to an environment where learners have a higher level of educational background or with a higher level of expertise regarding the subject matter (O’Loughlin, 1992). The point is that learners need to embrace what they don’t know and to come up with questions about the subject matter in order to engage with the learning process (Thomas & Brown, 2011). Hence, the learning-based approach may not be suitable for novices, considering the Components (as detailed in a previous section) have yet to be perceived by novice learners to some extent (Dreyfus, 2004).
Learning methods. There are a wide variety of methods for older adults to learn to use new technologies: 1) learning alone; 2) learning from domain experts; 3) learning from
family/friends; and 4) learning from unspecified others (Mitzner et al., 2008; Kurniawan, 2006;
2 This constructivism is not to be confused with the constructivism – one of the “three-part continuum” of research
Martínez-Alcalá et al., 2019). The learning alone methods include trial and error, Internet
searching, using Help features, and reading instruction manuals (e.g., printed user manuals). The learning from domain experts methods include asking for IT support (e.g., computer support specialists) and taking training classes. Learning from family/friends methods include learning from family/friends from the same generation (e.g., sister, spouse) and family/friends from younger generation (e.g., child, grandchild). Learning from unspecified others methods include, but are not limited to, asking neighbors, co-workers, and digital device salespeople (who are not counted among domain experts). A study showed that older adults have a strong preference for self-training by reading manuals and other printed instructions as well as for hands-on learning through trial and error (Mitzner et al., 2008).
Interaction Design for Older Adults
Interaction design principles. Design principles are prescriptive rules that describe which design elements are required for designing in a certain context (e.g., display design for older adults). In general, design principles are abstract, context-based, and hard to transform into concrete design elements. One of the goals of creating design principles is to facilitate heuristic evaluation (Inostroza & Rusu, 2014; Pinelle, Wong, & Stach, 2008).
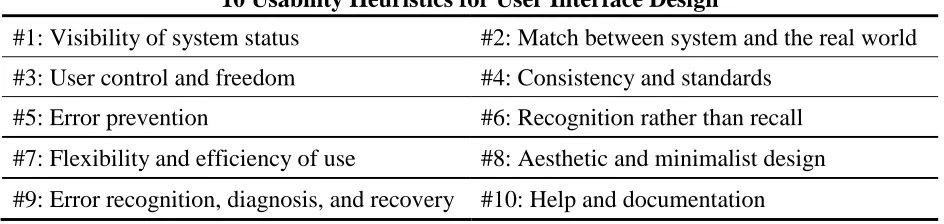
Table 2.2
Usability Heuristics for User Interface Design
10 Usability Heuristics for User Interface Design
#1: Visibility of system status #2: Match between system and the real world #3: User control and freedom #4: Consistency and standards
#5: Error prevention #6: Recognition rather than recall #7: Flexibility and efficiency of use #8: Aesthetic and minimalist design #9: Error recognition, diagnosis, and recovery #10: Help and documentation Note. Adapted from Nielsen (1994).
There are few studies regarding how design principles inform the design process and benefit final design deliverables (Terblanche, 2014). For those highly abstract design principles, it is hard for designers to apply them to their design concepts development. However, studies found that the application of design principles always went along with the application of design guidelines (Farage, Miller, Ajayi, & Hutchins, 2012; Holzinger, Searle, & Nischelwitzer, 2007; Terblanche, 2014).
Interaction design guidelines. Compare with design principles, design guidelines are more specific. They can provide the perspective of “how-to” for designers. But design guidelines are also context-based (Zaphiris, Kurniawan, & Ghiawadwala, 2007). Since the mid-1980s, interaction design guidelines for software user interfaces and Human-Computer Interaction (HCI) have increased in importance. Benefits resulting from the use of interaction design guidelines include: 1) increasing designers’ (or engineers’) productivity; 2) reducing project training expenses; and 3) improving overall product quality and usability (Reed et al., 1999).
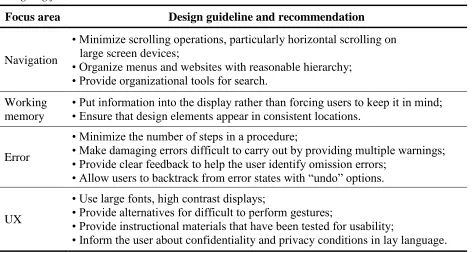
Table 2.3
Designing for Older Adults: UI/UX Guidelines
Focus area Design guideline and recommendation
Navigation
• Minimize scrolling operations, particularly horizontal scrolling on large screen devices;
• Organize menus and websites with reasonable hierarchy; • Provide organizational tools for search.
Working memory
• Put information into the display rather than forcing users to keep it in mind; • Ensure that design elements appear in consistent locations.
Error
• Minimize the number of steps in a procedure;
• Make damaging errors difficult to carry out by providing multiple warnings; • Provide clear feedback to help the user identify omission errors;
• Allow users to backtrack from error states with “undo” options.
UX
• Use large fonts, high contrast displays;
• Provide alternatives for difficult to perform gestures;
• Provide instructional materials that have been tested for usability;
• Inform the user about confidentiality and privacy conditions in lay language. Note. Adapted from Czaja et al. (2019, p123-124).
Although, design guidelines can be valuable and useful when they can lead to the development of actionable recommendations. Many questions were still raised regarding the application and utility of design guidelines. Survey results showed that in practice, only a
minority of designers consult design guidelines (Mosier & Smith, 1986). In the survey, only 58% of the target users of the design guidelines attained success in finding the information they needed. This may be a result of the following: 1) designers have trouble accessing relevant information; 2) designers have difficulty determining what should be prioritized among
conflicting guidelines; 3) guidelines are too abstract; and 4) guidelines are not necessarily up-to-date with emerging technologies (Mosier & Smith, 1986).
guidelines should be arranged based on the design elements as well as user actions (Kim, 2010). Designers can easily conduct the keyword-search when the guidelines are arranged based on the design elements (e.g., navigation, link, icon). Furthermore, designers can use the guidelines to facilitate the user journey mapping if the guidelines also covered the perspective of user actions (e.g., scan, find, act) (Kim, 2010).
Learnability of technologies. There is a wide range of design principles associated with the learnability (defined in Chapter 1). The ones that are most applicable to UI/UX are: 1) predictability; 2) consistency; 3) familiarity; 4) generalizability; and 5) simplicity (Dix, Finlay, Abowd, & Beale, 2004; Green & Eklundh, 2003; Weiss et al., 2011). Technology with higher learnability can provide users with higher levels of self-efficacy, more positive attitudes, and reduced anxiety (Leung, McGrenere, & Graf, 2009).
However, some design strategies have different effects on older adults and young adults (Wilkinson et al., 2011) while some design strategies have different effects on the different stages of learning (Leung, Findlater, McGrenere, Graf, & Yang, 2010; Green & Eklundh, 2003) as well as different skill levels (Melguizo & Van Oostendorp, 2012).
For design strategies for interface elements (i.e., internal visual structures and internal instructional features), findings from a study showed that designing for learnability is more essential for first-time users than returning users (Green & Eklundh, 2003). And design features such as relevant and immediate feedbacks are crucial for enabling successful performance (Green & Eklundh, 2003). Furthermore, a study found that reduced-functionality interfaces provided greater benefit for older adults than for young adults in terms of task completion time during initial learning, perceived complexity, and preference (Leung et al., 2010). However, interacting with the reduced-functionality interface would not improve older adults’ performance in learning the advanced task set on the full-functionality interface (Leung et al., 2010).
Similarly, it was found that expandable menus are more beneficial than sequential menus among participants with low spatial skills, while participants with high skills do not seem to be affected by task difficulty or menu type (Melguizo & Van Oostendorp, 2012).
For design strategies for external instructional materials, a study suggested that technology instruction for older adults should be separated by expertise and experience
al., 2007). However, when instructions were no longer available, there was a benefit for those who had initially received guided attention training (Hickman et al., 2007).
In addition, a study indicated that older adults would benefit more from simple
instructions than expanded instructions (Morrell et al., 2000). Similarly, a study suggested that the user manual for older adults needs to minimize the usage of jargon or technical terms
(Loorbach et al., 2007). If jargon is inevitable, then the product should provide explanations in a separate glossary so that older adults can track questions and refresh their memory (Loorbach et al., 2007).
Regarding the medium of the external instructional materials, a study showed that both older adults and young adults preferred video instructions over text manuals (Gramß & Struve, 2009). Another study reported that the majority of older adult participants preferred paper-based manuals over digital materials if given the options (Tsai, Rogers, & Lee, 2012).
Summary of Literature Review
Most of the studies in the literature review focused on understanding the age-related differences (e.g., physical and cognitive abilities) in learning technologies. Also, given that new technologies are commonly perceived as products for younger people, many studies conducted cross-sectional experiments to see how age-related differences effect task performances.
Some studies in the literature review indicated that older adults could experience
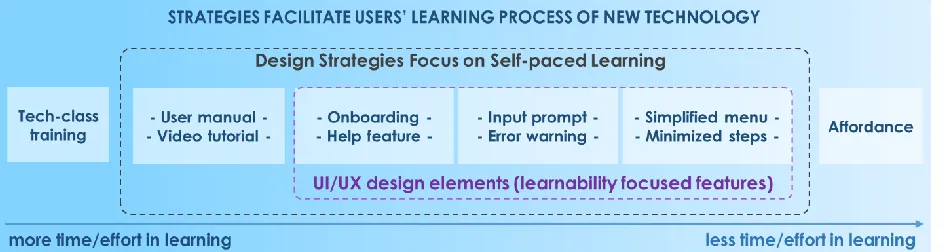
Moreover, many studied indicated that by providing appropriate strategies (e.g., learning materials, learning methods), some of the frustration or barriers during the learning processes could be reduced. Based on the literature review, many strategies have been used to facilitate users’ learning process of new technology. And some of them are design strategies that focus on providing the self-paced learning environment to users (e.g., simplified menu, input prompt, user manual). These design strategies can improve the learnability of new technology, guide users through the initial learning process, and minimize users’ time and effort in learning new technology. Furthermore, some of them can be designed by UI/UX designers and applied as design elements to the interaction design of new technology.
A framework regarding design strategies, UI/UX design elements, and the users’ time and effort in learning new technology was proposed by the researcher. The relationships between the three aspects, as well as a set of potential UI/UX design elements (i.e., learnability focused features), were generalized in Figure 2.1.
Figure 2.1. Design strategies, UI/UX design elements, and the users’ learning process.
tech-class has low learnability. The reason for choosing a strategy highly depends upon the complexity of the technology, the procedure of the task, the availability of the instructional resources, and the user’s preference.
CHAPTER 3
OLDER ADULTS’ EXPERIENCE WITH LEARNING NEW TECHNOLOGY Chapter 3 is formatted as a manuscript for the submission in category of Student papers to the journal Gerontechnology. Appendixes mentioned in this chapter are supporting materials for the explanatory purpose of the dissertation. They may not be included in the final submission for the journal.
Title: Older Adults’ Experience with and Barriers to Learning New Technology: A Focus Group Study
Authors: Hongyang Liu and Sharon Joines (College of Design, North Carolina State University, Raleigh, NC)
Abstract: Technology as a concept can generally be defined as any electronic device, digital service or digital system. Although these technologies can benefit older adults through their everyday activities, older adults have more difficulty than younger individuals in using and learning to use new technology. Moreover, people with different levels of technology experience may have different learning experiences. Experienced users are expected to have better
Introduction
Background. The concept of technology can be generally defined as any electronic device (e.g., smartphone), digital service (e.g., social media) or digital system (e.g., voice command). Technology is prevalent in people’s everyday life, especially among older adults (i.e., aged 65 and over). The range of technologies encountered in the daily lives of older adults is extensive (Czaja, Boot, Charness, & Rogers, 2019). Studies indicated that older adults who had adopted new technologies described their feelings as “keeping pace with the modern world,” and not “being left behind” (Hill, Betts, & Gardner, 2015; Richardson, Zorn, & Weaver, 2002). However, the extent of frustration that older adults encountered when dealing with technology is also quite evident (Barnard, Bradley, Hodgson, & Lloyd, 2013).
Related work. Many studies suggest that older adults experience greater difficulty than young adults when learning to use new technologies (Barnard et al., 2013; Dickinson, Arnott & Prior, 2007; Kelley & Charness, 1995). The decline of physical and cognitive abilities can contribute to the barriers to and difficulties in interacting with technology (Kaye, Yeager, & Reed, 2008; Lee & Coughlin, 2015; Wang, Chen, & Chen, 2017). Other factors have also been recognized including: 1) familiarity with new technology (Turner, Turner, & Van de Walle, 2007; Wilkinson, Langdon, & Clarkson, 2010); 2) attitudes toward technology (Kelley & Charness, 1995; Broady, Chan, & Caputi, 2010); 3) anxiety in learning new technology (Birdi, Pennington, & Zapf, 1997); 4) self-efficacy in learning new technology (Igbaria & Iivari, 1995; Tsai, Shillair, Cotten, Winstead, & Yost, 2015); and 5) product usability (Chun & Patterson, 2012; Leung, McGrenere, & Graf, 2011; Page, 2014).
older adults have a strong preference for self-training by reading manuals and other printed instructions as well as for hands-on learning through trial and error (Mitzner et al., 2008).
Additional insights into the difficulties in learning to use new technology came from studies on the difference between novice and expert in the learning process (Lazonder, Biemans, & Wopereis, 2000; Ziefle & Bay, 2004). For example, older adults with less technology
experience may spend more time in training and need more instructions than experienced older adults. To compensate for the lack of technology experience, researchers suggested that
instructors for the tech-class should consider providing overviews and context for the more specific task-related information at the beginning of the training (Cotton et al., 2016).
Nevertheless, Czaja and Sharit (2016) mentioned that with older learners, too much preliminary information could backfire as it may not be retained by older adults as easily. Also, it could lead to confusion and cause anxiety. For example, it is hard for a novice user to fully understand the concept of each feature and the reasoning behind each action when the novice is being
introduced to various features and steps in a system all at once. Therefore, due to the lack of understanding, the novice user had to follow the rules (e.g., first, click the red button in the middle; then, check the box at the end of the page). However, merely following rules may lead to poor performance in the real world. If the system updated, the novice will not be able to adapt to the changes and alter their actions accordingly.
Study overview. To better understand the experience with and barriers to learning new technologies among older adults, this study aimed to explore the technology learning processes among older adults with different levels of technology experience. The study was approved by the NC State Institutional Review Board (IRB) (see Appendix A). Data included in this article were gathered from a focus group study conducted in Raleigh, NC, Cary, NC, and Chapel Hill, NC, which included a total of 40 older adults. Each focus group contained five participants. Topics such as older adults’ attitudes toward learning new technology, learning barriers and difficulties, learning methods, and their opinions about different learning methods were discussed during the focus group sessions.
Method
Screening test. A Technology Experience Profile (TEP) was used as a screening test to categorize individuals into different technology experience groups. TEP assessed individual’s use and familiarity with various technologies (Barg-Walkow, Mitzner, & Rogers, 2014). To ensure the technology experiences differences among the participants groups, individuals within the following TEP score ranges were eligible to be recruited and participate in the focus group: 1) novice group (score range 36-54); 2) advanced beginner group (score range 72-90); 3) competent group (score range 108-126); and 4) proficient group (score range 144-162). These criteria did not apply to the pilot tests (as detailed in the next section). After the score sorting from 104 TEP responses, a total of 40 older adults (23 females and 17 males) aged 65-87 years (M = 71.13, SD = 5.43) were recruited for this study (see Appendix B). Each technology experience group contained 10 participants.
discussion topics among the participants. The first pilot group consisted of five older adults with a similar level of technology experience (TEP score ranged from 91-126). The second pilot group consisted of five older adults in the opposite TEP scores range (two participants scored below 72, and three participants scored above 162). Based on the pilot results, the first pilot group came up with more topic-related discussions. In contrast, fewer topic-related discussions were generated from the second pilot group. Thus, in the focus groups, participants in each session were purposefully chosen and arranged to ensure that they were not on the opposite end of the TEP score ranges. For instance, participants in the novice group and participants in the advanced beginner group were scheduled in the same focus group session.
Focus groups. A total of eight focus groups, with five participants in each session, were conducted in this study. At the beginning of each session, participants were asked to review the informed consent while the researcher summarized the general goals of the study and explained the rules for the discussion (e.g., speak one at a time, contribute own experiences). After
collecting all the signed informed consent, the researcher started the audio-recording, and the session began.
During the focus group session, three main topics were discussed, including attitudes toward learning new technology, barriers/difficulties in learning processes, and learning methods (see Appendix C for the focus group discussion guideline). In addition to the audio recording, the researcher also took written notes during the discussion.
Each focus group session lasted 90-100 minutes. At the end of each session, the participant received a $15 gift card as a compensation for participation.
proofread and segmented into categories/subcategories, and then coded using MAXQDA 2018 (a qualitative data analysis software package) by the researcher. Five categories were identified among all segments: 1) attitudes, 2) learning barriers, 3) learning methods, 4) starting points, and 5) user needs. After the thematic coding process, the frequency of occurrence of the codes under each theme (and subtheme) was calculated (see Appendix D for segment and coding scheme). All frequency counts for each code were sorted by the technology experience groups (see Appendix E for a full breakdown of all the frequencies). The overview of all
categories/subcategories and themes/subthemes in this study can be found in Appendix F.
Results
Attitudes. Two subcategories were coded under the attitudes toward learning new technology: positive attitudes and negative attitudes. There were, overall, a greater reported number of positive attitudes toward learning new technology (total = 186) than negative attitudes toward learning new technology (total = 139).
Table 3.1
Frequency Counts of Positive Attitudes and Negative Attitudes among Four Groups
Subcategory
Novice (n = 10)
Advanced beginner
(n = 10)
Competent (n = 10)
Proficient (n = 10)
Positive attitudes 37 41 49 62
Negative attitudes 54 39 26 20
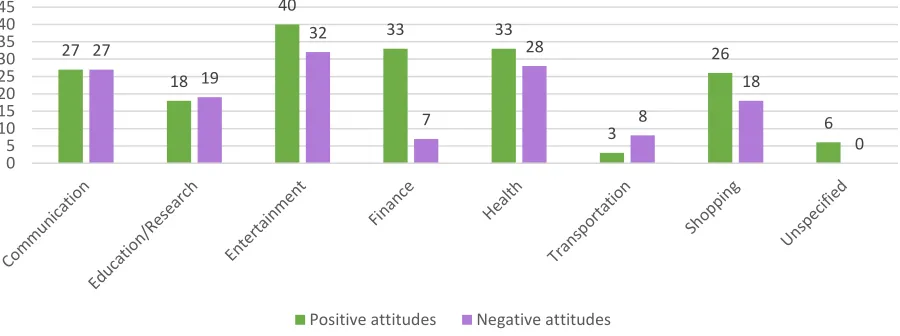
A total of eight themes were identified under the two subcategories (see Figure 3.1). Seven out of eight themes were the different activities that technologies can support, including communication, education/research, entertainment, finance, health, shopping, and
transportation. For participants’ attitudes that didn't direct to any specific activity, they were coded under the theme unspecified.
Figure 3.1. Distribution of frequency counts of the themes in subcategories “positive attitudes” and “negative attitudes.”
Among all the themes under the positive attitudes, entertainment had the highest
frequency counts, while transportation had the lowest frequency counts. Among all the themes
27 18 40 33 33 3 26 6 27 19 32 7 28 8 18 0 0 5 10 15 20 25 30 35 40 45
Distribution of Frequency Counts of the Themes in Subcategories “Positive Attitudes" and “Negative Attitudes”
under the negative attitudes, technologies related to entertainment had the highest frequency counts, while finance had the lowest frequency counts.
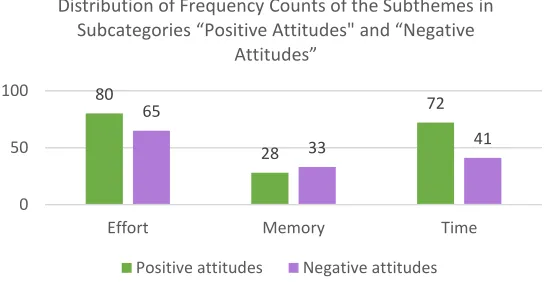
Furthermore, themes related to the different activities that technologies can support were coded with three subthemes, including effort, memory, and time. The coding scheme was based on the reason that participants mentioned when they were discussing their attitudes toward learning a specific type of new technology. For example, the following quote would be sorted in to “the Category attitudes> Subcategory negative attitudes>Theme entertainment>Subtheme time”: “I can’t (referring to learn to use the four remote controls he or she had at home), I don’t
have time to do all that….I want it now and I can’t get it now. I hated those remotes”.
Among the three subthemes under the subcategory positive attitudes, the subtheme effort had the highest frequency counts, while the subtheme memory had the lowest frequency counts. The same results also showed in the frequencies counts of the codes regarding three subthemes under the subcategory negative attitudes (see Figure 3.2).
Figure 3.2. Distribution of frequency counts of the subthemes in subcategories “positive attitudes” and “negative attitudes.”
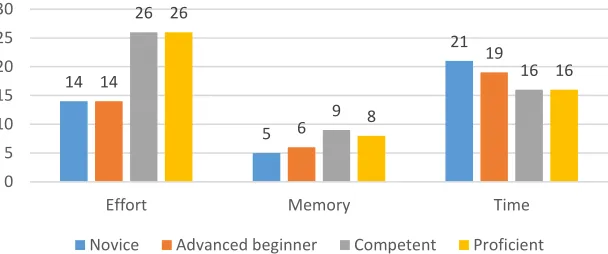
Among four technology experience groups, differences were identified in the distribution of frequency counts for the three subthemes under both subcategories (see Figure 3.3 and Figure
80
28
72 65
33 41
0 50 100
Effort Memory Time
Distribution of Frequency Counts of the Subthemes in
Subcategories “Positive Attitudes" and “Negative Attitudes”
3.4). For positive attitudes, the frequency counts of codes in subtheme effort increased with the level of technology experience. Moreover, the frequency counts of codes in subtheme time decreased with the level of technology experience. For negative attitudes, the frequency counts of the codes in all three subthemes decreased with the level of technology experience in all three subthemes.
Figure 3.3. Distribution of frequency counts for the subthemes “effort,” “memory,” and “time” under the positive attitudes in four technology experience groups.
Figure 3.4. Distribution of frequency counts for the subthemes “effort,” “memory,” and “time” under the negative attitudes in four technology experience groups.
14 5 21 14 6 19 26 9 16 26 8 16 0 5 10 15 20 25 30
Effort Memory Time
Distribution of Frequency Counts for the Subthemes "Effort," "Memory," and "Time" under the Subcategory Positive
Attitudes in Four Technology Experience Groups
Novice Advanced beginner Competent Proficient
23 13 18 18 9 12 13 7 6 11 4 5 0 5 10 15 20 25
Effort Memory Time
Distribution of Frequency Counts for the Subthemes "Effort," "Memory," and "Time" under the Subcategory Negative
Attitudes in Four Technology Experience Groups
Learning barriers. Three themes and seven subthemes were identified under the
category of learning barriers: 1) abilities (subthemes: motor control, vision, working memory); 2) product characteristics (subthemes: complexity, familiarity, generalization, reliability); and 3) instructions. Among all three themes, product characteristics had the highest frequency counts (frequency count = 86), while instructions had the lowest frequency counts (frequency count = 13).
The four groups had similar frequencies counts for the codes regarding theme abilities. Three subthemes were identified, including 1) motor control (e.g., “Some of it is so tiny and -- I've got big fingers”), 2) vision (e.g., “my vision is not good enough to notice oops it's not at the right place”), and 3) working memory (e.g., “…because I'll watch it, and I'll think, "I got it,"
because I get it in my iPad and then I'm doing it on the computer, and then I have to go back three times”).
The distributions of four subthemes under the theme product characteristic were
different among the four groups. Participants in the novice group had the most learning barriers regarding subthemes complexity, familiarity, and reliability among the four groups. As a total of 31 codes regarding the theme product characteristic were identified among participants in the novice group, 13 were coded under the subtheme complexity (e.g., “the instruction said that ‘click over here, and click here, and click here’ and the next sentence is, ‘if you don't like