Copyright2000 by the Genetics Society of America
Marker-Assisted Selection to Increase Effective Population Size by Reducing
Mendelian Segregation Variance
Jinliang Wang and William G. Hill
Institute of Cell, Animal and Population Biology, University of Edinburgh, Edinburgh EH9 3JT, United Kingdom
Manuscript received May 10, 1999 Accepted for publication September 20, 1999
ABSTRACT
Using both the genetic drift and inbreeding approaches, we derive more general equations for effective size (Ne) of a diploid species under random mating. These equations show explicitly that inbreeding or genetic drift comes from two sources, the variation in the number of offspring from each parent and the variation in contribution between these parents’ own paternally and maternally derived genes to their offspring. The first source can be easily and effectively controlled by choosing an equal number of offspring from each family, while the second can be manipulated by using information on genetic markers to reduce the variance due to Mendelian segregation. Marker-assisted selection (MAS) methods to increase Nefor the whole genome with single or multiple marker loci per chromosome, different numbers of males, and females are developed and implemented in stochastic simulations. The analytical and simulation results show that, although in principle Necan be increased indefinitely, the efficiency of MAS is restricted in practice by the amount of marker information, the genome size, and the number of marker-genotyped offspring per family. The assumptions made in developing the theory and methods and the applications of MAS in conservation are discussed.
G
ENETIC variation within and among individuals is cently. These schemes are effective for maintaining ge-important to, among other issues, the survival, netic variation in small pedigreed populations with adaptation to changing environments, and reintroduc- unequal founder contributions in the first few genera-tion to the wild of small populagenera-tions under captive tions. In the long run, however, they give no larger breeding (Frankham1995; Lacy1997;Woolliamset effective size than equalizing family size.al. 1998). Maintaining genetic variation is, therefore, Is it possible to break the Ne 5 2N (N is the actual one of the primary goals in managing the conservation population size) barrier for diploid species? Equalizing populations of endangered species. Because captive genetic contributions among subpopulations and among breeding populations are usually small in size, their families within subpopulations in a metapopulation genetic variation diminishes over generations due to (WangandCaballero1999) or equalizing family size inbreeding and genetic drift. The rate of the reduction with more frequent mating of close relatives than at in genetic variation is proportionately reciprocal to the random in a single population [such as circular pair effective population size (Ne). Obviously, it is desirable mating proposed by Kimura and Crow (1963)] can
to maximize Nefor captive breeding. result in Ne . 2N. This is realized, however, with a
Compared to random contributions of offspring to sacrifice of a higher rate of inbreeding at initial genera-the next generation from different families, equal con- tions or the loss of within-individual variation ( Robert-tribution (equalizing family size) is predicted to double son1964;WangandCaballero1999). N
e.2N cannot the effective size of diploid populations (Crow and be reached until all individuals are made highly
homozy-Kimura1970;Caballero1994). The impact of equal gous by close inbreeding in these schemes. Because of
family size has been verified by empirical studies (e.g., the nearly ubiquitous inbreeding depression in diploid
Borlase et al. 1993) and recommended in captive organisms (CharlesworthandCharlesworth1987;
breeding (Frankham 1995; Woolliams et al. 1998). Falconer and Mackay 1996), it is clear that these
Other strategies to minimize inbreeding and genetic schemes are impractical in captive breeding programs. drift in small populations, such as equalization of Is it possible to materialize N
e . 2N without losing founder contributions (Alderson1991) and minimiz- the genetic variation within individuals (i.e., heterozy-ing coancestry (Lacy 1995), have been proposed re- gosity)? A possible solution to this problem is the use
of genetic markers in making selection decisions. Some selection strategies based on marker information, such Corresponding author: Jinliang Wang, Institute of Cell, Animal and as frequency-dependent selection or selection for het-Population Biology, Ashworth Lab, University of Edinburgh, W. Mains
erozygosity at marker loci, have been proposed and their Rd., Edinburgh EH9 3JT, United Kingdom.
E-mail: [email protected] efficiency on decreasing inbreeding rate has been
tigated by simulations (e.g.,Toroet al. 1998). The effec- variants at a locus in the population. In particular, alter-native genes at a locus within an individual refer to the tiveness of these selection strategies is, however, rather
limited because, among other reasons, the information paternally and maternally derived genes (i.e., haplotypes at a single locus).
about marker locations on a chromosome, the marker
information for parents, and the relationship among Autosomal locus:More general equations for effective population size can be derived from both the genetic marker genotypes of offspring within families are wasted
in these selection schemes. For a better utilization of drift approach and the inbreeding approach. The for-mer shows explicitly the two sources of genetic drift, genetic markers to increase Ne,Toroet al. (1999)
pro-posed a method aimed at minimizing the average coan- and the latter yields equations operational in MAS to increase effective size.
cestry of selected individuals conditional on marker
in-formation. The method is implemented using Markov Genetic drift approach: The average frequency (over
sexes) of a given neutral allele in the population at the Chain Monte Carlo technique.
Can genetic markers be used more easily and effi- present generation is ciently to increase effective size? The clue to the
prob-lem comes from haploid species, for which Nebecomes q5
1 4Nm
o
Nm
i51
o
2
j51
xij 1 1 4Nf
o
Nf
i51
o
2
j51
xij, infinite by equalizing family size, irrespective of the
ac-tual size N. This is because genetic drift comes solely where x
ijis the allele frequency for gene j (51 or 2 for from the differential contributions among individuals paternally or maternally derived gene) in parent i (thus in haploid species. In diploid species, however, an addi- x
ij 5 1 with frequency q or xij 5 0 with frequency 12 tional source (cause) of inbreeding and genetic drift q). If gene j in parent i of sex u contributes n
uvijoffspring is the variation in contribution of the paternally and of sex v (u, v5m or f for a male or a female, respec-maternally derived genes at a locus within individuals. tively), the average allele frequency becomes
Equalization of family size ensures an equal genetic
representation of different parents in the next genera- q9 5 1
4Nm
o
Nm
i51
o
2
j51
(nmmij1nmfij/r)xij tion, but the contributions from different genes within
parents remain variable. The latter can be controlled
by marker-assisted selection (MAS) to minimize the 1 1
4Nf
o
Nf
i51
o
2
j51
(rnfmij1nffij)xij probability of identity by descent of the homologous
genes contributed by a parent.
in the next generation. The change in allele frequency In this article, we derive more general equations for
(q9 2q) is
effective size of diploid species under random mating, showing explicitly the two sources of inbreeding and
Dq5 1
4Nm
o
Nm
i51
o
2
j51
[(nmmij2 1⁄2)1 (nmfij2r/2)/r]xij genetic drift. Using these equations, we develop MAS
methods to minimize the variation in contribution
be-tween the paternally and maternally derived genes at a 1 1
4Nf
o
Nf
i51
o
2
j51
{r[nfmij21/(2r)]1(nffij2 1⁄2)}xij. locus within individuals and thus to increase the
effec-tive size for a given between-family selection scheme.
Because, with random mating, xij’s are uncorrelated The analytical and stochastic simulation results show
both within and among parents and, V(xij)5q(12q), that the average effective population size for the
ge-the variance ofDq can be obtained as nome of a diploid species can be increased enormously
over 2N by MAS when the genome size is small and
V(Dq)5q(12q)
8Nm [S2
mm1 2(1/r)Smm,mf1(1/r)2Smf2] the species is fecund. The efficiency of MAS decreases
rapidly, however, with increasing numbers of
chromo-somes of the genome and decreasing family size. The 1q(12 q)
8Nf [S2
ff12rSfm,ff1r2S2fm],
applications of the theory and method developed in this study to conservation practice are discussed.
where S2
uvis the variance in the number of offspring of sex v contributed by a gene in parents of sex u, and EFFECTIVE POPULATION SIZE OF DIPLOID SPECIES Sum,ufis the covariance between the numbers of sons and daughters contributed by a gene in parents of sex u. Let us assume a diploid population of Nmmales and
Equating V(Dq) to q(1 2 q)/(2Ne) by definition, we Nffemales per discrete generation, each male mating
obtain randomly with r 5 Nf/Nm (mating ratio) females.
Throughout this section, we are concerned with the 1
Ne
5 1
4Nm [S2
mm12(1/r)Smm,mf1(1/r)2S2mf] (1) effective size for a single neutral locus without mutation.
In this article, genes are used when their identities in
state or identities by descent are not distinguished at a 1 1
4Nf [S2
ff12rSfm,ff1r2S2fm].
It can be seen that Ne is determined by the variances of sex u, one chosen at random from an offspring of sex v and one from a different offspring of sex w (u, of and covariance between the numbers of sons and
v, or w 5 m or f for males or females, respectively). daughters contributed by a gene. When all genes
con-Designating by Pu,vwthe probability that the two genes tribute equally to the next generation, Nebecomes
infi-are derived from the same pinfi-arent and by Qu,vwthe proba-nite for the locus, irrespective of the actual population
bility that they are copies of the same gene given that size.
they come from the same parent, the probability that It is desirable to partition S2
uvand Sum,ufinto the
vari-they are derived from the same gene in the parent ances and covariances among individuals and between
is Ru,vw 5 Pu,vwQu,vw. We designate by F the inbreeding alternative genes (paternally and maternally derived)
coefficient of an individual chosen at random and by within individuals. It can be shown, after some algebra,
uvwthe coancestry between two randomly chosen individ-that S2
uv5 d2uv1 s2uv/4 and Sum,uf5 dum,uf1 sum,uf/4 and,
uals of sexes v and w. From the definitions of the con-whered2
uvis the within-individual variance in the number
stants (Pu,vw, Qu,vw, and Ru,vw) and variables (uvw), it is of offspring of sex v anddum,ufis the covariance between
obvious that v and w are interchangeable if v≠ w. In
the numbers of sons and daughters contributed by a
the following, therefore, we use vw5mf when v≠ w.
gene in parents of sex u, ands2
uvis the
between-individ-The variables defined above satisfy the recurrence ual variance in the number of offspring of sex v and
equations
sum,ufis the covariance between the numbers of sons and daughters from a parent of sex u. Both s2
uv and sum,uf F9 5 u
mf,
can be calculated from observed data (pedigree
infor-u9vw51⁄4{Pm,vw[Qm,vw1(1 2Qm,vw)F ]1(12Pm,vw)umm} mation) and controlled relatively easily, whiled2
uv and
dum,ufcan be estimated by using marker information and 11⁄
4{Pf,vw[Qf,vw1(12Qf,vw)F ]1(12Pf,vw)uff}
manipulated through MAS as shown below.
11⁄
2umf,
Using the partitions, Equation 1 becomes
where primes signify the next generation. The equation 1
Ne
5 1
16Nm [s2
mm14d2mm12(1/r)(smm,mf14dmm,mf) for F9comes directly from the definitions of F andumf. The equation for u9vw is obtained by noting that two
1(1/r)2(s2
mf14d2mf)] homologous genes chosen at random from different
offspring of sexes v and w are both paternal, both
mater-1 1
16Nf [s2
ff1 4d2ff12r(sfm,ff14dfm,ff) nal, and one paternal and one maternal with
probabili-ties1⁄
4,1⁄4, and1⁄2, respectively, and then multiplying these factors by the corresponding conditional probabilities
1 r2(s2
fm14d2fm)]. (2)
of identity by descent of the two genes.
As can be seen from (2), genetic drift in allele frequency Using the above recurrence equations and either comes from the differential contributions among indi- Newton’s tangential method of approximation (e.g., viduals and between alternative genes within individu- Wang1997b) or the perturbation theory (e.g., Nagy-als. In previous studies, offspring were assumed to be laki 1995), we obtain, ignoring second and higher-selected at random from within families so that the order terms of Pu,vwand Qu,vw,
contributions of different genes within individuals
fol-Ne58/(Rm,mm12Rm,mf1Rm,ff1Rf,mm12Rf,mf1Rf,ff). low a binomial distribution, and the within-individual
variance is due completely to random sampling. Then (4)
d2
mm 5 d2ff 5 1⁄4, dmf2 5 r/4, d2fm 5 1/(4r), and dmm,mf 5
If offspring are selected randomly from within families
dfm,ff50, and inserting these into (2) yields the classical
so that alternative genes within individuals have an equal equation
chance of contribution, Qu,vw 5 1⁄2, and (4) reduces to
Nagylaki’s (1995) Equation 7 with Ru,vwbeing replaced
1
Ne
5 1
16Nm
[21 s2
mm12(1/r)smm,mf1(1/r)2s2mf]
by1⁄
2Pu,vw, as expected. By using MAS, however, Qu,vwcan be made smaller than 1⁄
2 and thus Ne is increased for the locus in question.
1 1
16Nf
[21 s2
ff12rsfm,ff1r2s2fm] (3)
Equation 4 is actually equivalent to (2) derived from the genetic drift approach. Let us consider Ru,vwas an derived byHill(1979) with r5 Nf/Nm, as expected.
example. By definition,
Inbreeding approach: Under the same assumptions, the
above equations can also be derived from the
inbreed-Ru,vv5
o
Nui51 [nuvi1(nuvi12 1)1nuvi2(nuvi221)]
Nv(Nv21) ing approach, which acts as a check of the genetic drift
approach and from which equations that are more easily
applied to marker-assisted selection can be obtained. 5
o
Nui51 [nuvi12 1 n2uvi22nuvi]where nuvi 5nuvi11 nuvi2is the number of offspring of
Ne5
9NmNf
2(Nf2Nm12NmQf,mf)
. (9)
sex v contributed by parent i of sex u. Inserting the within-individual variance for parent i, d2
uvi 5 (n2uvi1 1
As can be seen, the increase in Ne by MAS through n2
uvi2)/2 2 (nuvi/2)2, into the above equation yields
reducing Qf,mf, compared with random selection within Ru,vv 5 (Nu/2Nv(Nv 2 1))[suv2 1 4d2uv1 (Nv/Nu)22
families (Qf,mf 51⁄2and Ne5 9⁄2Nm), diminishes with an 2Nv/Nu], whered2uvis the average duvi2 over individuals.
increasing mating ratio (r 5 Nf/Nm). This is obvious Similarly, Ru,mf5Nu(sum,uf14dum,uf)/(2NmNf)11/(2Nu).
because the heterogametic sex (males) becomes in-Inserting these into (4) and omitting second and
higher-creasingly important in determining Newith an increas-order terms of 1/Nmand 1/Nf, (2) is retrieved.
ing mating ratio, and genetic drift from males comes In practice, it is relatively easy to minimize the
vari-solely from between-individual variance. The maximum ance in genetic contribution among individuals and
efficiency of MAS is realized when r 5 1, where Ne thus increase Ne. In the selection scheme proposed by
becomes infinite regardless of the actual size if each
Goweet al. (1959), for example, each male is mated at
gene in each female parent contributes one offspring, random with r females, and each female has one
daugh-i.e., Qf,fm 50. ter and a probability of 1/r of having one son selected
With the same assumptions made above but females as parents for the next generation. Each male,
there-being the heterogametic sex, equations corresponding fore, contributes one son and r daughters. In this case,
to (7–9) can also be derived. In this case MAS is generally
Rm,mm5Rf,mm5Rf,ff50, Rm,mf5 Qm,mf/Nm, Rm,ff 5Qm,ff
more effective, because, with an increasing mating ratio, (r21)/(Nf21), and Rf,mf5Qf,mf/Nf. Substituting these
Nedepends increasingly on the homogametic sex (males) into (4) yields
to which MAS can be effectively applied.
Ne 5
8NmNf
2NfQm,mf1 (Nf2 Nm)Qm,ff12NmQf,mf
. (5)
MARKER-ASSISTED SELECTION WITH
With equal number of males and females (Nm 5Nf5 ONE CHROMOSOME
N/2), (5) reduces further to
In this section, we use the equations derived above to obtain analytical results for the efficiency of MAS in
Ne5
2N
Qm,mf1Qf,mf
. (6)
increasing Ne. To simplify the analysis, we assume Nm5 Nf5 N/2, and each of the N/2 families has nm male If, by MAS, the alternative genes at a locus for each
and nffemale marker-genotyped offspring from which individual contribute equally to the next generation,
one male and one female offspring are selected as the
Qm,mf5Qf,mf50 and Ne→∞for the locus, irrespective next generation. The marker locus is assumed to have of the actual size N.
k codominant alleles, A1. . . Ak, segregating in the
popula-Sex-linked locus: Similar to the autosomal case, the
tion with frequencies of q1 . . . qk, respectively. All the effective population size for sex-linked loci of diploid
k(k11)/2 marker genotypes can be identified pheno-species or for haplo-diploid pheno-species can be derived using
typically. both the genetic drift and the inbreeding approaches.
Autosomal loci: We first consider the marker locus
With the same assumptions made in the autosomal case
itself, then a single neutral locus linked to the marker, and if males are the heterogametic sex, both methods
and last all the loci on the same chromosome as the lead to
marker locus.
Marker locus: In (6), the value of Qu,mf(the probability 1
Ne
5 2
9rNf s2
mf that two homologous genes contributed by a parent of
sex u, one in a son and one in a daughter, are derived from the same gene from the parent) determines the
1 1
9Nf [s2
ff14d2ff1 2r(sfm,ff1 4dfm,ff)
effective population size. With random within-family se-lection of offspring, two genes from the same parent
1 r2(s2
fm14d2fm)] (7)
come equally frequently from the same gene and from
or alternative genes, resulting in Qu,mf 5 0.5. If offspring
are selected on marker information to minimize the
Ne5 9/[2(Pm,ff 1Rf,mm12Rf,mf1 Rf,ff)]. (8)
probability of identity by descent of homologous genes from the same parent, then Qu,mfis made,0.5. As can be seen from these equations, genetic drift or
inbreeding due to genetic sampling within individuals Now consider how to minimize the Qu,mf for the marker locus in a random mating population by MAS. comes solely from the homogametic sex (females
herein). According to the marker genotypes, the matings can be
classified into four types. The marker genotypes of With the selection scheme ofGoweet al. (1959), we
have Rf,mm 5 Rf,ff 5 0, Pm,ff 5 (r 2 1)/(Nf 2 1), and mated parents can be two homozygotes, one homozy-gote and one heterozyhomozy-gote, two identical heterozyhomozy-gotes,
and two nonidentical heterozygotes with probabilities of occurrence (12 H )2, 2H(12 H ), D, and H2 2 D, respectively, where
H5 12
o
k i51 q2iis the expected heterozygosity and
D5
o
kj.i51(2qiqj)2
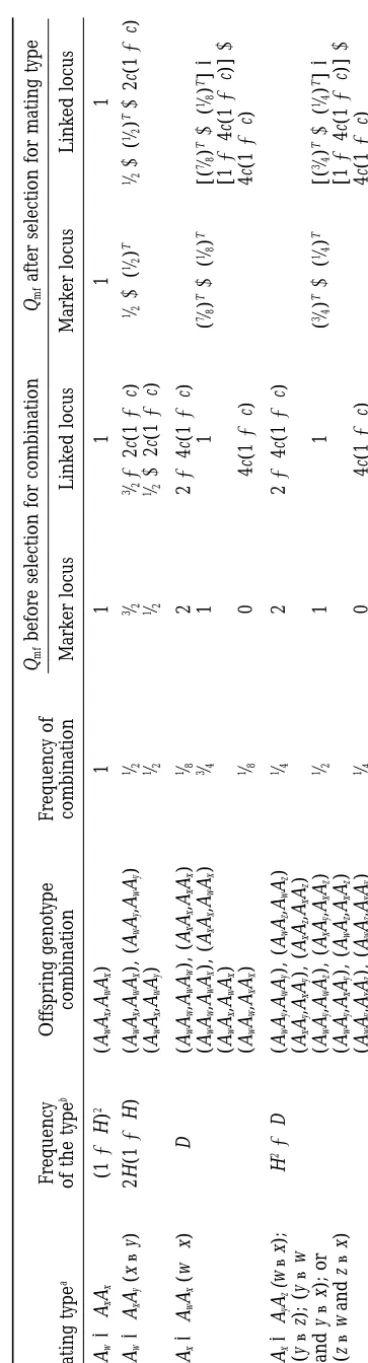
is the expected frequency of mating between identical heterozygotes. For each mating type, the expected fre-quencies of different offspring genotypes and thus the probabilities of different combinations of offspring ge-notypes can be calculated, and for each kind of combi-nation, the expected values of Qmf5Qm,mf1Qf,mfbefore and after MAS can be determined. These results are listed in Table 1.
Let us consider selection within each family to mini-mize Qmf, using the type of mating between nonidentical heterozygotes as an example. This mating type gener-ates three possible kinds of full-sib pairs of offspring, denoted as Y1, Y2, and Y3occurring at frequencies1⁄4,1⁄2, and 1⁄
4 with corresponding Qmf values of 2, 1, and 0, respectively (Table 1). If each family gives nmmale and nffemale offspring (family size is nm1nf) and thus T5 nmnfpossible pairs of offspring of different sexes, then the T pairs contain one or more pairs of kind Y3 with probability 12(3⁄
4)T, one or more pairs of kind Y2with probability (3⁄
4)T 2(1⁄4)Tgiven that no pairs of kind Y3 appear, and all pairs of kind Y1 with probability (1⁄4)T. Using these probabilities, the expected value of Qmfcan be minimized, after selection, to
03 [12(3⁄
4)T]1 13 [(3⁄4)T2(1⁄4)T]123(1⁄4)T
5(3⁄
4)T 1(1⁄4)T.
The corresponding values of Qmf after selection for other mating types can be obtained similarly and are listed in Table 1. Averaging these across mating types weighted by their frequencies of occurrence gives
Qmf512B, (10)
where
B5H22H(12H)(1⁄
2)T2D[(7⁄8)T1 (1⁄8)T]
2(H22 D)[(3⁄
4)T1 (1⁄4)T]. (11)
Given marker allele frequencies (qi), and numbers of male and female offspring per family (nm, nf, and thus T5nmnf) available and genotyped for selection, we can use (10), (11), and (6) to predict Ne for the marker locus.
As can be seen from (10), (11), and (6), Neincreases monotonically with T, but with diminishing effects. For a fixed value of T, nm or nf does not affect Qmfor Ne.
TA BL E 1 Marker-assisted selection with equal numbers of males and females for autosomal loci Qmf before selection for combination Qmf after selection for mating type Frequency Offspring genotype Frequency of Mating type a of the type b combination combination Marker locus Linked locus Marker locus Linked locus Aw Aw 3 Ax Ax (1 2 H ) 2 (A w Ax ,Aw Ax )1 1 1 1 1 Aw Aw 3 Ax Ay (x ≠ y)2 H (1 2 H )( Aw Ax ,Aw Ax ), (A w Ay ,A w Ay )
1⁄2 3⁄2 3⁄2
2
2
c(1
2
c)
1⁄2
1
(
1⁄)2
T
1⁄2
1
(
1⁄)2
T1 2 c(1 2 c) (A w Ax ,Aw Ay )
1⁄2 1⁄2 1⁄2
1 2 c(1 2 c) Aw Ax 3 Aw Ax (w ? x) D (A w Aw ,A w Aw ), (A x Ax ,A x Ax )
1⁄8
22 2 4 c(1 2 c) (A w Aw ,A w Ax ), (A x Ax ,Aw Ax )
3⁄4
11
(
7⁄)8
T1
(
1⁄)8
T
[(
7⁄)8
T1
(
1⁄)8
T] 3 (A w Ax ,Aw Ax ) [1 2 4 c(1 2 c)] 1 (A w Aw ,A x Ax )
1⁄8
04 c(1 2 c)4 c(1 2 c) Aw Ax 3 Ay Az (w ≠ x); H 22 D (A w Ay ,A w Ay ), (A w Az ,Aw Az )
1⁄4
22 2 4 c(1 2 c) (y ≠ z); (y ≠ w (A x Ay ,Ax Ay ), (A x Az ,Ax Az ) and y ≠ x); or (A w Ay ,A w Az ), (A x Ay ,Ax Az )
1⁄2
11
(
3⁄)4
T1
(
1⁄)4
T
[(
3⁄)4
T1
(
1⁄)4
T] 3 (z ≠ w and z ≠ x)( Aw Ay ,A x Ay ), (A w Az ,Ax Az ) [1 2 4 c(1 2 c)] 1 (A w Ay ,A x Az ), (A w Az ,A x Ay )
1⁄4
04 c(1 2 c)4 c(1 2 c) aSubscripts w , x, y, z 5 1... k refer to k codominant marker alleles with frequencies qi (i 5 1... k). Without specification, w , x, y, and z can be equal. bHeterozygosity at the marker locus is H 5 R
k j.i
5 1 2 qi qj . The frequency of mating between identical heterozygotes is D 5 R
k j.i
5 1 (2 qi qj ) 2.
all offspring must be retained, and Qmf5 1 from (10)
Ne≈
2N
12 (122c)2H, (14)
and Ne 5 2N from (6), as expected. With increasing values of T, Qmfquickly asymptotes to 12 H, and Neis
maximized to 2N/(1 2H) for the marker locus. indicating that N
ecan be increased by a factor of 1/(12 Equations 10, 11, and 6 also show that Neincreases H) for a locus completely linked to the markers by using monotonically with H, the heterozygosity at the marker MAS in a fecund species. When the marker locus is locus. This is intuitively obvious, because two marker completely informative so that H≈1 and D≈0 (due to genes from a homozygous parent, chosen from separate many alleles with similar frequency), the expression for offspring, are identical in state and their identity by effective size from (13), (11), and (6) reduces to descent cannot be determined. In one extreme where
H50 and thus D50, (6) reduces to Ne52N because
Ne5
2N 12(1 22c)2[12 (3⁄
4)T2 (1⁄4)T]
. (15)
all offspring in a family have the same marker genotype and therefore MAS cannot be conducted in this case.
For a small number of genotyped offspring per family In the other extreme of a large number (k) of marker
available for MAS (T small) and a partially informative alleles with similar frequencies, H ≈ 1 and D ≈0, and
marker locus (H , 1), the quantitative relationships the effective size for the marker locus is maximized to
among Ne, H, T, and c are not clearly seen from (13) Ne52N/[(3⁄4)T1(1⁄4)T].
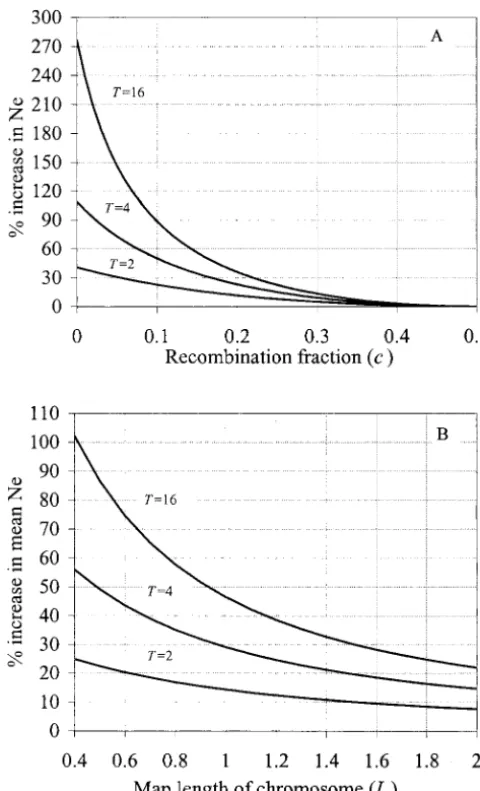
and (6) but are important in practice. Some numerical For a given H value, the value of D increases with an
examples, therefore, are obtained from these equations increasing difference in frequency among the k(k 2
1)/2 different heterozygotes. As can be seen from (10) and shown in Figure 1A, assuming four marker alleles and (11), Qmfincreases monotonically with D for a fixed of equal frequency. The effect of MAS is expressed as value of H. This is because the origins (by descent) of the percentage increase in effective size relative to 2N, marker genes in heterozygous offspring from matings the value without MAS. As can be seen, the effect of between parents heterozygous for the same marker al- MAS diminishes quickly with increasing recombination
leles cannot be identified (Table 1). fraction (c) between the marker locus and the locus in
For a given number of alleles at the marker locus (k), question for a given family size (or value of T ). For the ideal situation is that all the k different alleles have a small value of c, the magnitude of effect increases the same frequency of 1/k, where H is maximized and dramatically with increasing values of T when T is small,
D minimized and therefore MAS is most efficient. In and increases little when T is large (say T.16).
this case (11) reduces to In Figure 1A, four marker alleles of equal frequency
were assumed, where H 5 3⁄
4 and D 5 3⁄32. Increasing B5(k21) {k222k(1⁄
2)T2(k22k22)[(3⁄4)T1(1⁄4)T] the value of k and the difference in allele frequency simultaneously so that H53⁄
4is kept constant leads to a 22[(7⁄
8)T1(1⁄8)T]}/(k3). (12)
slight decrease in MAS efficiency, because D is increased compared with the ideal situation (qi51/k). The
effi-Linked locus: Now consider an unknown locus linked
ciency of MAS increases with heterozygosity at the to the marker locus. Qmffor this locus is also decreased
marker locus. This is evident for a large family size (say by MAS, because recombinant gametes are less frequent
T.16) or when H is small (say H,3⁄
4) for a small family than parental gametes. The magnitude of the positive
size. Otherwise, MAS efficiency is mainly restricted by correlation between Qmffor the marker locus and that
family size, not by the amount of marker information for another locus depends on the recombination
fre-(H) available for MAS. quency (c) between them. Derivations similar to (10)
One chromosome: Now, let us consider the average Ne can be made using Table 1, and an expression for Qmf
for all loci on a chromosome of length L Morgans. for the linked locus is
Without MAS, all loci have the same expected Ne. If offspring are selected from within families on marker
Qmf512(1 22c)2B, (13)
information as shown above, then different loci have different expected values of Ne, depending on their where B is given by (11). With complete linkage (c 5
positions relative to the marker locus. We consider the 0), (13) reduces to (10). With free recombination (c5
harmonic mean value of Neand the variance of 1/2Ne 0.5), (13) reduces to Qmf51 and MAS has no effect on
over all loci on the chromosome, which signify the mean
Nefor the locus, irrespective of H, D, and T.
and variance in the expected rate of decrease in hetero-The relationships between Ne(or Qmf) and H, D, and
zygosity across loci.
T for the marker locus are still applicable to the linked
If the marker locus is situated L1Morgans from one locus, but the relationships become looser with an
in-end of the chromosome and all the other loci are distrib-creasing recombination fraction between the loci. When
uted uniformly along the chromosome, then the har-the species is fecund so that T is large (say T5nmnf.
monic mean Ne over loci can be calculated, from (6) 16), Qmf≈12(122c)2H approximately from (11) and
TABLE 2
Percentage increase in effective size by MAS: one marker locus per chromosome
Number of chromosomes Mating Family
ratio size 1 5 10 15 20 30
1 4 28.9 14.1 10.0 9.3 6.9 5.7
8 48.4 26.3 17.7 14.4 11.3 9.2
16 48.6 35.1 23.5 19.0 15.9 13.1
32 50.7 42.7 28.4 23.0 20.6 14.5
3 4 28.3 12.9 10.0 8.1 6.2 5.4
8 29.1 19.1 13.3 10.9 10.0 7.4
16 28.9 21.0 18.2 15.2 13.3 10.0
32 29.7 27.9 20.5 16.2 13.6 11.4
6 4 19.7 12.6 9.0 7.4 7.1 4.9
8 25.6 16.6 12.1 9.7 8.9 6.9
16 25.4 19.5 14.6 11.5 11.3 9.7
32 25.8 21.8 17.3 13.2 12.0 10.4
12 4 19.5 9.9 7.6 7.1 6.0 4.9
8 21.9 14.5 10.3 9.5 7.8 6.3
16 22.0 16.8 13.2 10.5 9.7 6.9
32 22.3 18.2 14.6 12.6 10.7 7.5
One marker locus with four codominant alleles of equal frequency is assumed to be situated at the center of each chromosome of 1 M in map length. Of the offspring per mother (family size), half are males and half females. The effect of MAS is expressed as the percentage increase in effec-tive size relaeffec-tive to that with random within-family selection of offspring under the selection scheme ofGoweet al. (1959)
[i.e., Ne516NmNf/(3Nf1Nm)].
In Figure 1B, the relative increase in Ne by MAS is
Figure1.—The effect of MAS for autosomal loci. (A) The plotted against the length of the chromosome with three
percentage increase in effective size (relative to 2N) by MAS for values of T, assuming four marker alleles of equal fre-a single locus linked to the mfre-arker locus, with recombinfre-ation
quency (1/4) and L15L25L/2. As can be seen, MAS fraction c. (B) The percentage increase in effective size
(rela-is very effective in increasing Ne. For a chromosome of tive to 2N) by MAS averaged over all loci on an autosome of
1 M, for example, the (harmonic) mean effective size
L Morgans. The graphs are generated assuming equal
contri-bution among families, N/2 individuals of each sex in the is increased by 29 and 47% by MAS when T5 4 and population, T possible pairs of male and female offspring per T516, respectively, compared with random selection family genotyped for selection, and a single marker locus with
within families. These analytical results are in close four codominant alleles of equal frequency. For B, the marker
agreement with simulation results listed in Table 2 to locus is also assumed to be situated at the center of the
chromo-be explained in the next section. some.
As for a single linked locus, MAS efficiency for the whole chromosome increases with increasing heterozy-gosity at the marker locus, and so Ne can be further 1
Ne 5 1
L
#
L1
0
12 (122cx)2B
2N dx increased by MAS with a more informative marker locus.
If it has eight codominant alleles of equal frequency,
1 1 L
#
L2
0
12 (122cx)2B
2N dx, (16) for example, the mean effective size for a chromosome
of length 1 M can be increased by 36% when T5 4 where L2 5 L 2 L1, and cx 5 1⁄2 (1 2 e22x), which is and by 60% when T516.
Haldane’s mapping function with x being the map dis- Different loci across the chromosome vary much tance between the marker and another locus. Integra- more in the rate of inbreeding or genetic drift with
tion of (16) gives MAS than with random within-family selection. For the
latter, different loci have the same expected rate of
Ne5
8LN
of the variance of the expected rate of inbreeding [1/ 2Ne, calculated from (6) and (13)] among loci on a chromosome. Using a method similar to the derivation of (17), we obtain the variance
Vr5
1
B16LN
2
2f
2L(22e28L12e28L2)2(22 e24L12 e24L2)2
g
, (18)where B is given by (11). An analysis of (18) shows that, for a given chromosome length and marker position,
Vrincreases with the effectiveness of MAS. With an in-creasing length of chromosome, Vr first increases and then decreases. The maximum value of Vr, for the case in Figure 1B, is realized at about L51.6 M.
Sex-linked loci:With the same procedure and under
the same assumptions made above for the autosomal case except for removing the restriction of Nm5Nf, Qf,mf for a sex-linked locus can be minimized by MAS to
Qf,mf5 1⁄221⁄2(122c)2[12 (1⁄2)T21]H, (19)
where H is the expected heterozygosity at the marker locus in the homogametic sex (females). With k marker alleles of equal frequency, H 5 12 1/k and (19) be-comes
Qf,mf 51⁄22 (k21)(122c)2[12(1⁄2)T21]/(2k).
Under the selection scheme ofGoweet al. (1959), the
effective size for a linked locus with MAS can be calcu-lated by (19) and (9). The mean effective size over all loci on a sex chromosome can be derived in a way similar to the autosomal case, which is
Figure2.—The effect of MAS for sex-linked loci. (A) The
percentage increase in effective size (relative to9⁄
4N) by MAS Ne5
18LNmNf
4LNf2H(120.5T21)(22e24L12 e24L2)Nm
. (20) for a single locus linked to the marker locus, with recombina-tion fracrecombina-tion c. (B) The percentage increase in effective size (relative to9⁄
4N) by MAS averaged over all loci on a sex chromo-The variance of the expected rate of inbreeding among some of L Morgans. The graphs are generated assuming equal
loci is contribution among families, N/2 individuals of each sex in
the population, T possible pairs of male and female offspring per family genotyped for selection, and a single marker locus
Vr5
1
(1 20.5T21)H
36LNf
2
2
f
2L(22e28L12e28L2) with four codominant alleles of equal frequency. For B, the marker locus is also assumed to be situated at the center of the chromosome.2(2 2e24L12 e24L2)2
g
. (21)As can be seen, the heterogametic sex (males) does
MARKER-ASSISTED SELECTION WITH not affect Vr because MAS can be applied only to the
MULTIPLE CHROMOSOMES homogametic sex.
Numerical examples are shown in Figure 2, using the It becomes much more complicated to derive an ex-same parameters as in Figure 1 for autosomal loci. MAS plicit expression for Qu,mfwhen multiple chromosomes is always more effective for sex-linked loci than for au- or multiple marker loci on a single chromosome are tosomal loci. This difference is especially evident when involved in MAS, or when Nm?Nfwith autosomal inheri-family size is small. This is because, unlike the autosomal tance. In the following, therefore, MAS is applied to case, the origin of any marker gene in offspring can be the general case of a population with arbitrary numbers identified if the mother (homogametic sex) is heterozy- of males and females, one or two marker loci per chro-gous at the marker locus, and also because marker- mosome, and multiple autosomes by using stochastic assisted selection can be focused only on Qf,mf for sex- simulations.
Similar to the case of a single marker locus on a single of 0 to L1and 0 to L2, assuming Haldane’s mapping function.
chromosome shown in Figures 1B and 2B, however,
MAS should be more effective for sex-linked than au- 2. The two marker genes are identical. The conditional value of Qu,vw, averaged over loci on the chromosome, tosomal loci under the same conditions.
In the simulation model, the chromosome length (in can be derived as Morgans), the number of marker loci, and their
posi-Q1512 Q0, (23) tions are assumed to be the same for all chromosomes.
Each marker locus is assumed to have k codominant where Q
0is given by (22). alleles of equal frequency. These assumptions are not
In addition to the above two basic cases, it is possible necessary and can easily be removed in practical
applica-that the two marker genes from the parent, one in each tions, as will be discussed.
offspring, are identical by descent with probability1⁄
2.
At each discrete generation, each of the Nmmales is
This occurs when either the parent is homozygous, or mated at random with r5 Nf/Nmfemales, resulting in
the parent, its mate, and the two offspring are identical
Nm paternal half-sib families each consisting of r
full-heterozygotes (Table 1). In this case, markers give no sib families. Each mother has an equal number (n) of
information on gene origins, and selection of the two offspring of each sex that are marker-genotyped for
offspring gives an expected value of Qu,vwof 1⁄2 for any MAS. Under the between-family selection scheme of
locus on the chromosome. The average value of Qu,vw Gowe et al. (1959), each paternal half-sib family has
over loci on the chromosome is1⁄
2Q011⁄2Q15 1⁄2.
rnr11 possible combinations of offspring for selection,
Simulation procedure: A stochastic simulation program
each combination consisting of one son and r daughters
was developed for using MAS to increase effective size. (one from each mother). The problem for MAS is to
At each generation, MAS was carried out independently select, from each paternal half-sib family, the
combina-for each paternal half-sib family as follows. Under the tion that minimizes the average value of 2rQm,mf1(r2
selection scheme ofGoweet al. (1959), each paternal
1)Qm,ff12Qf,mf[the denominator of (5)] for all loci over
half-sib family gives rnr11 possible combinations of off-all chromosomes, given the marker genotypes of the
spring available for MAS, each combination consisting parents and offspring in the half-sib family.
of one son and r daughters (one from each mother). The problem simplifies because markers on different
For each combination, the mean Qf,mf value for each chromosomes are independent so that different
chro-chromosome was calculated using (22 and 23) given mosomes can be considered separately. First, therefore,
the marker genotypes of the full-sib brother and sister expressions are derived for the average value of Qu,vw
and their parents, and averaged over chromosomes. over loci on a single chromosome given its marker
geno-Qm,mfwas calculated similarly for each pair of male and types of the parent of sex u, the mate, and two offspring
female offspring and averaged over the r pairs. Qm,ff of sexes v and w, respectively. Second, these expressions
was calculated for each pair of female offspring and are used to obtain the average values of Qu,vw for the
averaged over the r(r 2 1)/2 pairs. The combination whole genome, which are then used in calculating
that yielded the minimum value of 2rQm,mf1(r21)Qm,ff 2rQm,mf1(r21)Qm,ff12Qf,mffor each offspring
combina-12Qf,mf for the paternal half-sib family was selected as tion in a paternal half-sib family. The combination that
the next generation. gives the minimum value is selected from the half-sib
A total number of 174 loci, each with two alleles of family.
equal frequency, equally spaced on each chromosome
One marker locus per chromosome:The marker
lo-were simulated and the realized mean effective size was cus is assumed to be located L1and L2M from the two
calculated from both the heterozygosity, averaged over ends of the chromosome (L5L11 L2).
loci and replicate runs, and the variance of allele
fre-Average Qu,vw over loci on a chromosome conditional on
quency among replicate runs, averaged over loci. The
marker genotypes: By comparing the marker genotypes
two methods yielded essentially the same results, which for a single chromosome in the parent of sex u, its mate,
were averaged as the realized mean effective size. Effec-and two offspring of sexes v Effec-and w, respectively, the
tive size was also calculated from pedigree information, origins of the two marker genes contributed by the
and in all the simulation runs it fitted closely with the parent and received by the two offspring can be
deter-prediction Ne 5 16NmNf/(3Nf 1 Nm) under the selec-mined, and two basic scenarios are possible.
tion scheme of Gowe et al. (1959). The efficiency of
1. The two marker genes are nonidentical. The condi- MAS was expressed as percentage increase in realized tional value of Qu,vwfor a locus linked to the marker mean effective size, averaged over 20 generations, rela-with recombination fraction cxis 2cx(12cx), and the tive to the corresponding value calculated from pedi-average value over loci on the chromosome is gree or predicted by the formula. For a set of parame-ters, 500–1000 replicates were run, depending on the
Q0 51⁄22 (22e24L12e24L2)/(8L), (22)
mating ratio r.
1 M, the increases in harmonic mean effective size by left (marker 1) and right (marker 2) loci being situated
L1 and L2 Morgans to the left and right ends of the MAS are shown in Table 2 for different mating ratios,
numbers of chromosomes, and family sizes (2n). The chromosome, respectively. The distance between the marker loci is therefore L35L2L12L2. Let us consider efficiency of MAS decreases rapidly with increasing
numbers of chromosomes because, for a given family the genotypes at the two marker loci on a single chromo-some for a parent of sex u, its mate, and two offspring size, it becomes increasingly difficult to find an offspring
combination that minimizes 2rQm,mf 1 (r 2 1)Qm,ff 1 of sexes v and w and obtain the average Qu,vwover loci on the chromosome conditional on these marker geno-2Qf,mffor every chromosome. The efficiency of MAS also
changes with mating ratio. When Nm5Nf, MAS can be types.
If the parent of sex u is not a double heterozygote applied equally to male and female parents. When Nm,
Nf, however, each of the Nf 2Nmmothers contributes for the marker loci, the average Qu,vw over loci can be calculated by (22) and (23) in the previous section. If only one daughter to the next generation and there is
no chance of MAS for these mothers. On the other the parent is a double heterozygote, three basic scenar-ios are possible.
hand, Nm,Nfalso ensures more offspring available for selection from each male parent. The above two factors
1. If the two pairs of homologous marker genes from counteract on MAS efficiency. In the extreme case,
the parent, one gene of each pair in each of the two where each mother has only one offspring of each sex
offspring, are nonidentical, the average Qu,vw over available for selection, MAS cannot be applied if Nm5
loci on the chromosome can be derived, similarly to
Nfbut is still effective if Nm,Nf, because offspring can
(22), as be selected to minimize the variation in contribution
between alternative genes at a locus within male parents.
Q0,0(P)51⁄22
12 e24L314L3e22L3 4L(11 e22L3)2 The efficiency of MAS increases with an increasing
number of offspring per mother (family size) that are
marker-genotyped for selection, particularly when fam- 222e24L12e24L2
8L (24)
ily size is small and thus is the restricting factor for MAS. Given the other parameters, the efficiency of MAS
if the two offspring receive parental gametes, and as asymptotes to its maximum with increasing family size.
In Table 2, this is evident when the number of
chromo-somes is small. For a larger mating ratio (r), the maxi- Q0,0(R)51⁄
2 2
12e24L32 4L3e22L3 4L(12e22L3)2 mum efficiency of MAS is attained at a smaller family
size, because, with large r, the effect of MAS is realized
2 22 e24L12e24L2
8L (25)
mainly through male parents, which have more off-spring (2nr) to select from.
Results for other values of L, L1, and k were also if they receive recombinant gametes. Because the obtained (not shown). Similar to the simple case shown linkage phase of the parent may not be identifiable, in Figure 1B, MAS efficiency increases with a decreasing the average of (24) and (25) weighted by their rela-length of chromosomes and increasing numbers of tive frequencies of occurrence,
marker alleles per locus (or marker heterozygosity H). This is most significant when family size is large so that
Q0,051⁄22
12e24L3
4L(11e24L3)2
22e24L12e24L2
8L , (26)
the amount of marker information is the restricting factor of MAS efficiency. The maximum efficiency of
MAS is realized when the marker is situated at the center is used as the selection criterion, which depends of the chromosome (L15L/2), where the marker has mainly on (24) if L3is small.
the minimum average recombination fraction with all 2. If, of the two pairs of homologous marker genes from
loci on the whole chromosome. the parent and inherited by the two offspring, only
Two marker loci per chromosome:The efficiency of the pair at locus 1 is nonidentical, then the average
MAS can be improved by using more than one marker Qu,vwover loci on the chromosome is derived as locus on each chromosome, because the average
recom-Q0,15 1⁄22(e24L22 e24L1)/(8L). (27) bination fraction between the markers and the other
loci is decreased, and also because the amount of marker
If only the pair at locus 2 is nonidentical, (27) applies information per chromosome useful in MAS is
in-by switching L1 and L2. creased. In the following, we consider only two marker
3. If both pairs of homologous marker genes from the loci per chromosome, because more marker loci can
parent and inherited by the two offspring are identi-be utilized similarly but incur diminishing extra identi-benefits
cal, then the average Qu,vwover loci on the chromo-due to the restricting factor of family size in practice.
some is
Average Qu,vwover loci on a chromosome conditional on marker
TABLE 3 ciency is the amount of marker information and its relevance to all loci over the whole chromosome. When
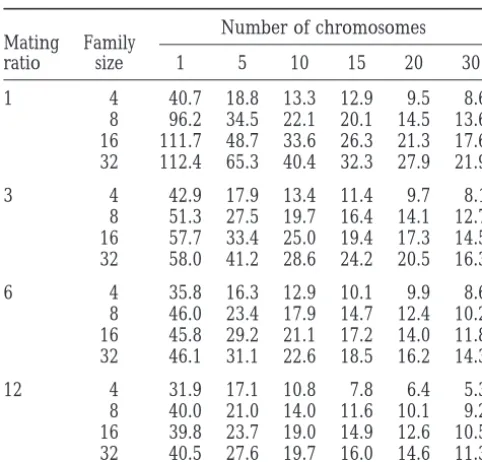
Percentage increase in effective size by MAS: two marker
either family size is small or chromosome number is
loci per chromosome
large so that the efficiency of MAS is less restricted by marker information, the increase is less substantial. Number of chromosomes
Mating Family In Table 3, four marker alleles of equal frequency
ratio size 1 5 10 15 20 30
per locus are assumed. The probability of double
hetero-1 4 40.7 18.8 13.3 12.9 9.5 8.6 zygotes for the marker loci on a chromosome isz56%.
8 96.2 34.5 22.1 20.1 14.5 13.6 If more informative marker loci are used, MAS efficiency 16 111.7 48.7 33.6 26.3 21.3 17.6 with two marker loci per chromosome is expected to 32 112.4 65.3 40.4 32.3 27.9 21.9 increase further. For example, with the same parameters
3 4 42.9 17.9 13.4 11.4 9.7 8.1 used in Table 3 but with six alleles of equal frequency
8 51.3 27.5 19.7 16.4 14.1 12.7 per marker locus, the mean effective size of a population
16 57.7 33.4 25.0 19.4 17.3 14.5 with an equal number of males and females is increased
32 58.0 41.2 28.6 24.2 20.5 16.3 by 16.6% when a family size of 8 and 20 chromosomes
6 4 35.8 16.3 12.9 10.1 9.9 8.6 of length 1 M per haploid genome are assumed, compared
8 46.0 23.4 17.9 14.7 12.4 10.2 to 14.5% for four marker alleles per locus (Table 3).
16 45.8 29.2 21.1 17.2 14.0 11.8 As is intuitively obvious, the length of the
chromo-32 46.1 31.1 22.6 18.5 16.2 14.3 somes also affects MAS efficiency with two marker loci
12 4 31.9 17.1 10.8 7.8 6.4 5.3 per chromosome relative to that with a single marker
8 40.0 21.0 14.0 11.6 10.1 9.2 locus. The larger the chromosomes, the higher the extra
16 39.8 23.7 19.0 14.9 12.6 10.5 benefit from using double marker loci (appropriately
32 40.5 27.6 19.7 16.0 14.6 11.3 spaced) per chromosome.
The positions of the marker loci on a chromosome Two marker loci, each with four codominant alleles of equal
frequency, are assumed to be situated 1/3 M to the proximal are important to the efficiency of MAS because they (and different) ends of each chromosome of 1 M in map affect the relevance of marker information to a random length. Of the offspring per mother (family size), half are
locus on the same chromosome. For a single marker males and half females. The effect of MAS is expressed as
locus on a chromosome, it is obvious that the optimum percentage increase in effective size relative to that with
ran-marker position is the center of the chromosome. For dom within-family selection of offspring under the selection
scheme ofGoweet al. (1959) [i.e., Ne516NmNf/(3Nf1Nm)]. multiple marker loci, however, optimum positions are neither intuitively clear nor easy to tackle analytically, so we considered some examples by simulation. In addition to the above three basic scenarios, there Simulations were run to compare the effects of differ-are also other possibilities where a pair of the homolo- ent numbers of marker alleles (k) of equal frequency gous marker genes is identical by descent with probabil- per locus on the optimal marker positions. The same ity 0.5. These situations can be coped with easily by parameters as in Table 3 were used except for a fixed using (26)–(28). If, for example, the pair of genes at family size of four, an equal number of males and fe-the left marker locus is nonidentical and that at fe-the males (N520), and variable positions of the two marker right marker locus is identical with probability 0.5, then loci (L15L2) on a single chromosome of 1 M in length. the average Qu,vwover loci on the chromosome is1⁄2Q0,0 The results (not shown) indicate that the maximum 11⁄
2Q0,1. efficiency of MAS is realized when L1or L2isz0.3 M if
Simulation results: Simulation results for the efficiency k54 or 8, and when L1or L2isz0.4 M if k52. This of MAS using double marker loci per chromosome were is because the optimal positions depend partly on the obtained by the same simulation procedure shown relative frequencies of single and double heterozygotes above, except for calculating the average Qu,vwover loci at marker loci. If heterozygosity for any marker locus is on a chromosome by (26)–(28) if a parent was double very small so that double heterozygotes are rare, MAS
heterozygous for the marker loci. is mostly based on the single informative marker locus
When k 5 4 and L 5 3L1 5 3L2 5 3L3 5 1 M, the and therefore the optimal position is the center of the increases in effective size averaged over all loci on all chromosome.
effi-mal positions also change with generations and move dominant marker loci scattered on the chromosome can easily compensate for less information per marker gradually toward the center of the chromosome over
generations for very small populations. As population locus in determining MAS efficiency. The dominance relationship among marker alleles, therefore, does not size increases, the optimal positions become
increas-ingly less sensitive to the changes in N and generations. preclude the use of MAS in practice.
Variation in mating ratio:The results in Tables 2 and
Mating ratio, number of chromosomes per haploid
ge-nome, map length of a chromosome, and family size 3 were obtained with the assumption that each male was mated to r females under the between-family selection do not affect the relative optimal positions.
scheme of Goweet al. (1959). Different mating ratios
among males do not change MAS efficiency substan-SOME EXTENSIONS TO tially, however. Consider an extreme situation that half MARKER-ASSISTED SELECTION the males mate with a single female each, and half mate with 2r21 females each. Corresponding to the case of
Dominant markers: In developing the above MAS
r53, 2n58, and 20 chromosomes, which gives a MAS methods, marker alleles are assumed to be codominant,
efficiency of 14.1% in Table 3, the above extreme mating the usual situation for microsatellite DNA markers.
scheme results in a MAS efficiency of 11.6%. In practical Other markers such as RAPDs and RFLPs, however,
breeding programs aimed at maintaining genetic varia-generally have dominant relationships among alleles,
tion, mating ratios are controlled and so much less vari-and obviously are less informative than codominant
able. markers because dominant homozygotes and
heterozy-gotes cannot be distinguished. The MAS method
devel-oped in the simulation section also applies to dominant DISCUSSION
markers, but the frequency with which the origins of
MAS to increaseNeand its efficiency:With the
devel-markers cannot be identified is increased and thus MAS
opment of highly variable molecular markers and the efficiency is decreased compared with codominant
decrease of genotyping cost, genetic markers have re-markers having the same number and frequencies of
ceived increasing attention as an aid to the conservation alleles.
of genetic variability in both captive and natural popula-Let us consider the simple example of MAS based on a
tions. They are used, for example, to infer the relation-single marker locus with two alleles showing a dominant
ship among founders in populations of endangered spe-relationship in a population with equal numbers of
cies so that genetic management can be optimized males and females. Using a procedure similar to the
(Haig et al. 1994), to identify distinct populations of
case of codominant markers as shown in Table 1, we
the same species, and to determine their genetic rela-obtain (13) with now
tionships (Butleret al. 1994) so that priorities for con-B54⁄
9q2 (12q)2[324(5⁄8)T 28(1⁄16)T] servation or reintroduction can be appropriately set. The applications of genetic markers in conservation
1 2q3(1 2q)[12 2(1⁄
2)T], (29)
genetics have been reviewed recently by O’Brien
(1994),Frankham(1995), andHaig(1998). where q is the frequency of the recessive allele. An
analy-sis of (29) shows that the maximum value of B, and thus An important but less studied issue about genetic markers in conservation is their optimal use in minimiz-the maximum MAS efficiency, are realized when q ≈
0.7, irrespective of T and c. This is understandable be- ing the rate of loss of genetic variability in small popula-tions over generapopula-tions. Marker-based selection strate-cause q ≈ 0.7 gives an equal frequency (0.5) of each
phenotype. gies proposed previously, such as frequency-dependent
selection or selection for heterozygosity at marker loci, Using (29), (11), (13), and (6), the efficiency of MAS
with dominant markers relative to that with codominant are less powerful than the selection procedure devel-oped here, because the marker information available markers can be evaluated, assuming a single biallelic
marker locus. The relative efficiency with dominant (such as marker locations on a chromosome, the marker information for parents, and the relationship among markers decreases with decreasing c and increasing T,
with the minimum occurring when q is between 0.3 offspring) is not fully utilized in these selection schemes. Maximizing the overall expected heterozygosity of se-and 0.4, insensitive to T se-and c. Relative to codominant
markers, MAS with dominant markers results in a reduc- lected individuals based on marker and pedigree infor-mation is powerful, but its implementation is highly tion in the average effective size of up toz13% if L5
1 M and 20% if L 5 0.5 M when T is large and q 5 computing-demanding (Toroet al. 1999). Simulations
of some examples show it leads to similar increases in 0.3–0.4. These examples are extreme cases where the
restricting factor to MAS efficiency is the amount of Ne to the method proposed here. In this article, we derived equations showing explicitly that genetic drift marker information. In practice, however, the
among individuals and between alternative genes at a same number of marker loci per chromosome), how-ever, does not change the conclusions in principle. locus within individuals. If the between-individual
varia-tion is controlled by equalizing family size and the Let us consider some extensions of our model and some particular complexities in its application to conser-within-individual variation minimized by the MAS
method developed in this study, the effective population vation practice. Although the between-family selection scheme ofGoweet al. (1959) is considered throughout
size of diploid species can be made infinite in principle,
regardless of the actual population size. In practice, this article, we should emphasize that the MAS method developed herein applies to any other between-family however, several factors limit the efficiency of MAS.
One restrictive factor is the amount of marker infor- selection schemes. It minimizes the within-individual variance in genetic contribution and thus maximizes Ne mation available for MAS and the marker’s adequacy
to represent the genome. To increase the efficiency of under a given between-family selection scheme. It does not guarantee global maximization of Ne, which relies MAS, therefore, highly variable genetic markers, such
as polymorphic microsatellites, and more marker loci on, among other factors, the simultaneous optimization of the mating scheme, between-family selection scheme, appropriately spaced on each chromosome should be
used. In reality, however, there is biological or economic and within-family selection by MAS.Wang(1997a) pro-posed a selection scheme and a mating (random group limitation to the exploitation of both the variability per
marker locus and the number of marker loci per chro- mating) scheme for the case of different numbers of males and females. Compared with the selection scheme mosome.
Another restrictive factor is the number of offspring ofGoweet al. (1959) under random mating, the
pro-posed selection and mating schemes in combination per family that are marker genotyped for selection.
Fe-cundity is crucial for the efficiency of MAS in species can increase the effective size by 19% for autosomal loci and by 50% for sex-linked loci (Wang1997a). The best with a large genome and a small mating ratio. If the
mating ratio is large, the effect of MAS is realized mainly between-family selection scheme is to minimize the aver-age coancestry among the selected offspring based on by minimizing the variation in contribution between
alternative genes within male parents. In this case, fe- pedigree information. If marker-assisted within-family selection is incorporated into these between-family se-cundity becomes less restrictive to MAS efficiency
be-cause the number of offspring per male parent is large lection systems, they should become more effective. In a population with equal numbers of males and even if full-sib family size is small. For nonprolific
spe-cies, such as some large mammals, reproductive technol- females, the between-family variance in genetic contri-bution is minimized to zero if two offspring are selected ogies (e.g., multiple ovulation, artificial insemination,
genotyping the embryos) could be incorporated into from each family. The two offspring from each family do not, however, have to be of different sexes, as assumed in MAS to improve its efficiency.
The third restricting factor to MAS efficiency is the this article for convenience and in conformity to the selection scheme of Gowe et al. (1959) with unequal
genome size and its organization (the number and
lengths of chromosomes) of the species. MAS is more numbers of males and females. Without restriction of sexes of offspring selected from each family, (6) still efficient for species with smaller genomes and, for a
given genome size, smaller numbers of chromosomes. applies with the denominator replaced by Qm,uv1Qf,uv. The power of MAS, however, is increased by removing Obviously, MAS is more effective for species with limited
recombination, such as Drosophila, where no recombi- the restriction because more offspring combinations,
T52n22n rather than T5n2, are available for selection nation is involved in generating male gametes.
The efficiency of MAS does not change much over with a given family size of 2n (half of each sex). In Tables 2 and 3, therefore, the results for 2n54, 8, 16, generations even for very small populations (say, N,
8). In the simulations, 20 generations of MAS were car- and 32 with r5 1 correspond approximately to 2n 5 4, 6, 12, and 23, respectively if the restriction is removed. ried out. Although the heterozygosity at marker loci
and MAS efficiency tend to decrease over generations Similar arguments apply to Figures 1 and 2.
With overlapping generations, rates of inbreeding are in very small populations, the rates of decrease are much
smaller than that indicated by the average Ne for the functions of variation in life-time family size (Hill1979) and the Mendelian segregation variance within individ-genome. This is understandable because Nefor marker
loci can be extremely large with MAS, many times larger uals, as for discrete generations. There are no differ-ences in principle, therefore, in the use of MAS with than 2N or the mean Nefor the genome (Figures 1 and
2) if MAS is effective. overlapping or discrete generations, although some
practical difficulties arise with the timing of selection
Relaxing the assumptions: To simplify the analysis,
several assumptions were made in deriving the equa- decisions in applying MAS to populations with overlap-ping generations. If generations overlap, offspring from tions for effective size and in the simulations. Relaxing
these assumptions (e.g., discrete generations, equal earlier litters can be kept till later litters are born, when MAS is applied to all the offspring available from an length of different chromosomes, the same number of