Effect of stellar activity on the high precision transit light
curve
Oshagh, M.1,2,3,a, Santos, N. C.1,2,3, Boisse, I.4, Bou´e, G.5, Ehrenreich, D.6, Haghighipour, N.7, Figueira, P.1,2, Santerne, A.1,2, and Dumusque, X.8
1 Centro de Astrof´ısica, Universidade do Porto, Rua das Estrelas, 4150-762 Porto, Portugal
email:[email protected]
2 Instituto de Astrof´ısica e Ciˆencias do Espa¸co, Universidade do Porto, CAUP, Rua das
Es-trelas, PT4150-762 Porto, Portugal
3 Departamento de F´ısica e Astronomia, Faculdade de Ciˆencias, Universidade do Porto,Rua
do Campo Alegre, 4169-007 Porto, Portugal
4 Aix Marseille University, CNRS, LAM (Laboratoire d’Astrophysique de Marseille) UMR
7326, F-13388 Marseille Cedex 13, France
5 Astronomie et Syst ˜A¨mes Dynamiques, IMCCE-CNRS UMR 8028, Observatoire de Paris,
UPMC, 77 Av. Denfert-Rochereau, F-75014 Paris, France
6 Observatoire de Gen`eve, Universit´e de Gen`eve, 51 chemin des Maillettes, CH-1290 Sauverny,
Switzerland
7 Institute for Astronomy and NASA Astrobiology Institute, University of Hawaii-Manoa,
2680 Woodlawn Drive, Honolulu, HI 96822,USA
8 Harvard-Smithsonian Center for Astrophysics, 60 Garden Street, Cambridge, MA 02138,
USA
Abstract. Stellar activity features such as spots and plages can create difficul-ties in determining planetary parameters through spectroscopic and photometric observations. The overlap of a transiting planet and a stellar spot, for instance, can produce anomalies in the transit light curve that may lead to inaccurate estimation of the transit duration, depth, and timing. Such inaccuracies can af-fect the precise derivation of the planet’s radius. In this talk we will present the results of a quantitative study on the effects of stellar spots on high precision transit light curves. We show that spot anomalies can lead to the estimate of a planet radius that is 4% smaller than the real value. The effects on the transit duration can also be of the order of 4%, longer or shorter. Depending on the size and distribution of spots, anomalies can also produce transit timing variations with significant amplitudes. For instance, TTVs with signal amplitudes of 200 seconds can be produced by spots as large as the largest sunspot. Finally, we examine the impact of active regions on the transit depth measurements in dif-ferent wavelengths, in order to probe the impact of this effect on transmission spectroscopy measurements. We show that significant (up to 10%) underestima-tion/overestimation of the planet-to-star radius ratio can be measured, especially in the short wavelength regime.
1 Introduction
Stellar active region such as spots and plages which are not occulted by a transiting planet can produce outside-transit light-curve variations that can lead to a wrong estimation of planet
a e-mail:[email protected]
DOI: 10.1051/
C
Owned by the authors, published by EDP Sciences, 2015
/201
epjconf 51010 05 0
7KLVLVDQ2SHQ$FFHVVDUWLFOHGLVWULEXWHGXQGHUWKHWHUPVRIWKH&UHDWLYH&RPPRQV$WWULEXWLRQ/LFHQVHZKLFKSHUPLWV XQUHVWULFWHGXVHGLVWULEXWLRQDQGUHSURGXFWLRQLQDQ\PHGLXPSURYLGHGWKHRULJLQDOZRUNLVSURSHUO\FLWHG
parameters such as its radius and the limb darkening coefficients of the host star (e.g, Czesla et al. 2009, Csizmadia et al. 2013 ). The overlap of a transiting planet and stellar spots can produce anomalies in the transit light-curve that may also lead to an incorrect determination of planetary parameters, such as the planet radius, orbital incliantion of planet and can also cause offsets in the transit-timing measurement that can lead to a false-positive detection of a non-transiting planet by transit-timing variation (TTV) method (Oshagh et al. 2012, Oshagh et al. 2013a).
2 Effect of the stellar spot occultation on the transit time
We examine the effect of stellar spots occultation on the transit light-curve and its corre-sponding planetary transit timing. For this purpose, we generated a large number of transit light-curves for a system with a spotted star, and to understand how the spot occultation affects the transit timing of the planet, we fit these light curves with the light curve of a system in which the effect of the spot-planet overlap was not taken into account. In the fitting procedure, we allowed the depth, duration, and time of the transit to vary as free param-eters, keeping other parameters of the system constant to their values. The best fit of the no-anomaly light curve to each simulated transit light-curve with anomaly will give the best value for the transit timing. To study the effects of the planet size and the spot filling factor, we considered the radius of the planet to be Rp
Rs= 0.1 and 0.05, and generated light curves in
the spot-harboring system for a zero-brightness dark spot with a filling factor of 0.25% and 1%. We then fit again as explained above.
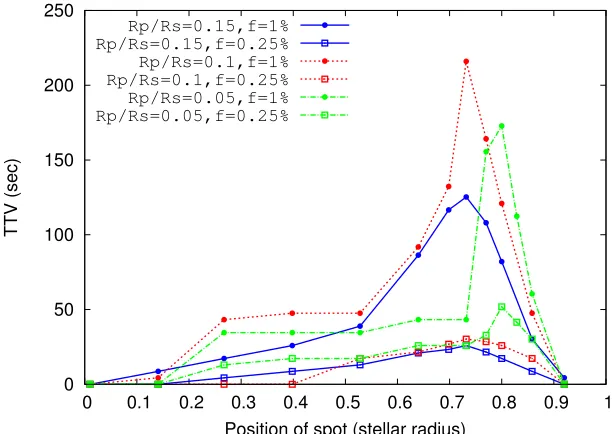
Figure 1 shows the connection between the induced TTV and the position of the planet-spot overlap. The TTVs were obtained by calculating the difference between the transit timing in the best-fit model and its known values. Interestingly, the TTV amplitudes show a different behavior from that of the transit anomaly amplitude in term of its location. As shown in the figure, significant TTVs may be produced as a result of the spot anomaly in the transit light-curve even when the amplitude of the anomaly is not so significant. Our simulations show that the highest TTV value is reached when the position of the overlap between the planet and the spot is at 0.7 stellar radii from the center of the star. This indicates that when studying the effects of spot anomalies on variations in transit timing, one can only focus on this area where the TTV has its highest value. Figure 1 also shows that for a transiting planet with RRp
s
= 0.1 overlapping a spot with a filling factor of 1%, the highest TTV value can exceed 200 s. Such a large TTV is similar to that induced by an Earth-mass planet in a mean-motion resonance with a Joviantype body transiting a solar-mass star in a three-day orbit (e.g., Bou´e et al. 2012).
3 Impact of occultations of stellar active regions on transmission spectra
Most attempts in characterizing exoplanetary atmospheres have been made by using the transmission spectroscopy (multiband photometry) of transiting exoplanets. In this approach, observations of planetary transits in different wavelengths are used to determine planet-to-star radius ratio, as a function of color. The inferred wavelength dependence of this quantity is the result of differential absorption in the planetary atmosphere (e.g, Seager & Sasselov 2000; Charbonneau et al. 2002). In most studies using transmission spectroscopy, the impact of stellar features has not been taken into account. Even in the cases of GJ436 and GJ3470, only the impact of non-occulted stellar spots has been discussed. The system of HD 189733 is the only case in which the effect of the occulted stellar spot inside the transit has been taken into account.
0 50 100 150 200 250
0 0.1 0.2 0.3 0.4 0.5 0.6 0.7 0.8 0.9 1
TTV (sec)
Position of spot (stellar radius) Rp/Rs=0.15,f=1%
Rp/Rs=0.15,f=0.25% Rp/Rs=0.1,f=1% Rp/Rs=0.1,f=0.25% Rp/Rs=0.05,f=1% Rp/Rs=0.05,f=0.25%
Fig. 1. Amplitude of the transit-timing variations as a function of the position of the planet-spot overlap, and for different combinations of the planet-to-star-radius ratio and the spot filling factor.
first time, we explore the impact of the occultation of plages (bright regions in the stellar chromosphere). We perform a large number of simulations to quantify the impact of this effect on the transit depth measurements in differentwavelengths and for various physical configurations. To demonstrate the application of our results, we apply our methodology to the planetary systems of two active stars HD 189733.
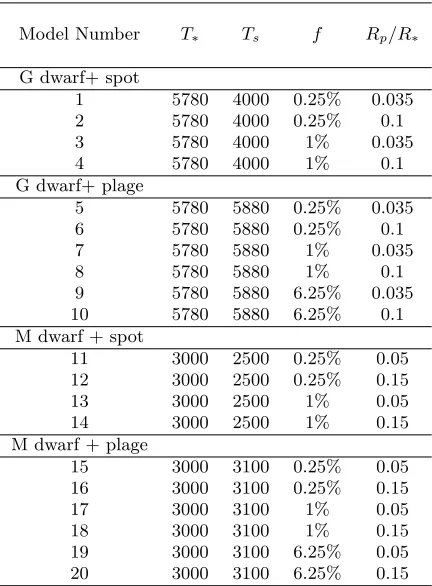
Figure 2 shows the relative error in the estimate of the planetary radius obtained from the anomaly-free fitting procedure compared to the radius of the planet that is used in generating the mock light curves (i.e., Neptune or Jupiter radii). As shown here, the underestimation or overestimation of the planet-to-star radius ratio can be quite high (∼10%), particularly on the blue side of the spectrum where the stellar active regions show higher contrast. These results also suggest that the stellar spot/plage filling factor seems to play an important role in the estimate of the planet’s radius. For instance, the maximum effect appears for the largest filling factors corresponding to models 3, 4, 9 and 10 in the models where a Jupiter- or Neptune-sized planet orbit a G-dwarf (see Table 1). It should be noted that the temperature contrast between a stellar active region and its surrounding area and the value of the filling factor impose a strong degeneracy to the estimate of the planet’s radius. That is, a variation in the temperature contrast of a spot or plage can be compensated by a properly chosen value of the filling factor, such that different combinations of temperature contrast/filling factor produce the same value for the planet’s radius.
4 Reanalyzing HD 189733b: Does it have blue sky?
-7 -6 -5 -4 -3 -2 -1 0 1 2 3
500 1000 1500 2000 2500 3000 3500 4000 4500
Δ
R / R
p [%] Wavelength (nm) G-dwarf Model 1 Model 2 Model 3 Model 4 Model 5 Model 6 Model 7 Model 8 Model 9
Model 10 -6 -4 -2 0 2 4 6 8 10
500 1000 1500 2000 2500 3000 3500 4000 4500
Δ
R / R
p [%] Wavelength (nm) M-dwarf Model 11 Model 12 Model 13 Model 14 Model 15 Model 16 Model 17 Model 18 Model 19 Model 20
Fig. 2. Graphs of the relative error in the estimate of the radius of a transiting planet as a function of wavelength calculated by comparing the value of the planet radius obtained from the best-fitted anomaly-free light-curve with that obtained from the light-curve by taking the effects of stellar spots and plages occultation into account. Different colors correspond to different models, as described in Table 1.
Table 1.Detailed parameters of our models.
Model Number T∗ Ts f Rp/R∗
G dwarf+ spot
1 5780 4000 0.25% 0.035 2 5780 4000 0.25% 0.1
3 5780 4000 1% 0.035
4 5780 4000 1% 0.1
G dwarf+ plage
5 5780 5880 0.25% 0.035 6 5780 5880 0.25% 0.1
7 5780 5880 1% 0.035
8 5780 5880 1% 0.1
9 5780 5880 6.25% 0.035 10 5780 5880 6.25% 0.1 M dwarf + spot
11 3000 2500 0.25% 0.05 12 3000 2500 0.25% 0.15
13 3000 2500 1% 0.05
14 3000 2500 1% 0.15
M dwarf + plage
15 3000 3100 0.25% 0.05 16 3000 3100 0.25% 0.15
17 3000 3100 1% 0.05
18 3000 3100 1% 0.15
10
3Wavelength (nm)
0.154
0.155
0.156
0.157
0.158
Radius
ratio
(k)
Pont-2008 (ACS)
Sing-2011 (STIS)
Knutson-2012 (Spitzer)
Plage, f=1.96%
Fig. 3. The graph of the observed transmission spectrum of HD 189733b and the reconstructed transmission spectrum by assuming the planet overlapping a stellar plage. The excess in the estimate of the planet radius-ratio in the blue side of spectrum can be reproduced by presuming a plage on the surface of HD 189733. See text for more details.
occults a stellar plage with a filling factor of 1.96% and a temperature-contrast of 100 K. As shown in Figure. 3, the observed excess in the planet radius in the bluer part of spectrum is also well matched by the predictions of the plage-occultation scenario (Oshagh et al.2014).
References
1. Bou´e, G., Oshagh, M., Montalto, M., Santos, N. C., MNRAS, 2012, 422, L57 2. Charbonneau, D., Brown, T. M., Noyes, R. W., Gilliland, R. L., ApJ, 2002, 568, 377 3. Csizmadia, S., Pasternacki, T., Dreyer, C., et al. ,A& A, 2013, 549, A9
4. Czesla, S., Huber, K. F., Wolter, U., Schroter, S., Schmitt, J. H. M. M. , A& A, 2009, 505, 1277.
5. Oshagh, M., Bou´e, G., Haghighipour, N., et al., A& A, 2012, 540, A62 6. Oshagh, M., Santos, N. C., Boisse, I., et al., A& A, 2013a, 556, A19
7. Oshagh, M.; Santos, N. C.; Ehrenreich, D.; Haghighipour, N.; Figueira, P.; Santerne, A.; Montalto, M., A& A, 2014, 568, A99