Topological Susceptibility under Gradient Flow
HéctorMejía-Díaz1,,WolfgangBietenholz1,KrzysztofCichy2,3,Philippede Forcrand4,5, ArthurDromard6,UrsGerber1,7, andIlya OrsonSandoval1
1Instituto de Ciencias Nucleares, Universidad Nacional Autónoma de México
A.P. 70-543, C.P. 04510 Ciudad de México, Mexico
2Goethe-Universität Frankfurt am Main, Institut für Theoretische Physik
Max-von-Laue-Straße 1, 60438 Frankfurt am Main, Germany
3Faculty of Physics, Adam Mickiewicz University, Umultowska 85, 61-614 Poznán, Poland
4Institut für Theoretische Physik, ETH Zürich, Wolfgang-Pauli-Strasse 27, CH–8093 Zürich, Switzerland
5CERN, Theory Division, CH-1211 Genève 23, Switzerland
6Institut für Theoretische Physik, Universität Regensburg, D-93040 Regensburg, Germany 7Instituto de Física y Matemáticas, Universidad Michoacana de San Nicolás de Hidalgo
Edificio C-3, Apdo. Postal 2-82, C.P. 58040, Morelia, Michoacán, Mexico
Abstract.We study the impact of the Gradient Flow on the topology in various models of lattice field theory. The topological susceptibilityχtis measured directly, and by the slab method, which is based on the topological content of sub-volumes (“slabs”) and estimatesχt even when the system remains trapped in a fixed topological sector. The results obtained by both methods are essentially consistent, but the impact of the Gradient Flow on the characteristic quantity of the slab method seems to be different in 2-flavour
QCD and in the 2d O(3) model. In the latter model, we further address the question whether or not the Gradient Flow leads to a finite continuum limit of the topological susceptibility (rescaled by the correlation length squared, ξ2). This ongoing study is based on direct measurements ofχtinL×Llattices, atL/ξ6.
1 Introduction
In some quantum field theories, the set of configurations is divided into topological sectors, labelled by a topological chargeQ∈Z. This is the case in QCD, and inN-dimensional O(N+1) models (with
periodic boundary conditions for the gluon and spin fields), due toΠ4[SU(3)] =ZandΠN[SN]=Z. Hence this class of models includes 2-flavour QCD, as well as the 1d O(2) and the 2d O(3) model, which we are going to deal with.
For usual lattice actions, all configurations can be continuously deformed into one another, at finite action, hence there are no topological sectors in a strict sense. Exceptions aretopological lattice actions,with a sharp cutofffor the angles between nearest neighbour spin variables [1], or for
each plaquette variable [2,3], in spin models and gauge theories, respectively. However, even for conventional lattice actions there are established ways to divide the configurations into sectors, which turn into topological sectors in the continuum limit.
Here we consider 2-flavour QCD with twisted-mass quarks [4] (at full twist) and the Wilson gauge action. For the O(N) models we employ the standard lattice action,
S[e]=β xy
(1−ex·ey), ex∈SN−1 ∀x, N=2 or 3, (1)
where the sum runs over all nearest neighbour lattice sites. For these O(N) models we apply the geometric definition of the topological charge density on the lattice [5], which leads to integer charges Q∈Z. In QCD we use a clover discretisation ofFµνF˜µν, whereFis the field strength tensor.
In all cases under consideration, parity symmetry impliesQ=0, hence the topological
suscep-tibility takes the form
χt= V1Q2, Q : topological charge, V : volume. (2)
2 The slab method to measure the topological susceptibility
χ
tOnce we have fixed a formulation of the topological charge on the lattice, it is straightforward to measureχt by means of Monte Carlo simulations,ifthe Markov chain frequently changesQ, such that the sectors are sampled correctly. In practice, however, such simulations are often confronted with the severe problem of “topological freezing”: in particular, the algorithms, which proceed in small update steps, tend to get stuck in one topological sector for a huge number of steps, since the topological sectors are effectively separated by high potential barriers. The autocorrelation time with
respect toQincreases with a high power of the inverse lattice spacing as we approach the continuum limit (“topological slowing down”), seee.g.Ref. [6].
A variety of approaches to handle this problem is reviewed in Ref. [7]. One strategy aims at ex-tracting physical observables even from a Markov chain which is entirely trapped in a single topolog-ical sector. For general observables such a method was suggested in Ref. [8], and tested and extended in Refs. [9–12]. More specifically, a procedure to measureχtwithin a fixed topological sector was proposed in Ref. [13] and tested in Refs. [9,12,14,15]. Here we consider theslab methodas another way to evaluateχtfrom data obtained at fixedQ(actually data from±Qcan be combined). The idea was mentioned in Ref. [16], implemented in Ref. [17], and further explored in Refs. [12,18,19]. A different variant was applied in Ref. [20], and there are similarities with the approach in Ref. [21].
We briefly review the simplest version of the slab method, which assumes the statistical distribu-tion of the topological charges to be Gaussian [17],p(Q) ∝exp(−Q2/(2χ
tV)). We split the volume V into two sub-volumes (“slabs”)xV and (1−x)V (0 < x < 1). By summing up the topological charge density in each of them, in a configuration of topological chargeQ, we obtain the slab charges q,Q−q∈R(they do not need to be integer, since the slabs do not have periodic boundaries). At fixed x,VandQ, the corresponding slab probability distributionsp1andp2obey
p1(q)p2(Q−q)∝exp
−2χ1tV x(1q−2x)
, q=q−xQ. (3)
Measuringq2yields a value forq2=q2 −x2Q2. A sequence of such measurements, at different parametersx, enables a fit to the prediction
q2=χ
tV x(1−x), (4)
which provides a result forχt. In practice, the most reliable fitting regime is around the center,x≈0.5, because the size of the slabs should be large compared to that of topological excitations; one should not includex>
Here we consider 2-flavour QCD with twisted-mass quarks [4] (at full twist) and the Wilson gauge action. For the O(N) models we employ the standard lattice action,
S[e]=β xy
(1−ex·ey), ex∈SN−1 ∀x, N=2 or 3, (1)
where the sum runs over all nearest neighbour lattice sites. For these O(N) models we apply the geometric definition of the topological charge density on the lattice [5], which leads to integer charges Q∈Z. In QCD we use a clover discretisation ofFµνF˜µν, whereFis the field strength tensor.
In all cases under consideration, parity symmetry impliesQ=0, hence the topological
suscep-tibility takes the form
χt= V1Q2, Q : topological charge, V : volume. (2)
2 The slab method to measure the topological susceptibility
χ
tOnce we have fixed a formulation of the topological charge on the lattice, it is straightforward to measureχtby means of Monte Carlo simulations,ifthe Markov chain frequently changesQ, such that the sectors are sampled correctly. In practice, however, such simulations are often confronted with the severe problem of “topological freezing”: in particular, the algorithms, which proceed in small update steps, tend to get stuck in one topological sector for a huge number of steps, since the topological sectors are effectively separated by high potential barriers. The autocorrelation time with
respect toQincreases with a high power of the inverse lattice spacing as we approach the continuum limit (“topological slowing down”), seee.g.Ref. [6].
A variety of approaches to handle this problem is reviewed in Ref. [7]. One strategy aims at ex-tracting physical observables even from a Markov chain which is entirely trapped in a single topolog-ical sector. For general observables such a method was suggested in Ref. [8], and tested and extended in Refs. [9–12]. More specifically, a procedure to measureχtwithin a fixed topological sector was proposed in Ref. [13] and tested in Refs. [9,12,14,15]. Here we consider theslab methodas another way to evaluateχtfrom data obtained at fixedQ(actually data from±Qcan be combined). The idea was mentioned in Ref. [16], implemented in Ref. [17], and further explored in Refs. [12,18,19]. A different variant was applied in Ref. [20], and there are similarities with the approach in Ref. [21].
We briefly review the simplest version of the slab method, which assumes the statistical distribu-tion of the topological charges to be Gaussian [17],p(Q) ∝exp(−Q2/(2χ
tV)). We split the volume V into two sub-volumes (“slabs”)xV and (1−x)V (0 < x < 1). By summing up the topological charge density in each of them, in a configuration of topological chargeQ, we obtain the slab charges q,Q−q∈R(they do not need to be integer, since the slabs do not have periodic boundaries). At fixed x,VandQ, the corresponding slab probability distributionsp1andp2obey
p1(q)p2(Q−q)∝exp
−2χ1tV x(1q−2x)
, q=q−xQ. (3)
Measuringq2yields a value forq2=q2 −x2Q2. A sequence of such measurements, at different parametersx, enables a fit to the prediction
q2=χ
tV x(1−x), (4)
which provides a result forχt. In practice, the most reliable fitting regime is around the center,x≈0.5, because the size of the slabs should be large compared to that of topological excitations; one should not includex>
∼0 or x<∼1 (these regions involve very small slabs, where the Gaussian distribution is not a good approximation).
2.1 Results by the slab method under Gradient Flow (GF)
As a smoothing procedure for lattice field configurations, the GF corresponds to a renormalisation group scheme. When the GF proceeds, the distinction between topological sectors becomes more marked, approaching the continuum feature of a total separation [22,23].
The slab method has been tested in 2-flavour QCD, with twisted-mass quarks and the Wilson gauge action, in a volume 163×32, atβ=3.9 and bare mass 0.015, which corresponds to a pion mass ofmπ650 MeV and a lattice spacinga0.079 fm [18,19].
The GF was implemented with the Runge-Kutta method; the results with time stepdt=0.01 and
0.001 agree. The GF flow time unit was fixed tot0/a2=2.42, based on the criterion proposed in Refs. [22,23]:Et0 =0.3, whereEis the mean energy density. The effect of the GF on the curves to be
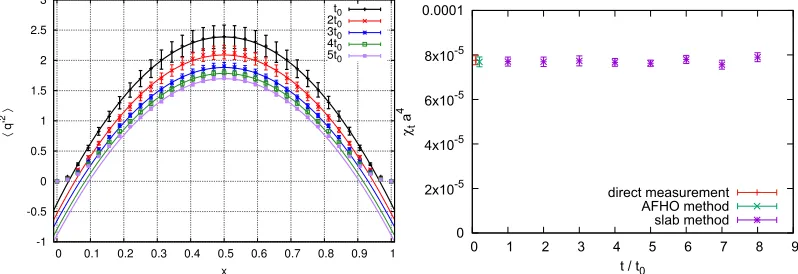
fitted in the slab method is shown in Figure1(left). As the GF proceeds, the fit has to be restricted to a narrower interval centered atx=0.5. Moreover, the fitting function (4) has to be extended to
q2=χtV x(1−x)−c, (5) wherecis a constant (with respect to x), which increases roughly like 0.38√t [19]. The fits
-1 -0.5 0 0.5 1 1.5 2 2.5 3
0 0.1 0.2 0.3 0.4 0.5 0.6 0.7 0.8 0.9 1
〈
q’
2〉
x
t0 2t0 3t0 4t0 5t0
0 2x10⁻⁵ 4x10⁻⁵ 6x10⁻⁵ 8x10⁻⁵ 0.0001
0 1 2 3 4 5 6 7 8 9
χt
a
4
t / t0
direct measurement AFHO method slab method
Figure 1.On the left: the expectation valueq2, as a function of the parameterx=V
slab/V, in 2-flavour QCD, in the sector|Q|=1. Combined fits to eq. (5), in the sectors|Q| ≤2, at different instances of the GF time, lead
to the results for the topological susceptibilityχtin the plot on the right. They agree with a direct measurement, and with the method of Ref. [13] (AFHO method).
at different instances of the GF time, t = t0,2t0. . .8t0, yield very stable results forχt, which are compatible both with a direct measurement (χta4 = 7.8(2)·10−5), and with the method of Ref. [13] (χta4 = 7.7(2)·10−5), see Figure1(right). In the intervalt =t0. . .4t0 we consistently obtain χta4=7.7(2)·10−5. This is a success of the slab method, but the rôle of the subtractive constantcis not obvious.
In the continuum, the Gradient Flow in O(N) models takes the form [24]
∂te(t,x)i= N
j=1
Pi j(t,x)∆e(t,x)j, Pi j(t,x)=δi j−e(t,x)ie(t,x)j, (6)
0 1 2 3 4
0 0.2 0.4 0.6 0.8 1
< q '
2 >
x
L = 120 ,β = 1.607, |Q| = 1
t=0 2t0 4t0
6t0
8t0 0.0004
0.0006 0.0008 0.001 0.0012
0 1 2 3 4 5 6 7 8
χt
t / t0 L = 120,β = 1.607
direct Q = 0 |Q| = 1 |Q| = 2
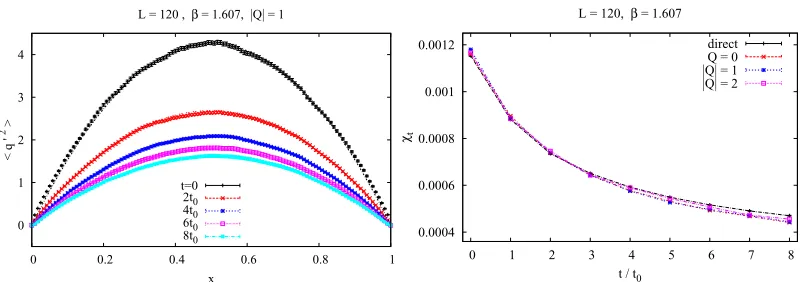
Figure 2.On the left: the quantityq2(x), in the 2d O(3) model, in the sector|Q|=1, with and without GF. Fits to eq. (4), in the sectors|Q|=0,1,2, yield the results forχt, which are shown on the right. They are close to each other, and to the values from direct measurement (the GF drives them slightly apart).
times required by the Runge-Kutta 4-point scheme), then all spins are modified simultaneously, with a time stepdt=10−4; afterwards the spins are normalised again.
In this manner, we consideredL×Llattices, for instance withL =120, β= 1.607, where the
correlation length amounts toξ=19.1(2) [25]. Figure2(left) shows the (approximate) slab parabolae
obtained forq2(x) in the sector|Q|=1, in even multiples of the flow time unitt0 =0.0772 (which obeysEt0 =0.08, cf. Section3). We see a qualitative difference from the QCD result in Figure1:
here the fits do not require any subtractive constant,i.e.the original formula (4) can be used, andχt keeps on decreasing as the GF proceeds (the curvature of the parabola is reduced). This feature was also observed in all data sets to be reported in Section3. The fitting results forχt— obtained by the slab method, separately in the sectors|Q|=0,1,2 — are close to the directly measured values, as we
see in Figure2(right). In this case, the direct measurement is not problematic, since our simulations were carried out with the Wolff cluster algorithm, which proceeds in non-local update steps, thus
suppressing the effect of topological freezing [26].
In order to investigate further these qualitatively different behaviours, we tested the 1d O(2) model,
or quantum rotor, as a toy model. Here we refer toβ=2, as an example. In infinite volume we can
compute analytically [27] (still for the standard lattice action, in lattice units)
β=2 : ξ2.779, χt0.01936, (7)
in agreement with our simulation results for size L = 100 (we used again the cluster algorithm).
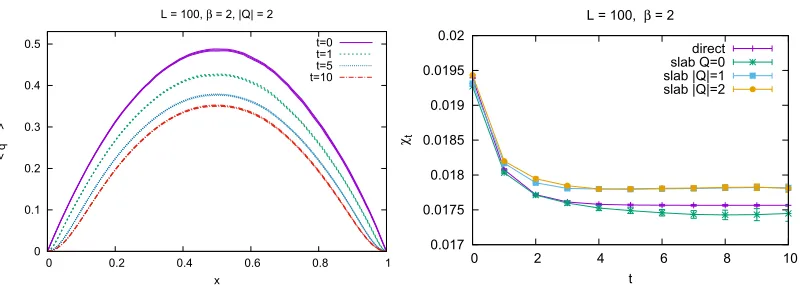
Regarding the slab method under GF, Figure3 shows the results forq2(x) in the sector|Q| = 2 at various flow timest, and χt as a function oft. For the scaling quantity we obtain numerically att = 0 : χtξ = 0.05388(6), and att = 10 : χtξ = 0.0496(1); thus we gradually approach the continuum value ofχtξ=1/(2π2)0.05066. Regarding the different features in QCD and in the 2d O(3) model, the quantum rotor at short flow times (t=O(1)) seems compatible with the latter, but at
t=O(10) a non-negligible constant has to be subtracted for a successful fit; att=10 it takes values
c≈0.08. . .0.09 in the sectors|Q| ≤2.
0 1 2 3 4
0 0.2 0.4 0.6 0.8 1
< q '
2 >
x
L = 120 ,β = 1.607, |Q| = 1
t=0 2t0 4t0
6t0
8t0 0.0004
0.0006 0.0008 0.001 0.0012
0 1 2 3 4 5 6 7 8
χt
t / t0 L = 120,β = 1.607
direct Q = 0 |Q| = 1 |Q| = 2
Figure 2.On the left: the quantityq2(x), in the 2d O(3) model, in the sector|Q|=1, with and without GF. Fits to eq. (4), in the sectors|Q|=0,1,2, yield the results forχt, which are shown on the right. They are close to each other, and to the values from direct measurement (the GF drives them slightly apart).
times required by the Runge-Kutta 4-point scheme), then all spins are modified simultaneously, with a time stepdt=10−4; afterwards the spins are normalised again.
In this manner, we consideredL×Llattices, for instance withL =120, β =1.607, where the
correlation length amounts toξ=19.1(2) [25]. Figure2(left) shows the (approximate) slab parabolae
obtained forq2(x) in the sector|Q|=1, in even multiples of the flow time unitt0 =0.0772 (which obeysEt0 =0.08, cf. Section3). We see a qualitative difference from the QCD result in Figure1:
here the fits do not require any subtractive constant,i.e.the original formula (4) can be used, andχt keeps on decreasing as the GF proceeds (the curvature of the parabola is reduced). This feature was also observed in all data sets to be reported in Section3. The fitting results forχt— obtained by the slab method, separately in the sectors|Q|=0,1,2 — are close to the directly measured values, as we
see in Figure2(right). In this case, the direct measurement is not problematic, since our simulations were carried out with the Wolff cluster algorithm, which proceeds in non-local update steps, thus
suppressing the effect of topological freezing [26].
In order to investigate further these qualitatively different behaviours, we tested the 1d O(2) model,
or quantum rotor, as a toy model. Here we refer toβ=2, as an example. In infinite volume we can
compute analytically [27] (still for the standard lattice action, in lattice units)
β=2 : ξ2.779, χt0.01936, (7)
in agreement with our simulation results for size L = 100 (we used again the cluster algorithm).
Regarding the slab method under GF, Figure3 shows the results forq2(x) in the sector|Q| = 2 at various flow times t, and χt as a function oft. For the scaling quantity we obtain numerically att = 0 : χtξ = 0.05388(6), and att = 10 : χtξ = 0.0496(1); thus we gradually approach the continuum value ofχtξ=1/(2π2)0.05066. Regarding the different features in QCD and in the 2d O(3) model, the quantum rotor at short flow times (t=O(1)) seems compatible with the latter, but at
t=O(10) a non-negligible constant has to be subtracted for a successful fit; att=10 it takes values
c≈0.08. . .0.09 in the sectors|Q| ≤2.
In the 2d O(3) model our flow times are short so far, cf. Section3; the question whether the same behaviour sets in after a long GF is under investigation.
0 0.1 0.2 0.3 0.4 0.5
0 0.2 0.4 0.6 0.8 1
< q'
2 >
x L = 100, β = 2, |Q| = 2
t=0 t=1 t=5 t=10 0.017 0.0175 0.018 0.0185 0.019 0.0195 0.02
0 2 4 6 8 10
χt
t L = 100, β = 2
direct slab Q=0 slab |Q|=1 slab |Q|=2
Figure 3.The slab method in the 1d O(2) model: at short GF times,q2(x) (on the left) can be fitted to eq. (4), but long flow times require an extension to eq. (5), and the exclusion ofx>
∼0 andx<∼1 from the fit. After a long flow time, the sectorQ=0 provides the best results forχt, as the plot on the right shows.
3 Topological scaling in the 2d O(3) model
In ad-dimensional quantum field theory with topological sectors, the dimensionless term χtξd is supposed to be a scaling quantity, which converges to a finite value in the continuum limit. For the 1d O(2) model the continuum valueχtξ=1/(2π2) is attained without problems [1,11,27]. In QCD, and in SU(N) Yang-Mills theories (N ≥2), a straight approach based on the expressionχt =xq0qx, whereqxis the lattice topological charge density, faces problems. In conventional formulations one encounters a divergence due to the pointx=0, which prevents the continuum scaling. In these cases,
there are known solutions to this problem, in particular the application of the GF [22,23].
In the 2d O(3) model, this question has been controversial in the 1980s and 1990s. The consensus is now that the quantityχtξ2seems to diverge in the continuum limit, as first observed in [5], and later underpinned by semi-classical studies,e.g.in Refs. [28,29]. Again the problem can be traced back to the topological density correlation at distance zero (seee.g.Ref. [1]), and the semi-classical picture suggests an abundance of very small topological windings, so-calleddislocations, as the continuum limit is approached. Ref. [30] constructed and applied a sophisticated (truncated) classically perfect lattice action, with a host of couplings beyond nearest neighbour lattice sites, which suppress such dislocations. Nevertheless, the simulation results with this action still suggest a logarithmic divergence of the termχtξd in the continuum limit (ξ→ ∞in lattice units). Hence the continuum limit of this popular model is generally assumed to be ill-defined, at least with respect to its topology (the reason is again the contributionq0q0, seee.g.Refs. [1,31,32]).
However, the question remains whether or not this divergence could be overcome by the GF; we gave preliminary results in Ref. [25]. In the following we summarise the status of this study. So far it involves nineL×Llattices, in the range ofL=24. . .404, where in each volumeβhas been tuned such thatL/ξ6. Therefore, increasingLcorresponds to a controlled step towards the continuum limit, at a fixed and large physical box size. The statistics in each volume are 105configurations (generated by the Wolffcluster algorithm, both in the single-cluster and the multi-cluster version). We repeat that
we perform the GF with the Runge-Kutta 4-point method, with a time step ofdt =10−4, which is
simultaneously applied to all spin variables.
0.00 0.02 0.04 0.06 0.08 0.10 0.12 0.14 flow time t
0.000 0.025 0.050 0.075 0.100 0.125 0.150 0.175 0.200
E
t
L to
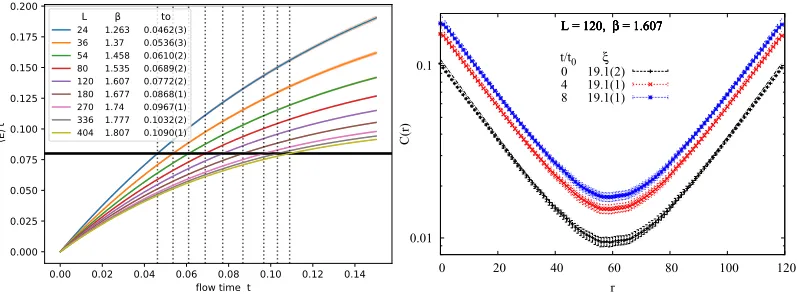
24 1.263 0.0462(3) 36 1.37 0.0536(3) 54 1.458 0.0610(2) 80 1.535 0.0689(2) 120 1.607 0.0772(2) 180 1.677 0.0868(1) 270 1.74 0.0967(1) 336 1.777 0.1032(2) 404 1.807 0.1090(1)
0.01 0.1
0 20 40 60 80 100 120
C(r)
r L = 120,β = 1.607 L = 120,β = 1.607 L = 120,β = 1.607 L = 120,β = 1.607 L = 120,β = 1.607
t/t0 ξ 0 19.1(2) 4 19.1(1) 8 19.1(1)
Figure 4.The 2d O(3) model under GF: on the left, the termEt, which fixes a GF time unitt0(in lattice units)
by the conditionEt0=0.08. On the right: the correlation functionC(r) att=0,4t0,8t0. At fixed distancer
the GF moves it up, but the correlation lengthξremains practically constant.
value of the maximum ofEtdecreases, hence the reference value has to be sufficiently small, such that it is attained in all volumes under consideration. We are in the process of extending this study up toL =494 and 606, where for instance 0.1 is not attained anymore. Hence we chose the reference value 0.08, which works up toL=606 [33]. So we refer to the definition
Et0=0.08, (8)
as we anticipated in Figure2.
Figure4(right) shows an example for the zero-momentum spin-spin correlation functionC(r) at
t=0,4t0,8t0. At a fixed distancerbetween Euclidean time layers,C(r) increases as the GF proceeds,
but the correlation lengthξremains unchanged within the errors. We measuredξby a fit to a cosh-function in the ranger ∈ [L/3,2L/3]. We see that the GF — up tot = 8t0 — hardly affects this long-range property.
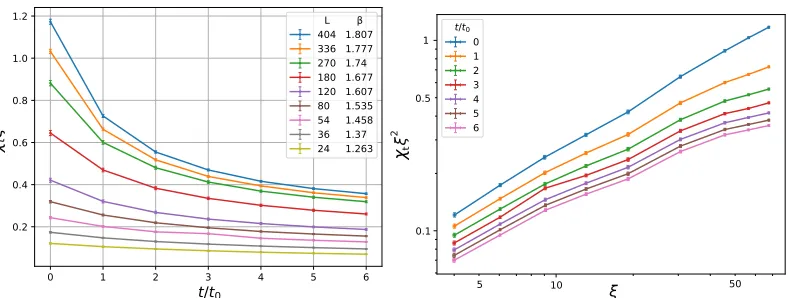
Figure5 (left) illustrates the GF time evolution of the term χtξ2, which is supposed to be the
scaling quantity. We see a rapid decrease at an early stage of the GF flow, in particular at largeLand
ξ. This observation is compatible with an increasing dominance of small dislocations on fine lattices: these topological windings are destroyed even by a short GF flow.
Finally, Figure5(right) showsχtξ2 as a function ofξ, at various multiples of the flow time unit t0(the lines are drawn to guide the eye). At this stage, no trend towards a stabilisation is visible. The
observed behaviour att=0 is well compatible with a logarithmically divergent function of the form
χtξ2 = c1ln(c2ξ+c3); at t =t0. . .6t0 the quality of this fit is somewhat worse, but it still follows
roughly this behaviour (although a power-lawc1ξc2+c3 can be fitted with a similar quality) [25].
In any case, the present data do not provide a basis for revising the standard lore of a topologically ill-defined continuum limit in this model.
4 Summary and outlook
0.00 0.02 0.04 0.06 0.08 0.10 0.12 0.14 flow time t
0.000 0.025 0.050 0.075 0.100 0.125 0.150 0.175 0.200 E t
L to
24 1.263 0.0462(3)
36 1.37 0.0536(3)
54 1.458 0.0610(2)
80 1.535 0.0689(2)
120 1.607 0.0772(2) 180 1.677 0.0868(1)
270 1.74 0.0967(1)
336 1.777 0.1032(2) 404 1.807 0.1090(1)
0.01 0.1
0 20 40 60 80 100 120
C(r)
r L = 120, β = 1.607 L = 120, β = 1.607 L = 120, β = 1.607 L = 120, β = 1.607 L = 120, β = 1.607
t/t0 ξ 0 19.1(2) 4 19.1(1) 8 19.1(1)
Figure 4.The 2d O(3) model under GF: on the left, the termEt, which fixes a GF time unitt0(in lattice units)
by the conditionEt0=0.08. On the right: the correlation functionC(r) att=0,4t0,8t0. At fixed distancer
the GF moves it up, but the correlation lengthξremains practically constant.
value of the maximum ofEtdecreases, hence the reference value has to be sufficiently small, such that it is attained in all volumes under consideration. We are in the process of extending this study up toL =494 and 606, where for instance 0.1 is not attained anymore. Hence we chose the reference value 0.08, which works up toL=606 [33]. So we refer to the definition
Et0=0.08, (8)
as we anticipated in Figure2.
Figure4(right) shows an example for the zero-momentum spin-spin correlation functionC(r) at
t=0,4t0,8t0. At a fixed distancerbetween Euclidean time layers,C(r) increases as the GF proceeds,
but the correlation lengthξremains unchanged within the errors. We measuredξby a fit to a cosh-function in the ranger ∈ [L/3,2L/3]. We see that the GF — up tot = 8t0 — hardly affects this long-range property.
Figure 5 (left) illustrates the GF time evolution of the termχtξ2, which is supposed to be the
scaling quantity. We see a rapid decrease at an early stage of the GF flow, in particular at largeLand
ξ. This observation is compatible with an increasing dominance of small dislocations on fine lattices: these topological windings are destroyed even by a short GF flow.
Finally, Figure5(right) showsχtξ2 as a function ofξ, at various multiples of the flow time unit t0(the lines are drawn to guide the eye). At this stage, no trend towards a stabilisation is visible. The
observed behaviour att=0 is well compatible with a logarithmically divergent function of the form
χtξ2 = c1ln(c2ξ+c3); att = t0. . .6t0 the quality of this fit is somewhat worse, but it still follows
roughly this behaviour (although a power-lawc1ξc2 +c3 can be fitted with a similar quality) [25].
In any case, the present data do not provide a basis for revising the standard lore of a topologically ill-defined continuum limit in this model.
4 Summary and outlook
In Section 2 we have discussed the slab method, which enables a reliable measurement of the topological susceptibility within a fixed topological sector,i.e.from a Markov chain at fixedQ. This method does still work quite well when the GF is applied, but in some cases — in particular in QCD — we observed the necessity to subtract a constant from the expected fitting function.
0 1 2 3 4 5 6
t/t0 0.2 0.4 0.6 0.8 1.0 1.2 L
404 1.807 336 1.777 270 1.74 180 1.677 120 1.607 80 1.535 54 1.458 36 1.37 24 1.263
t 2 10 5 0.1 1 2 t/t0 0 1 2 3 4 5 6 50 0.5 t
Figure 5. Left: the GF time evolution of the termχtξ2 in nineL×Llattices, in each case atL 6ξ. In large
volumes we observe a rapid decrease at an early stage of the GF; this can be interpreted as the destruction of numerous small dislocations. Right: in the ranget=0. . .6t0, the quantityχtξ2does not seem to attain any finite
continuum value as we approach the continuum (increasingξ).
In the 2d O(3) model, the data presented in Section3do not suggest a continuum convergence of the termχtξ2after application of the GF. Further details, including a table with numerical results, are
given in Ref. [25].
However, the impact range ¯x(t) of the GF is short in these examples. It can be estimated based on the heat kernelK(t,x); inddimensions we obtain
K(t,x)= 1
(2πt)d/2 exp
−x2/(4t), x¯(t)= ddx x2K(t,x)1/2= √2d t. (9)
In our 2d model it attains at most ¯x(6t0)= √24t0 1.62 at this stage of our study; this refers to our largest volume,L=404, withξ=67.7(3)x¯(6t0).
In order to arrive at conclusive results, we are now going to fix an extended GF time unitT0by a conditionT0/ξ2 =constant, and investigate flow times up to an impact range of ¯x(t) ≈ξ/2. This study is in progress [33], and it should finally reveal whether or not the GF leads to a continuum scaling of the quantityχtξ2.
Acknowledgements We thank Martin Lüscher for attracting our interest to the subject of Section3, and for advice regarding the strategy towards conclusive results. We further thank Marc Wagner for helpful discussions about the slab method, which we discussed in Section2, and the organisers of the 35th International Symposium on Lattice Field Theory. This work was supported by DGAPA-UNAM, grant IN107915, by theConsejo Nacional de Ciencia y Tecnología (CONACYT) through project CB-2013/222812, and by the Helmholtz International Center for FAIR within the framework of the LOEWE program launched by the State of Hesse. K.C. was supported by the Deutsche Forschungs-gemeinschaft (DFG), project nr. CI 236/1-1, and A.D. by the Emmy Noether Programme of the DFG, grant WA 3000/1-1.
References
[1] W. Bietenholz, U. Gerber, M. Pepe, U.J. Wiese, JHEP12, 020 (2010),1009.2146
[3] O. Akerlund, P. de Forcrand, JHEP06, 183 (2015),1505.02666
[4] R. Frezzotti, P.A. Grassi, S. Sint, P. Weisz (Alpha), JHEP08, 058 (2001),hep-lat/0101001 [5] B. Berg, M. Lüscher, Nucl. Phys.B190, 412 (1981)
[6] S. Schaefer, R. Sommer, F. Virotta (ALPHA), Nucl. Phys.B845, 93 (2011),1009.5228 [7] M.G. Endres, PoSLATTICE2016, 014 (2016),1612.01609
[8] R. Brower, S. Chandrasekharan, J.W. Negele, U.J. Wiese, Phys. Lett. B560, 64 (2003), hep-lat/0302005
[9] W. Bietenholz, I. Hip, S. Shcheredin, J. Volkholz, Eur. Phys. J.C72, 1938 (2012),1109.2649 [10] A. Dromard, M. Wagner, Phys. Rev.D90, 074505 (2014),1404.0247
[11] W. Bietenholz, C. Czaban, A. Dromard, U. Gerber, C.P. Hofmann, H. Mejía-Díaz, M. Wagner, Phys. Rev.D93, 114516 (2016),1603.05630
[12] A. Dromard, Ph.D. thesis, Goethe-Universität Frankfurt am Main (2016)
[13] S. Aoki, H. Fukaya, S. Hashimoto, T. Onogi, Phys. Rev.D76, 054508 (2007),0707.0396 [14] S. Aoki et al. (TWQCD, JLQCD), Phys. Lett.B665, 294 (2008),0710.1130
[15] I. Bautista, W. Bietenholz, A. Dromard, U. Gerber, L. Gonglach, C.P. Hofmann, H. Mejía-Díaz, M. Wagner, Phys. Rev.D92, 114510 (2015),1503.06853
[16] P. de Forcrand, M. García Pérez, J.E. Hetrick, E. Laermann, J.F. Lagae, I.O. Stamatescu, Nucl. Phys. Proc. Suppl.73, 578 (1999),hep-lat/9810033
[17] W. Bietenholz, P. de Forcrand, U. Gerber, JHEP12, 070 (2015),1509.06433
[18] A. Dromard, W. Bietenholz, K. Cichy, M. Wagner, Acta Phys. Polon. Supp.9, 635 (2016), 1605.08637
[19] W. Bietenholz, K. Cichy, P. de Forcrand, A. Dromard, U. Gerber, PoSLATTICE2016, 321 (2016),1610.00685
[20] S. Aoki, G. Cossu, H. Fukaya, S. Hashimoto, T. Kaneko (JLQCD) (2017),1705.10906 [21] R.C. Brower et al. (LSD), Phys. Rev.D90, 014503 (2014),1403.2761
[22] M. Lüscher, JHEP08, 071 (2010), [Erratum: JHEP03,092(2014)],1006.4518 [23] M. Lüscher, PoSLATTICE2010, 015 (2010),1009.5877
[24] H. Makino, H. Suzuki, PTEP2015, 033B08 (2015),1410.7538
[25] I.O. Sandoval, W. Bietenholz, P. de Forcrand, U. Gerber, H. Mejía-Díaz,Topology in the 2d Heisenberg Model under Gradient Flow, in31st Annual Meeting of the Division of Particles and Fields (DPyC) of the Mexican Physical Society (DPyC-SMF2017) Mexico City, Mexico, May 24-26, 2017(2017),1709.06180,http://inspirehep.net/record/1624423/files/arXiv: 1709.06180.pdf
[26] U. Wolff, Phys. Rev. Lett.62, 361 (1989)
[27] W. Bietenholz, R. Brower, S. Chandrasekharan, U.J. Wiese, Phys. Lett. B407, 283 (1997), hep-lat/9704015
[28] F. Farchioni, A. Papa, Nucl. Phys.B431, 686 (1994),hep-lat/9407026 [29] C. Michael, P.S. Spencer, Phys. Rev.D50, 7570 (1994),hep-lat/9404001
[30] M. Blatter, R. Burkhalter, P. Hasenfratz, F. Niedermayer, Phys. Rev. D53, 923 (1996), hep-lat/9508028
[31] J. Balog, M. Niedermaier, Phys. Rev. Lett.78, 4151 (1997),hep-th/9701156 [32] J. Balog, M. Niedermaier, Nucl. Phys.B500, 421 (1997),hep-th/9612039