ASSESSING THE EFFECTS OF NAFTA ON CANADA/US
AGRICULTURAL TRADE
Hugh Deng, Carleton University
Jonathan Nzuma, University of Guelph
Paper prepared for presentation at the 99
thseminar of the EAAE
(European Association of Agricultural Economists),
The Future of Rural Europe in the Global Agri-Food System,
Copenhagen, Denmark August 24-27, 2005
Copyright 2005 by authors. All rights reserved. Readers may make verbatim copies of
this document for non-commercial purposes by any means, provided that this copyright
ASSESSING THE EFFECTS OF NAFTA ON CANADA/US
AGRICULTURAL TRADE
Abstract
While there seems to be an agreement that Canada-US Free Trade Agreement (CUSTA)/North American Free Trade Agreement (NAFTA) have benefited member countries, some analysts have argued that the agreements had little effect on the bilateral Canada/US agricultural trade as many other factors have contributed to the increased trade flows. Results from this study reveal that the aggregate bilateral agricultural trade flows have generally experienced a steady growth since the implementation of NAFTA with trade flows seemingly favoring Canada more than the US since 1992. At the industry level, the impacts of NAFTA on Canada/US agricultural trade were varied with the sub-sectors analyzed responding differently to the bilateral trade liberalization.
1.0. Introduction
At the end of 2003, North American Free Trade Agreement (NAFTA) had been in effect for ten years. Although this agreement would not be fully implemented for another five years, almost all of its important provisions are already in place. NAFTA has created the world’s largest free-trade area, encompassing the US, Canada and Mexico. These three countries comprise a territory of more than 21 million square miles, a population of 422 million, and a workforce of 200 million, which includes an agricultural work force of some 12 million (Veeman, at al, 2001). The purpose of the agreement, which came into force in 1994, was to increase trade and investment among the member countries by
eliminating tariffs and by reducing non-tariff barriers. However, the NAFTA agreement remains strange to date with many debates on its impacts. Interestingly, the bilateral Canada/US agricultural trade has continued to expand since its implementation. In 2002, the two-way trade between Canada and the US surpassed $372 billion, representing by far the largest bilateral trading relationship in the world (Fry, 2003).
The predecessor of NAFTA was Canada-US Free Trade Agreement (CUSTA) that was signed in 1989. However, even before these two agreements, Canada/US have traditionally had a close trading
relationship spanning a long period time as evidenced by several reciprocal trade treaties. The first
Reciprocal Trade Treaty was signed in 1854 while a follow up Trade Agreement was ratified in 1935. The 1854 Reciprocal Trade Treaty was unilaterally abrogated by the US in 1866 triggering the 1789 Canadian National Policy that set up significant tariff barriers to protect her domestic market. However, in 1911 Washington once again approached Ottawa leading to the 1935 Trade Agreement that reduced many tariffs. These treaties significantly increased Canada/US agricultural trade flows from a historical perspective.
NAFTA binds Canada, Mexico and the US in an experimental regional economic integration. Initially, a bilateral free trade agreement between Canada and the US was approved in 1988 and initiated in January 1989. In 1990, Mexico began trade negotiations with the US, and Canada soon joined resulting in a trilateral agreement in August 1992 that was signed by the leaders of the three countries by that October 1994. However, the negotiations raised major trade and development policy. For instance, while Canada reduced domestic support to agriculture, the US increased agricultural export subsidies and domestic support to the farm sector (Veeman, 2002).
It can therefore be argued that the extent to which the agreement has affected Canada/US agricultural trade remains controversial. While there seems to be an agreement that CUSTA/NAFTA have benefited member countries, some analysts have argued that the agreements had little effect on the Canada/US agricultural trade. These analysts further observe that the agreements have led to increased pressure on Canada (and Mexico) to conform to American trade policy. Other analysts have argued that the
agreements had positive effects since they allowed competitive market forces to play a significant role in increasing agricultural trade among the member countries.
The need to study the impacts of NAFTA on agricultural trade becomes apparent even as its success in facilitating non-agricultural trade appears unchallenged. The objective of this study is to present an overview of the impacts of CUSTA/NAFTA on Canada/US agricultural trade. It offers a broad profile of the bilateral trade flows in 1988 –2002 and reviews the historical context and implementation of the agreements. The study also reviews literature on the opposing debates about the agreements and analyzes their effects on Canada/US agricultural trade flows, with special emphasis on a few crops and livestock using quantitative data and largely descriptive methods.
After the implementation of CUSTA/NAFTA, many studies have attempted to analyze the impacts of the agreements on agricultural trade flows between Canada and the US. Most of these studies generally agreed that the agreements have benefited both countries by dismantling trade barriers and expanding agricultural trade. Further, these studies agree that NAFTA has succeeded in facilitating non-agricultural trade flows between the two countries. However, a close examination of past literature reveals that there have been conflicting perspectives on the implications of the agreements.
While some analysts argue that the effect of NAFTA on Canada/US agricultural trade varied by
commodities owing to factors beyond the agreement, other contents that the effect has been positive and large mainly due to a gradual elimination of tariffs and non-tariff barriers, harmonization of technical regulations and standards, and the establishment of bilateral trade dispute settlement panels. Yet a third school of thought contents that the effect of NAFTA on Canada/US agricultural trade was small since many tariff reductions between Canada and the US had already been implemented prior to
CUSTA/NAFTA. This literature review explores the different schools of thought by examining several studies that have been undertaken.
2.1. The Effects of NAFTA Varied by Commodity
In a study on NAFTA undertaken in 2003, Rodrogue used gravity modeling of to evaluate the border effects of the agreements on agricultural trade flows. The gravity model uses a formulation similar to Newton’s gravity model, which implies that the attraction between two objects is proportional to their mass and inversely proportional to their respective distance. This approach estimates the economic implications of national borders in trade flows (Helliwell, 1998). Similarly, Anderson and van Wincoop used gravity modeling to analyze Canada/US border effects by considering inter-provincial trade and inter-state trade in 2001. These two studies concluded that relatively smaller economies had a higher border effect, while larger economies had lower border effects (Anderson, at. al, 2001).
Ndayisenga (1999) in a study on the effects of the CUSTA on processed food flows applied the Bilateral Trade Intensity (BTI) index to examine trade flows between Canada/US and the rest of the world (ROW). The BTI is a ratio of total bilateral trade over total trade. The study by Ndayisenga showed that the BTI index between Canada and the US increased from an average of 49 percent in 1979/89 to 66 percent in the free trade agreement period (Table 1). However, the BTI index with the ROW remained relatively constant at 51 percent suggesting an increased trade concentration between Canada and the US. Table 1 Canadian Agricultural Food Trade with U.S. in the Pre and Post NAFTA Periods
Year Base year
(1988) Pre-NAFTA (80/88) Early NAFTA (89/93) Late NAFTA (94/98) Post NAFTA (89/98) Export 56% 53% 65% 74% 70% Import 52% 48% 59% 67% 63% BTI n.c. 49% n.c. n.c. 66%
Source: Ndayisenga, 2001 (note: growth of Canadian Agricultural food imports from the US is a real growth rate at 1992 dollars; n.c.: means “not calculated”).
Zahniser and others (2001) in a background on trade flows criticized Ndayisenga’s results by arguing that trade growth among member countries was a result of long-term agricultural policies that had only been strengthened by a temporally decrease in agricultural trade to countries outside NAFTA (Table 2). Zahniser et al further agued that some of Canada’s most important trade partners in the Asian region were hit by financial crisis during the 1990's and that the economic effects of these crisis would explain the decline in Canada’s exports to Asia while Canada’s imports from Asia attained one of the highest average growth rates during this period.
Table 2 Canada’s Agricultural trade with Different Partners (1992-98) Region/country Export shares Import shares Export growth Import growth Real GDP growth US 51.36% 65.61% 13.81% 10.39% 3.14% Asia 23.24% 6.72% 3.72% 11.98% 8.10% EU 7.71% 13.75% 13.26% 7.27% 1.90% Africa 3.99% 2.04% 30.71% 16.54% 2.77%
Source: Statistics Canada (Note: Canada’s real GDP growth in 1992-98 was an average of 2.08%) Some studies such as Hart (1998) and Randall (2000) have also argued that the achievements of Canada/US agricultural trade were a result of long-time trade policy development. As GATT member countries, Canada and the US are required to phase out certain quota policies. The GATT agreement itself and the subsequent negotiation rounds were instrumental in reducing tariff levels between the two
countries over a span of decades. These two studies argued that while the efforts to advance the free trade agenda continued to work on a bilateral level, multilateral trade negotiations could be shown to have played an important role in increasing Canada/US agricultural trade flows. The multilateral trade negotiations have achieved increased market access for member countries by reducing tariffs and eliminating other non-tariff barriers. While prior to GATT the Canadian and the US economies were highly protected via high tariffs and other non-tariff measures, by 1985, tariff rates averaged less than five percent in the US and about 10 percent in Canada. Overall, after the trade negotiations, Canada had eliminated approximately 80 percent of the trade barriers that it had in 1934 (Ndayisengsa, 1999). Table 3 illustrates Canada/US agricultural trade growth with the elimination of trade restrictions and shows that the US has been a major market for Canadian exports even prior to NAFTA.
Table 3 Bilateral Trade Shares for Selected Years (%)
Year
Canadian share of US exports US share of Canadian exports
1945 n.a. 32.6
1960 18.1 56.4
1970 22.5 64.8
1980 18.0 63.9
1987 23.7 76.3
Source: Gunter Dufey and Ulrich Hommel, Why There is Never Peace in International Trade: the Case of Canada/US Economic Relations, the University of Michigan Business School.1996.
In addition to bilateral and multilateral trade border effects, other factors also account for the increased Canada/US agricultural trade flows. Since the early 1990s, the US dollar appreciated to the Canadian dollar implying that the Canadian dollar’s purchasing power relative to the US dollar declined. The increased agricultural trade flows could be shown to have stemmed from exchange rate volatility. The depreciating Canadian real exchange rate had the effects of increasing exports to the US since Canadian exports become relatively cheap in the US. Other significant factors contributing to the increased trade flows included the elimination of transportation subsidies under the Western Grain Transportation Act (WGTA) in Canada, and the liberalization of foreign direct investments. Further research on the link between foreign direct investment and trade growth could contribute to a better understanding of the effects of the trade agreements. In addition to these factors, population growth, consumer preferences and macroeconomic performance and weather conditions also affected affecting Canada/US agricultural trade flows besides CUSTA/NAFTA.
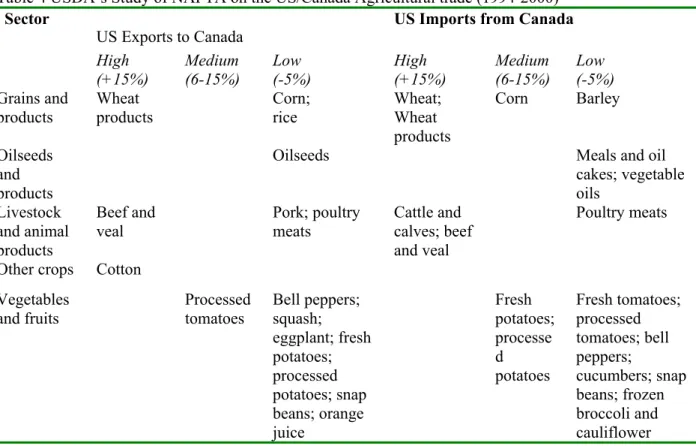
Skorburg (2002) in a study titled “An Economic Evaluation of NAFTA by Commodity 1994 to 2000” showed that the effects of NAFTA on Canada/US agricultural trade varied by commodities. Some goods, such as wheat and cotton, have seen a trade boost of at least 15% during the period of 1994 and 2000 (Skorburg, 2002). US exports of cotton to Canada have more than tripled in this period. At the same period, other top exports to Canada from the US have included beef and veal as well as processed tomatoes (Skorburg, 2002). The USDA’s 2001 report also argues that varied effects accompanied the implementation of the agreements. The USDA’s analysis showed that NAFTA raised the volume of the US imports of fresh and processed potatoes from Canada by 6 to15 percent between 1994 and 2000. Other agricultural commodities that have felt a significant impact included: wheat, corn, cattle and calves, beef and veal (Table 4).
Table 4 USDA’s Study of NAFTA on the US/Canada Agricultural trade (1994-2000) Sector
US Exports to Canada US Imports from Canada
High (+15%) Medium (6-15%) Low (-5%) High (+15%) Medium (6-15%) Low (-5%) Grains and products Wheat products Corn; rice Wheat; Wheat products Corn Barley Oilseeds and products
Oilseeds Meals and oil
cakes; vegetable oils Livestock and animal products Beef and veal Pork; poultry meats Cattle and calves; beef and veal Poultry meats
Other crops Cotton Vegetables and fruits Processed tomatoes Bell peppers; squash; eggplant; fresh potatoes; processed potatoes; snap beans; orange juice Fresh potatoes; processe d potatoes Fresh tomatoes; processed tomatoes; bell peppers; cucumbers; snap beans; frozen broccoli and cauliflower Source: USDA (WRS-02-01) July 2002.
2.2. The Effect of NAFTA Was Positive and Large
Some analysts such as Promar (1997), Ruffin (1999), Veeman (2001) have proposed that the overall benefits and opportunities from free trade between Canada and the US owing to the agreements were positive. One of the main reasons for this proposition was that efficient agricultural organizations readily exploit opportunities for more trade in international markets when trade barriers for agricultural products fall. Analysts in this school of thought used different approaches to demonstrate their perspective. Brian Rattray (2001) in a study on North American agricultural trade flows concluded that both CUSTA and NAFTA had positive effects on producers, processors and consumers of agricultural products. He further illustrates that Canada is a trading nation since agricultural trade yields about 40 percent of every dollar reaching the farm gate. Canadian agricultural producers and agricultural food processors are better able under free trade to realize their potential by operating in a larger, more integrated and efficient North American economy.
Some positive effects of NAFTA on agricultural trade flows have included tariff reductions and exploitation of production comparative advantages. Ndayisenga (2001) analyzed the effects of tariff reductions on Canada/US Agricultural trade using the standard comparative advantage theory as advanced by David Ricardo. He assumed that the existence of a free trade agreement would intensify trade flows among the member countries and ultimately lead to trade creation and diversion as member countries develop international competitiveness. The author showed that between 1979-88, 47 percent of the imports of processed food products into Canada originated from the US. By 1998, the American share of Canadian processed food imports increased to 70 percent. Further, he estimated that the contribution of the
agreements was in the 6 to 8 percent range, while other non-trade factors accounted for 1 to 3 percent growth. This contribution hinged on the assumption that trade would have grown at historical rates. Ndayisenga concluded that the tariff reductions introduced by the Canada-US trade agreements increased processed food imports and exports by about 5 percent per year assuming an equal 10 percent tariff reduction from 1989 to1998. Over this ten-year period, the tariff reductions were estimated to have increased Canadian exports and imports from the US by about 40 percent (Ndayisenga 1999).
Promar International in a 1997 report indicated that NAFTA’s trade liberalization among the member countries allowed the economic forces of comparative advantage to work. Technically, many Canadian agricultural sectors were as developed as those in the US before NAFTA. These included grains, oilseeds and animal products. However, such technological efficiencies did not imply that each of these sectors was equally efficient in economic terms to its American counterpart. For instance, wheat, barley and canola were relatively more important than corn or soybeans in Canada compared to the US. Canada could not produce the same range of fruits and vegetables possible in the US because of greater variation in the climate and growing conditions (Promar 1997). The long border between Canada and the US further complicated these technological and climatic conditions. As such, Canada exported more than 80 percent of her total exports to NAFTA partners and relied on them for a huge share of her imports.
Veeman (2001) lends credence to the geographical location argument by showing that that there was a tendency for increasing trade in complementary goods between Canada and the US. In the context of the large geographic areas that constitute the North American continent, and the reduction in transaction costs of cross-border trade that has occurred since 1994, it was not surprising that the emergent North-South trade patterns were consistent with efforts to reduce trade barriers and minimize transaction costs. For instance, pork producers in Western Canada were able to export and sell to the US west coast consumers, an option that would not have existed prior to CUSTA/NAFTA because of tariffs and other impediments to cross border-trade.
2.3. The Effect of NAFTA Was Small
A third school of thought believed that the impact of CUSTA/NAFTA on Canada/US Agricultural trade was not large, because most goods had already been free of trade restrictions in 1989 when CUSTA came into effect. Analysts in this group included Rude (2001), Eden (1998), Dufey and others (1996). Some of the more sensitive sectors in agriculture like dairy, poultry and eggs in Canada, and sugar, poultry and peanuts in the US, were exempted from the agreements. According to Rude (2001), this period was marked by an uninterrupted growth of the US economy coupled with a decline in the Canadian dollar from (US) 84 cents to (US) 67 cents, which might be one of the possible reasons why the Canadian agricultural exports to the US grew by 275 percent between 1989 and 2000.
7
Many reasons were advanced for the increased agricultural trade flows between Canada and the US. For example, prior to CUSTA, the tariffs on Canadian red meat exports were minor and the market was already largely integrated. It could also be arguable that changes in international cereals markets, the lossof the former Soviet Union market, China’s shift to cereals self-sufficiency as well as the Asian financial crisis were important drivers of growth in Canadian cereal exports to the US (Rude. 2001). Eden (1998) argues that Trade tensions and disputes over Canadian wheat exports to the US have not been beneficial to Canadian wheat producers. Eden (1998) further shows that the gains for Canadian stakeholders in the grain sector as a result of NAFTA were not impressive. Forces driving the horticultural sector were also
independent of NAFTA such as the Canadian greenhouse industry while rationalization of agricultural processing boosted US processed imports into Canada.
Dufey (1996) hinged his view that the effect of NAFTA was small on the neoclassical economic assumption that the more unequal economies are prior to free trade, the greater the scope for adjustment along comparative advantage lines. In terms of economic size, Dufey argues that the US is a dominant market, accounting for 88.4 percent of the NAFTA GDP.
On the other hand, Canada is less than one-tenth the size of the US economy accounting for 6.2 percent of the NAFTA GDP, which needs to be greatly adjusted for the US market. It can therefore be concluded that many non-trade factors as well as historical trading relationships between Canada and the US have
significantly contributed to the increased bilateral agricultural trade flows.
2.4. Implementation of NAFTA
In NAFTA’s first five years (1993-98), Canada became the largest trading partner with the US. The bilateral agricultural trade grew faster than the rate of global trade expansion (USTR, 1999). NAFTA members agreed on two separate occasions to speed up tariff reductions, facilitating over a billion dollars of exports. The first round of accelerated tariff reductions began in 1994 and covered about 80 eight-digit tariff lines while the second round of 1997 considered 1,500 eight-digit tariff lines. Eventually, all duties covered by provisions of the NAFTA were eliminated on January 1, 1998.
Similarly, in the first five years Canada and the US undertook a number of projects under the cooperative work programs. The two countries sought solutions to some issues of bilateral significance in areas such as biological diversity, conservation and pollution reporting, while maintaining a strong emphasis on trade-environment issues. At the same time, the two governments listened to valuable criticisms and advice on improvement of the agreements from businesses, citizen groups and others interested in trade policy, labor rights and environmental issues that guided its implementation.
Tariff reduction within the first seven years helped moderate prices of consumer goods and production inputs. In this period, production in North America grew by over 30 percent, compared to slightly less than 20 percent in the preceding years. The dollar value of Canada’s merchandise exports to the US and Mexico increased by 109 percent between 1993 and 2000, which was substantially higher the growth in exports to ROW at 29 percent over the same period.
Trade liberalization made goods and services, including agricultural food products, more accessible while lower tariffs meant that families paid less for the products. Canada’s merchandise exports to its NAFTA members climbed 95%, from US$117 billion in 1993 to US$229 billion in 2001 while exports to the rest of the world in the same period increased by only 5%.
At the end of the first ten years, NAFTA has improved economic growth and living standards in the three countries and also established a strong foundation for future growth while demonstrating that trade agreements can benefit citizens (DFAIT, 2003). However, some issues need to be addressed to stimulate Canada/US trade. These include export-related transaction costs, mutual recognition and the “Uncitral
Model Law on International Commercial Conciliation” that facilitates the effective resolution of private commercial disputes by a harmonized legal framework within member nations.
3.0. Analysis of Canada/US Agricultural Trade Flows
This section offers a broad overview of Canadian agricultural trade flows with the US, with special emphasis the changes that took place after 1988, the year prior to the implementation of CUSTA. The first part describes aggregate agricultural trade between Canada and the US, and compares it to the rest of the world. The analysis is based on three economic classifications namely bulk, processed intermediate and consumer-oriented products. The second part analyzes NAFTA’s impacts on grains and grain products, oilseeds and oilseed products, livestock and animal products, vegetables and fruits. The analysis undertaken in this study utilizes descriptive statistic techniques.
3.1. Aggregate Trade Analysis
Canadian bilateral agricultural trade flows with the US have experienced a steady growth after the implementation of NAFTA as shown in figure 1. The share of Canadian exports to the US rose from 31 percent in 1988 to 67 percent of total exports in 2002 while imports from the US grew from 54 percent of total Canadian imports to 64 percent (Figure 1). In general, agricultural trade flows between Canada and the US since 1992 have favored Canada. Total Canadian exports have increased from $20 billion in 1996 to $26 billion in 2002, while total imports grew from $13 billion to $21 million in the same period (AAFC, 2003). In the same period, agricultural exports to the US increased from $10 to $17 billion, accounting for 67 percent of total agricultural exports, while total imports from the US increased from $8 billion to $12 billion, accounting for 64 percent of total agricultural imports (AAFC, 2003). The increased Canada/US agricultural trade flows can largely be attributed to NAFTA.
Canadian agricultural exports after 1996 ware dominated by consumer oriented produc followed by bulk while intermediate products made the least contribution. In 2002, tota consumer oriented exports were valued at $14 billion, accounting for 86 percent of total agricultural exports, representing an i
of 104 percent from 1996 (AAFC, 2003). Exports in this category to the US were valued at $12 billion, accounting for 4 percent of total agricultural exports, which was equivalent to a 120 percent increase 1996 (AAFC, 2003). Imports of the consumer-oriented products from the US were valued at $9 billion, accounting for 43 percent of total agricultural imports and representing an increase of 64 percent from 1996 (AAFC, 2003
consumer oriented exports were valued at $14 billion, accounting for 86 percent of total agricultural exports, representing an i
of 104 percent from 1996 (AAFC, 2003). Exports in this category to the US were valued at $12 billion, accounting for 4 percent of total agricultural exports, which was equivalent to a 120 percent increase 1996 (AAFC, 2003). Imports of the consumer-oriented products from the US were valued at $9 billion, accounting for 43 percent of total agricultural imports and representing an increase of 64 percent from 1996 (AAFC, 2003
ts l ncrease 9 from ). anadian agricultural exports to the rest of the world increased from $7.5 billion in 1988 to $8.5 billion in
ian l ncrease 9 from ). anadian agricultural exports to the rest of the world increased from $7.5 billion in 1988 to $8.5 billion in
ian Figure 1 Percentage of Canada/US Agricultural Trade
0 10 20 30 40 50 60 70 80 1988 1989 1990 1991 1992 1993 1994 1995 1996 1997 1998 1999 2000 2001 2002 Percentage Exports Imports
Source: Agriculture and Agri-Food Canada
C C
2002, while Canadian agricultural imports from the rest of the world increased from $3.5 billion to $7.5 billion (AAFC, 2003). In 1990, 17 percent of the US agricultural exports went to Canada and Mexico, while by 2000 this share has expanded to 28 percent (Skorburg, 2002). Between 1988 and 1998, Canad exports to the US increased about 275 percent (Rattray, 2001). These numbers reflects a high degree of 2002, while Canadian agricultural imports from the rest of the world increased from $3.5 billion to $7.5 billion (AAFC, 2003). In 1990, 17 percent of the US agricultural exports went to Canada and Mexico, while by 2000 this share has expanded to 28 percent (Skorburg, 2002). Between 1988 and 1998, Canad exports to the US increased about 275 percent (Rattray, 2001). These numbers reflects a high degree of
Figure 3 Canada/US Trade in Oilseeds and Oilseed Products 0 200 400 600 800 1000 1200 1988 1989 1990 1991 1992 1993 1994 1995 1996 1997 1998 1999 2000 2001 2002 $ million Exports Imports
Source: Agriculture and Agri-Food Canada
10
asanada has become the most important destination for US exports in major commodity groupings, and th
.2. Sub-Sector Analysis
he sub-sector analysis considers Canada/US agricultural trade flows in grains and grain products, oilseeds ly
rain tariff elimination amongst NAFTA l ased m 3 S ,
rade in grain products also benefited with
.2. Sub-Sector Analysis
he sub-sector analysis considers Canada/US agricultural trade flows in grains and grain products, oilseeds ly
rain tariff elimination amongst NAFTA l ased m 3 S ,
rade in grain products also benefited with integration between Canadian and US agricultural economy. These trade statistics show that, NAFTA h in general benefited both Canada and the US with a steady trade growth between Canada and the US since the implementation of CUSTA and NAFTA. Canadian agricultural producers and agricultural food processors are now able to realize their potential by operating in a larger and more integrated North American economy.
C
also an important source for US imports of production raw materials and directly consumed products wi the implementation of NAFTA. Rattray (2001) supported the above conclusion by pointing out that there are more Canadian agricultural exports to the US than agricultural imports from the US. Agriculture, food and beverage have become most important bilaterally traded products in NAFTA. For example, Canada’s agricultural exports to the US more than doubled from $3,587 million in 1989 to $8,104 millionin 1994 and increased four fold to $17 billion in 2002.
e US more than doubled from $3,587 million in 1989 to $8,104 millionin 1994 and increased four fold to $17 billion in 2002.
33
T T
and oilseed products, live animals and their products and fruits and vegetables. The livestock sub sector analysis takes into account four major livestock categories and includes both bulk commodities and high processed products. These categories in livestock cover live animals, poultry and eggs, read meat and dairy products.
and oilseed products, live animals and their products and fruits and vegetables. The livestock sub sector analysis takes into account four major livestock categories and includes both bulk commodities and high processed products. These categories in livestock cover live animals, poultry and eggs, read meat and dairy products.
$ million
Figure 2 Canada/US Trade in Grains and Grain Products
0 500 1000 1500 2000 2500 3000 1988 1989 1990 1991 1992 1993 1994 1995 1996 1997 1998 1999 2000 2001 2002 Exports Imports
Source: Agriculture and Agri-Food Canada
G G
members increased Canada/US agricultura trade in this sector. Canadian exports in grains and grain products to the US incre from under $400 million in 1988 to close to $3 billion in 2002, while the imports in grains and grain products from the US grew fro under $300 million to $1.8 billion (Figure 2). In terms of grain trade, Canadian imports from the US were $270 million per year between 1988 and 2002, as compared to $15 million per year between 1988 and 1994. Similarly, Canadian grain exports to the U averaged $609 million per year 1988 - 2002 up from $369 million between 1988 and 1994 (AAFC, 2003).
members increased Canada/US agricultura trade in this sector. Canadian exports in grains and grain products to the US incre from under $400 million in 1988 to close to $3 billion in 2002, while the imports in grains and grain products from the US grew fro under $300 million to $1.8 billion (Figure 2). In terms of grain trade, Canadian imports from the US were $270 million per year between 1988 and 2002, as compared to $15 million per year between 1988 and 1994. Similarly, Canadian grain exports to the U averaged $609 million per year 1988 - 2002 up from $369 million between 1988 and 1994 (AAFC, 2003).
T T
Canadian grain products imports from the US averaging $569 million per year, up from $311 million between 1988 and 1994 while Canadian grain products exports averaged $827 million per year, up from $351 million between 1988 and 1994 (AAFC, 2003). These statistics imply that the grains sub sector in Canada/US have been positively impacted by the implementation of NAFTA Canadian grain products imports from the US averaging $569 million per year, up from $311 million between 1988 and 1994 while Canadian grain products exports averaged $827 million per year, up from $351 million between 1988 and 1994 (AAFC, 2003). These statistics imply that the grains sub sector in Canada/US have been positively impacted by the implementation of NAFTA
with member countries abolishing tariffs and other non-tariff barriers.
The value of Canadian exports in oilseed and oilseed products increased from $78 million in 1988 to $281 ile en
hough the two-way trade has appeared to fluctuate, Canadian markets have grown in importance to the s
anada/US vegetable oil has been a major beneficiary from CUSTA and NAFTA and this trade has been
h s and
ese s.
s
anada/US vegetable oil has been a major beneficiary from CUSTA and NAFTA and this trade has been
h s and
ese s. million in 2002 while oilseed imports from the US grew from under $350 million to over one billion dollars (Figure 3). The exports in oilseeds and oilseed products accounted for 2.7% of total exports wh the imports in this sub-sector accounted for 8% of imports. Canadian imports in oilseeds and oilseed products from the US averaged $185 million per year from 1988 to 2002, up from $113 million betwe 1988 and 1994 whileexports to the US averaged $32 million per year from 1988 to 2002, up from $13 million between 1988 and 1994(AAFC, 2003).
T
US agricultural trade in oilseeds and oilseed products. Between 1988 and 2002, US imports into Canada a a share of total imports in the oilseeds and oilseed products averaged 8.2 percent. Similarly, Canadian exports to the US as a share of total exports in oilseeds and oilseed products averaged 2.6 percent in the same period.
o Canada a a share of total imports in the oilseeds and oilseed products averaged 8.2 percent. Similarly, Canadian exports to the US as a share of total exports in oilseeds and oilseed products averaged 2.6 percent in the same period.
C C
substantial in both directions. According to USDA (2001), US vegetable oil exports to Canada increased from 37 thousand metric tons in 1988 to 315 thousand metric tons in 2000. Canada’s share of total US vegetable oil exports (in volume) grew from 2 percent to 15 percent over the same period. US vegetable oil imports from Canada (primarily canola oil) rose from 148 thousand metric tons to 636 thousand metric tons over the period of 1990 to 2000 with a valued of US $322 million in 2000. Althoug CUSTA and NAFTA have not greatly affected Canada/US agricultural trade in oilseed
oilseed products, tariff reductions under th two agreements have made a contribution to in crease two-way trade in processed product substantial in both directions. According to USDA (2001), US vegetable oil exports to Canada increased
from 37 thousand metric tons in 1988 to 315 thousand metric tons in 2000. Canada’s share of total US vegetable oil exports (in volume) grew from 2 percent to 15 percent over the same period. US vegetable oil imports from Canada (primarily canola oil) rose from 148 thousand metric tons to 636 thousand metric tons over the period of 1990 to 2000 with a valued of US $322 million in 2000. Althoug CUSTA and NAFTA have not greatly affected Canada/US agricultural trade in oilseed
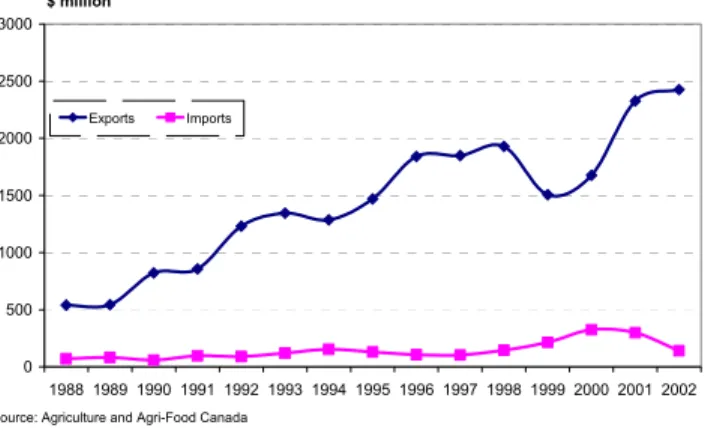
oilseed products, tariff reductions under th two agreements have made a contribution to in crease two-way trade in processed product Figure 4 Canada/US Trade in Live Animals
0 500 1000 1500 2000 2500 3000 1988 1989 1990 1991 1992 1993 1994 1995 1996 1997 1998 1999 2000 2001 2002 $ million Exports Imports
Source: Agriculture and Agri-Food Canada
Canadian live animal exports to the US favorably grew from $540 million to $2.4 billion between 1988 and 2002, while live animal imports from the US stagnated (Figure 4). In the same period, live animal exports accounted for 16 percent of total Canadian agricultural exports while live animal imports accounted for 1.8 percent of total agricultural imports.
Tariff reductions significantly contributed to the increased Canadian agricultural trade with the US in live animals. Canadian imports from the US in live animals averaged $142 million per year (1988 -2003), up from $96 million (1988-1994) while Canadian exports in live animals to the US averaged
$1.4 billion per year, up from $946 million in the same period(AAFC, 2003). Tariff elimination stimulated trade in live animals especially in the Western
Canada’s Prairie province where farmer’s heavily invested in animal production. The elimination of transportation
subsidies under the WGTA following the implementation of NAFTA also led some producers to shift from grain to live animal production in the Western C
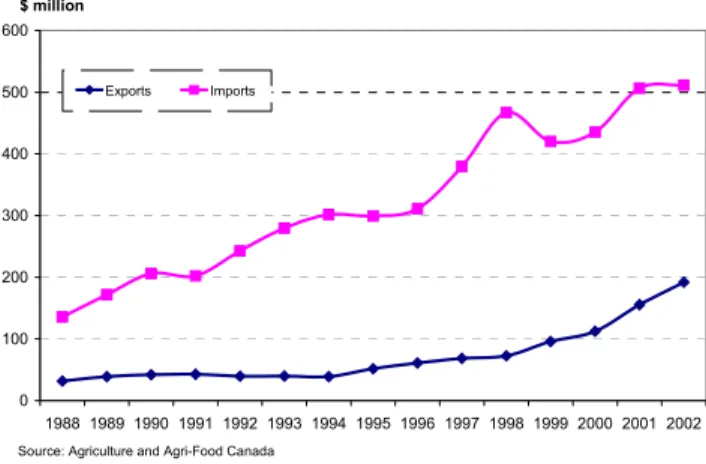
Figure 5 Canada/US Trade in Poultry and Eggs
0 100 200 300 400 500 600 1988 1989 1990 1991 1992 1993 1994 1995 1996 1997 1998 1999 2000 2001 2002 $ million Exports Imports
Source: Agriculture and Agri-Food Canada
anada.
nlike live animals, the US is a large ,
e U
supplier of poultry and eggs to Canada with Canada importing more from the US than it exports. The value of Canadian poultry exports to the US grew from slightly less than $32 million dollars in 1988 to $192 million in 2002 as compared to imports from the US that increased from $136 million to over $511million in the same period (Figur 5).
Data from Agriculture and Agri-Food Canada (AAFC) shows that Canadian imports from the US in poultry and eggs averaged $325 million per year from 1988 to 2002, up from $220 million between 1988 and 1994 while Canadian exports in poultry and eggs to the US averaged $72 million per year, up from $39 million between 1988 and 1994. The US is one of the world’s low cost poultry producers and consequently imports very little from other countries, including Canada. As with other
commodities, tariff reductions for poultry were accelerated and Canadian poultry now enters into the US duty free. However, under NAFTA, the USaccess to Canada’s chicken market is based on an import quota of 7.5 percent of the previous year’s Canadian production (supply management). When domestic production is limited, Canada allows supplementary imports from the US at the free NAFTA
rate. Canada also imports large quantities of US whole, liquid and frozen eggs for the processing sector.
Canadian red meat exports to the US just like live animal exports grew substantially when comparing to Canadian imports from the US. Read meat exports to the US increased from $661 million in 1988 to more than $3 billion in 2002 while
Canadian red meat imports from the US in the same period grew dismally from $257 million to $804 (Figure 6). According to the AAFC, Canadian imports from the US in red meats averaged $565 million per year from 1988 to 2002, up from $443 million between 1988 and 1994 while Canadian exports in red meats to the US averaged $1.5 billion per year from 1988 to 2002, up from $806 million between 1988 and 1994. The share of total imports in red meats averaged
Figure 6 Canada/US Trade in Red Meats
0 500 1,000 1,500 2,000 2,500 3,000 3,500 1988 1989 1990 1991 1992 1993 1994 1995 1996 1997 1998 1999 2000 2001 2002 $ million Exports Imports
7.5 percent, compared with 6.1 percent in 2002, while the share of total exports in red meats averaged 15.8 percent (AAFC, 2003).
Although most of Canada/US trade in red meats is duty-free, there still exist some duties on several categories. For instance, duties for processed pork ranged from (US) 1.2 cents per kilogram for sausages to (US) 6.4 cents per kilogram for canned hams in the US. Rude, (2001) demonstrated the importance of changing border measure by both countries, such as the elimination of Meat Import Laws, which has affected red meat bilateral trade. It can also be argued that other factors such as the abolishment of WGTA reduced feed costs in the prairies and affected the growth in Canadian beef exports. In addition, foreign direct investment has led to the establishment of some large beef processors, who have successfully integrated North American red meat market owing to their investments.
CUSTA and NAFTA have not had much effect on Canada/US dairy trade, as these agreements did not substantially address the quantitative restrictions that governed this trade (USDA, 2002). This sub-sector in Canada just like the case for poultry is under supply management measures. Canadian dairy exports to the US and imports from the US initially stagnated at around $20 million between 1988 and
1991. However, between 1992 and 1997, Canadian dairy imports from the US grew more than exports to the US. In the period after 1996, Canadian dairy exports to the US grew more than imports from the US and were valued at $144 million in 2002 as compared to dairy imports from the US valued at $126 million (Figure 7). These trends can be explained by the use of varying trade policy instruments that mixes, tariffs, non-tariff barriers, import quota’s and tariff rate quotas.
Figure 7 Canada/US Trade in Dairy Products
0 30 60 90 120 150 180 1988 1989 1990 1991 1992 1993 1994 1995 1996 1997 1998 1999 2000 2001 2002 CA$ million Exports Imports
Source: Agriculture and Agri-Food Canada
Canadian imports from the US in dairy products averaged $64 million per year from 1988 to 2002, up from $32 million between 1988 and 1994 while Canadian exports in dairy products to the US averaged $69 million per year from 1988 to 2002, up from $23 million between 1988 and 1994 (AAFC, 2003). CUSTA and NAFTA have had little impact on this trade as there was little change in dairy access under either agreement for the two countries and the share of total
agricultural trade was quite small.
Between 1988 and 2002, the share of total imports in dairy products averaged 0.8 percent, compared with 0.6 percent Figure 8 Canada/US Trade in Fruits and Nuts
0 300 600 900 1200 1500 1800 2100 1988 1989 1990 1991 1992 1993 1994 1995 1996 1997 1998 1999 2000 2001 2002 CA$ million Exports Imports
Source: Agriculture and Agri-Food Canada
between 1988 and 1994. The share of total exports in dairy products averaged 0.6 percent between 1988 and 2002, compared with 0.5 percent between 1988 and 1994 (AAFC, 2003).
Market access in dairy products was limited by quotas and prohibitive tariffs on over-TRQ (tariff-rates quota) quantities. The US maintained a series of quotas on dairy products under its Agricultural Adjustment Act of 1932. In the meantime, the US also maintained a system of TRQs for dairy product imports as it was entitled to such TRQs under the URAA and NAFTA. Under CUSTA and NAFTA, the US eliminated its tariffs on Canadian dairy products over the 9-year period that ended on January 1, 1998 but also retained its quotas until the URAA took effect. Prior to URAA, Canada maintained a system of import quotas and licensing requirements to protect the domestic supply management regime for dairy. Under URAA, Canada converted the import quotas for dairy products to a series of TRQs. Canada has been gradually eliminating its tariffs on the US dairy products under NAFTA, although most quotas and licenses remained in place.
Canada/US agricultural trade in vegetables and fruits was well established even before the
establishment of NAFTA. After the implementation of CUSTA and NAFTA, Canada/US agricultural trade in this area has grown steadily. Over the last decades, the US solidified its position as Canada’s main foreign supplier of vegetables and fruits. For instance, according to USDA (2001), the US accounted for 81 percent of Canada’s vegetable imports during 1994 -2000, as compared with 70 percent during 1984-88. Canadian imports from the US in fruits and nuts averaged $1,296 million per year between 1988 and 2002, up from $1,049 million per year between 1988 and 1994 while Canadian exports in fruits and nuts to the US averaged $185 million per year, up from $105 million in the same period (AAFC, 2003).
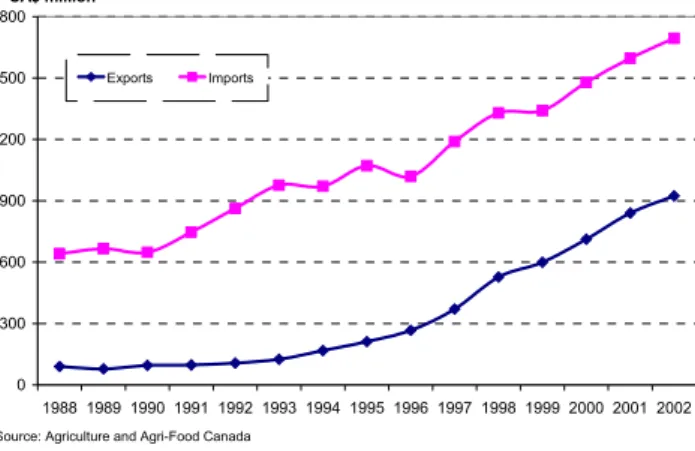
Figure 9 Canada/US Trade in vegetables Excluding Potatoes
0 300 600 900 1200 1500 1800 1988 1989 1990 1991 1992 1993 1994 1995 1996 1997 1998 1999 2000 2001 2002 CA$ million Exports Imports
Source: Agriculture and Agri-Food Canada
Although this sector represents a large share of all cross-border agricultural trade there was little change in policy under the agreements since trade in fruits and nuts had been tariff free even prior to NAFTA. Exports in this sub-sector to the US stagnated from $102 million in 1988 to $353 million in 2002 while imports grew from $969 million to $1.8 billion (Figure 8). Canadian fruits and nuts imports as a share of total agricultural imports averaged 17.5 percent between 1988 and 2002. In the same period, Canadian fruit and nuts imports from the US averaged 2 percent of total agricultural imports in the same period (AAFC, 2003).
Figure 10 Canada/US Trade in Potatoes
0 150 300 450 600 750 900 1050 1988 1989 1990 1991 1992 1993 1994 1995 1996 1997 1998 1999 2000 2001 2002 CA$ million Exports Imports
The impact of NAFTA on vegetable trade has been substantial particularly in tomatoes and potatoes, which constitute two of the largest components of Canada/US vegetable trade. Canadian vegetable exports to the US and imports grew consistently over the period under review. Canadian exports to the US in vegetables excluding potatoes increased from $91 million in 1988 to $924 million in 2002 while imports from the US rose from $641 million to over $1.7 billion (Figure 9). On a yearly basis,
Canadian imports from the US in vegetables, excluding potatoes, averaged $1,082 million per year from 1988 to 2002, up from $788 million between 1988 and 1994 while exports to the US in the same sub-sector averaged $348 million per year from 1988 to 2002, up from $109 million between during the period under consideration. Canadian vegetables imports excluding potatoes averaged 14.0 percent of her total agricultural imports between 1988 and 2002 and stood at 12.9 percent in 2002. The share of total exports in vegetables excluding potatoes to the US in 2002 accounted for 3.2 percent as compared to an average of 2.1 percent between 1988 and 1994(AAFC, 2003).
Canadian potato exports to the US between 1988 and 2002 increased tremendously when compared to imports from the US at the same period (Figure 10). Exports to the US in this sub-sector increased from $66 million in 1988 to $878 million in 2002 as compared to US imports that increased from $68 million to $325 million in the same period. Canadian imports from the US in potatoes and potato products averaged $171 million per year from 1988 to 2002, up from $122 million between 1988 and 1994 while Canadian exports in potatoes and potato products to the US averaged $359 million per year from 1988 to 2002, up from $126 million between 1988 and 1994(AAFC, 2003). Between 1988 and 2002 Canadian potato imports as a share of total imports averaged 2.2 percent and was 1.7 percent in 1988. Canadian Potato exports to the US as a share of total exports in potatoes and potato products averaged 3.3 percent between 1988 and 2002, as compared with 2.4 percent during 1988-94 and 2.0 percent in 1988.
4.0. Conclusion
This study analyzed the effects of CUSTA and NAFTA on Canada/US agricultural trade flows. Canadian bilateral agricultural trade flows with the US has generally experienced a steady growth after the implementation of NAFTA with trade flows seemingly favoring Canada more than the US since 1992. Similarly, Canadian agricultural trade with the ROW during this period expanded but Canada’s trade with the US grew more than her trade with the ROW. Though the two-way trade has appeared to fluctuate at times, Canadian markets have grown in importance to the US agricultural trade in
products. The agreements also contributed to a geographical reorientation of agricultural trade flows from a South-North direction to a North-South direction. The increased Canada/US agricultural trade flows can largely be attributed to the implementation of NAFTA. However, other factors outside NAFTA also significantly contributed to the increased bilateral trade flows as indicated.
Canada has become the most important destination for US exports in major commodity groupings, and also an important source for US imports of production raw materials and directly consumed products since the implementation of NAFTA. The composition of Canadian exports also changed from the previous patterns and is now dominated by consumer goods, bulk and intermediate products in order of importance. Canadian agricultural producers and agricultural food processors are now better able to realize their potential by operating in a larger and more integrated North American economy as the two economies become increasingly integrated. Similarly, Canadian agricultural producers have gained preferential tariff free access to their largest trading partner.
At the industry level, the impacts of NAFTA on Canada/US agricultural trade was varied with the sub-sectors analyzed responding differently to the bilateral trade liberalization. While the grains sector was positively affected with expanded trade particularly in wheat, oil seeds trade was minimally affected since trade in this sector was largely free prior to the implementation of the agreements. The livestock sub-sector in Canada benefited most from NAFTA with the growth in live animal exports to the US being unmatched with any other sectors expansion. Dairy and poultry products continue to be heavily protected and as was the case for fruits, vegetables and nuts did not significantly benefit from NAFTA.
Tariff elimination stimulated trade in many commodity groupings and was shown to have enhanced trade in both live animals and livestock feeds especially in the in Western Canada’s Prairie province where farmer’s heavily invested in animal production. The elimination of transportation subsidies under the WGTA following the implementation of NAFTA led some producers to shift from grain to live animal production in Western Canada and reduced feed costs on the Prairies hence positively affecting the growth of Canadian beef exports to the US. In addition, foreign direct investment led to the establishment of large agricultural processors across the two borders who have successfully integrated the North American market to the benefit of farm producers.
However, NAFTA still remains strange and complicated with market access being prohibited in some sub-sectors sector especially in dairy and poultry products were supply management measures such as quotas and prohibitive tariffs on over-TRQ quantities continue to distort free trade. The US for example applies a series of quotas on dairy products under its Agricultural Adjustment Act of 1932 and also maintains a system of TRQs for dairy product imports as it was entitled to such TRQs under the URAA and NAFTA. Canada on the other hand maintains a system of import quotas and licensing requirements to protect the domestic supply management regime for dairy.
Besides NAFTA, the study also noted the contributions of other factors to the increased Canada/US agricultural trade flows. These would include, the geographical and climatic factors experienced in both markets, the long common shared border between the two countries and a history of reciprocal agricultural trade agreements. Macroeconomic factors such as the exchange rate volatility, the Asian financial crisis and political considerations were also shown to have affected the bilateral trade. In particular, the depreciating Canadian dollar relative to the US currency boosted the growth of
Canadian exports, as they become relatively cheap in US terms. The study therefore concludes that to large extend, the increased agricultural trade flows could be partly attributed to the agreements and partly to other factors outside NAFTA and CUSTA.
References
Anderson, James E. and Eric Van Wincoop (2001), “Gravity with Gravitas: A Solution to the Border Puzzle.” Working paper 8079, www.nber.org/papers
Cameron, Maxwell A. and Brian W. Tomlin (2000), The Making of NAFTA: How the Deal Was Done, Cornell University Press, Ithaca and London.
Department of Foreign Affairs and International Trade (2003), “NAFTA@10: A Preliminary Report.” www.dfait-maeci.gc.ca
Dufey, Gunter and Ulrich Hommel (1996), “Why there is Never Peace in International Trade: TheCase of Canada/US Economic Relations.” the University of Michigan Business School.
Eden, Lorraine (1998), “NAFTA - Analysis of the Grain Industry.” NAFTA web, http://wehner.tamu.edu/mgmt.www/nafta/
Fry, Earl H. (2003), “North American Economic Integration: Policy Options”, Policy Papers on the Americas, Volume XIV, Study 8. CSIS, July 2003.
Granatstein, J.L. (1981), “A Man of Influence: Norman A. Robertson and Canadian Statcraft
1929-1968.” From Michael Hart, The Road to Free Trade, Center for Trade Policy and Law,
Carleton University.
Hart, Michael (1998), “The Road to Free Trade.” Center for Trade Policy and Law at Carleton University.
Helliwell, John (1998), “How Do Border Effects Matter?” Brookings Institution Press, http://brookings.nap.edu.
Ndayisenga (1999), “The Effects of Free Trade Agreements on the Canada-USA Trade Flows in Processed Food Products.” Working paper for Agriculture and Agricultural Food Canada.
Office of the United States Trade Representative (USTR, 1999). “NAFTA Five Year Report.” www. uster.gov/naftareport/intro.htm.
PROMAR International (1997), “The US Agricultural Export Experience with NAFTA Partners.” American Farm Bureau, the voice of Agriculture, July 1997.
Rattray, Brian (2001), “A Canadian Perspective on North American Agricultural Trade Flows (1988-98).” Sixth Agricultural and Food Policy Information Workshop, Farm Foundation, USA, January 2001.
Randall, Stephen J. (2000), “Integrating Canada and the U.S.: The Historical Framework”, University of Calgary, Spring - Printemps 2000.
Rodrigue, Jean-Paul (2003), “The Gravity Model.” http://people.hofstra.edu/geotrans/index.html. Rude, James (2001), “Impact of CUSTA/NAFTA: A Canadian Perspective, Department of Agricultural Economics.” The University of Saskatchewan, Canada.
Ruffin, Roy J. (1999),“The Nature and Significance of Intra-Industry Trade.” Economic and Financial Review, 4th quarter 1999.
Skorburg, John (2002), “An Economic Analysis of NAFTA by Commodity, 1994-2000." American Farm Bureau, September 23, 2002.
United States Department of Agriculture (2002), “Effects of North American Free Trade Agreement on Agriculture and the Rural Development.” Electronic Outlook Report from the Economic Research Service,www.ers.usda.gov, July 2002.
Veeman, Michele, Terence Veeman and Ryan Hoskins (2001), “NAFTA in the Next Ten Years: Issues and Challenges for Agricultural trade and Policy.” NAFTA Conference, May 24 to 27, 2001. Zahniser, Steve and Mark J. Gehlhar (2001), “North American Agricultural Trade during 1975-1998: A Background Paper on Trade Flows.” Sixth Agricultural and Food Policy Information Workshop, Farm Foundation, USA, January 2001.