Worcester Polytechnic Institute
Digital WPI
Interactive Qualifying Projects (All Years) Interactive Qualifying Projects
January 2018
Forex Trading System Development
Mingkun Ma
Worcester Polytechnic Institute
Follow this and additional works at:https://digitalcommons.wpi.edu/iqp-all
This Unrestricted is brought to you for free and open access by the Interactive Qualifying Projects at Digital WPI. It has been accepted for inclusion in Interactive Qualifying Projects (All Years) by an authorized administrator of Digital WPI. For more information, please [email protected]. Repository Citation
Forex Trading System Development
An Interactive Qualifying Project Report
Submitted to the Faculty
of
WORCESTER POLYTECHNIC INSTITUTE
In partial fulfillment of the requirements for the
Degree of Bachelor of Science
By
Ziyan Ding
Mingkun Ma
Omar Olortegui
Trivani Shahi
Date:01/16/2018Report Submitted to: Professors Hossein Hakim and Michael Radzicki of Worcester Polytechnic Institute
2
Table of Contents
Abstract ………....……..….….5
Chapter 1: Introduction ………..…….…....6
Chapter 2: Background Information ……….…..…..….8
Financial Markets ………...……..………....9 Capital Market ………...…...…9 Stock Market ………...…...… 10 Bond Market ………...…...10 Money Market ………...…...10 Derivative Market ………...….11 Forex Market ………...…... 11
Forex Trading sessions ………...12
Best Times During the Day to Trade Forex ……….…………..13
Common Forex Trading Terms………14
Base/Quote Currency ………..14 Bid Price ………...…...15 Ask Price ………...…...15 Pip………...…...…………...15 Leverage ………...…...…...15 Lot Size ………...…...15 Short/Long ………...…....…...16 Margin call ………...…...…...16 Stop Loss ………...…...…...….16
3 Chapter 3: Overview of Portfolio
Management ………...18
Assets and Securities ………...18
Money Management ………..………...22
Risk Management ………..………...23
Chapter 4: Fundamental Analysis ………..……….23
Fundamental Indicators……….27
Gross Domestic Product………...………....27
Unemployment Rate………..………..………..29
Consumer Sentiment (Michigan Index)…………..………..………..30
Consumer Confidence………..……….30
Consumer Price Index………..………..………...31
Producer Price Index………..………..………..………...32
Current Account Balance………..………...…..………..33
Trade Balance ………...…..………..34
Beige Book ………...………..35
Durable Goods………...36
Retail Sales………....………….36
Personal Consumption Expenditures Price Index…………..…………....………..37
ISM Manufacturing Index………..………....…………..……….37
Industrial Production and Capacity Utilization………...………..38
Chapter 5: Technical Analysis ………40
Technical Indicators ………..…..……41
Support and Resistance………..………..41
Simple Moving Averages……….…….42
Exponential Moving Averages……….……….42
Volatility………44
Bollinger Bands………...………45
4
Relative Strength Index………..………...…………47
Average True Range Values………...………….49
Average Directional Index………...………..50
Chapter 6: TradeStation ………..…………51
Developing a Trading System ……….51
Set up………... ……53
Backtesting……….…. ……54
Manual Trading vs. Automated Trading ……….54
Analyze the Markets ……….56
Chapter 7: Methodology ……….58
Background Research (Market) ………...………...58
Design (Technical and Fundamental Analysis) ……… ……58
Optimization ………....………...59
Testing and Evaluation ……….59
Chapter 8: Results and Discussion ………...…....…...60
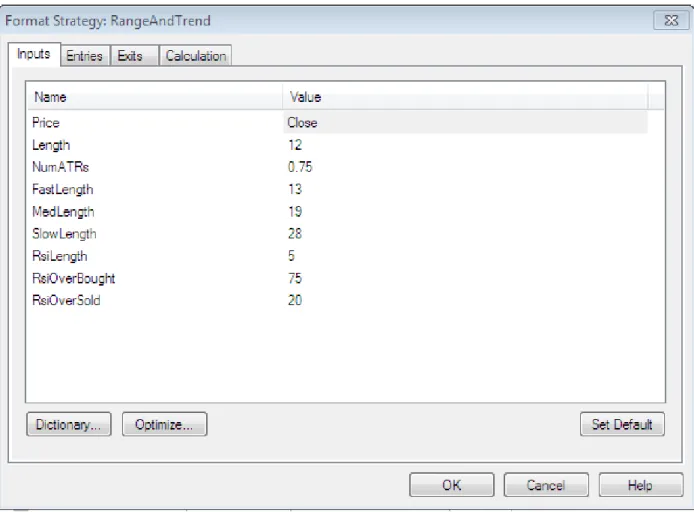
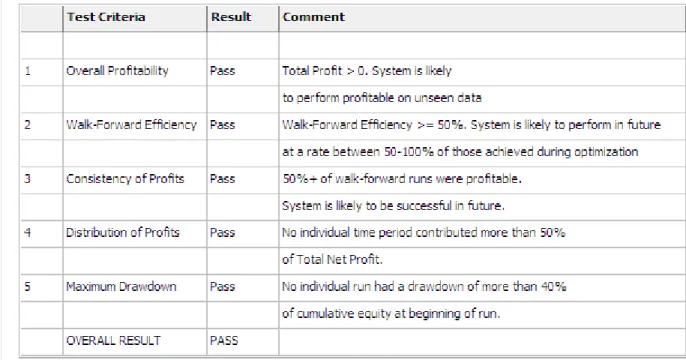
Ziyan Ding’s RangeAndTrend System ………...………60
Omar Olortegui’s Triple Moving Average System ………..………..79
Trivani Shahi’s Bollinger Band Trading System ………...87
Chapter 9: Conclusions ……….………...……….……….93
Ziyan Ding’s RangeAndTrend System ………...93
Omar Olortegui’s Triple Moving Average System……….93
Trivani Shahi’s Bollinger Band Trading System………94
Chapter 10: Recommendations………..…...96
Ziyan Ding’s RangeAndTrend System……….…………..96
Omar Olortegui’s Triple Moving Average System………....96
Trivani Shahi’s Bollinger Band Trading System……….………..97
Appendix Appendix 1. TradeStation Codes………...99
5
Appendix 2. Trade List Summary……….……….………102
Appendix 3. Weekly Progress Reports……….………172
Ziyan Ding……….………..172 Omar Olortegui………..……….188 Trivani Shahi………...………202 Mingkun Ma……….………...211 References………...………221
6
Abstract
This Interactive Qualifying Project introduces the Foreign Exchange market with an emphasis on fundamental and technical parameters, in order to get started as a Forex trader. The purpose of this project is to systematically create a profitable trading strategy in the Forex market. The group used $100,000 each in a
simulated account to trade different currency pairs on the TradeStation platform. During this process, two students in the group selected manual trading systems and the other two chose to trade automatically. After collecting the data, the group would compare the profits and constructed a most profitable system.
7
Chapter 1: Introduction
The purpose of this interactive project is to create a profitable trading system in the foreign exchange market. The trading system could be either automatic or manual using the TradeStation platform. The group was divided into two teams with one focused on manual trading and the other focused on automatic trading. Each person in the group created a personal strategy and then summarized them together to gain a broader sense of the foreign exchange markets.
The reason why the group members selected to study in this topic is that the world of investing and trading has developed so quickly in the last twenty years. The introduction of computers and the Internet changed the way people usually traded. Nowadays, normal individuals are able to trade with their personal laptops and phones, and this made more people come into the capital market. Some of them can work from home and be successful in the foreign exchange market, and make a living by investing in these markets with investment capital, research, and dedication. This makes the financial market more volatile and changing than ever before.
In this financial world, the foreign exchange market, which will be referred as Forex, is the market which trades with largest amount of money. Forex is a market that trades currencies from different countries. In this market two
currencies are traded against each other according to what the market believes to be the relative strength between these two. Before starting to trade forex, it is
8
important to acknowledge that the magnitude of analysis needed to understand this market may be considerably greater than other options; Forex requires the understanding and analysis of countries’ background, current news, and political and economic situation, plus the influence of the rest of the world’s economic environment. Being involved in the Forex market allows one to be informed into the world’s social, political, and economic situations, making people globalized citizens. By taking into account all of these factors, investors can make better informed decisions that can profound effect on creating a better trading system for themselves.
9
Chapter 2: Background Information
Financial Markets
In order to successfully trade in the financial market, the group first needed to investigate trading at an introductory level. Understanding the type of markets is necessary for the development of building a trading strategy.
A financial market is a broad term describing any marketplace where buyers and sellers participate in the trade of assets such as equities, bonds, currencies and derivatives. Financial markets are typically defined by having transparent pricing, basic regulations on trading, costs and fees, and market forces determining the prices of securities that trade.
Financial markets can be found in nearly everywhere in this world. Some of them are huge with trillion of dollars trading a day, while others might be very small with only a few participants. Here is an introductory level of the financial market.1
(Investopedia) Capital Market
Capital market is a market where buyers and sellers engage in trade of financial securities. The most famous of the capital markets are the stock market and bond market. The participants in the capital market consist of individuals and institutions. Capital market consists of primary markets and secondary markets. Primary markets deal with trade of new issues of stocks and other securities,
1 Introduction – Types of Financial Markets and Their Roles | Investopedia (n.d.) Retrieved April
2016, from
10
whereas secondary market deals with the exchange of existing or previously-issued securities. 2(Economic Times)
Stock Market
The stock market is the market in which the investors issue and trade shares of publicly held companies through exchanges and over-the-counter markets. Since the stock market provides companies opportunities to capital money in exchange for giving investors some percentage of company ownership, it is one of the most important component of a free-market economy. With the stock market, the investors can participate in the financial activities of the companies whose shares they hold. When the companies make profit, the investors receives profits
through the dividends and by selling their appreciated stocks at a profitable point.3 (Investopedia)
Bond Market
The bond market is the market in which the issuance and trading of debt
securities occurs. Most trades in the bond market arise over-the-counter through organized electronic trading networks. Bonds are very commonly used in
companies, municipalities, U.S. and foreign governments to finance a variety of projects and activities. The bond market is not open for all kinds of investors; only the investors on credit markets can buy or sell bonds. The main categories of bonds are corporate bonds, municipal bonds, U.S. Treasury bonds, notes and bills.4 (Investopedia)
2 Definition of ‘Capital Market’. (n.d.). Retrieved April 2016, from
http://economictimes.indiatimes.com/definition/capital-market
3 Introduction – Types of Financial Markets and Their Roles | Investopedia (n.d.) Retrieved April
2016, from
http://www.investopedia.com/walkthrough/corporate-finance/1/financial-markets.aspx
4 Introduction – Types of Financial Markets and Their Roles | Investopedia (n.d.) Retrieved April
11
Money Market
The money market is a segment of the financial market in which financial instruments with high liquidity and very short maturities are traded. Participants use the money market is a means for borrowing and lending in the short term, from several days to just under a year. Money market securities consist of negotiable certificates of deposit (CDs), bankers’ acceptances, U.S. Treasury bills, commercial paper, municipal notes, euro dollars, federal funds and
repurchase agreements (repos). Money market investments are also called cash investments because of their short maturities.5(Investopedia)
Derivatives Market
The derivative market is a market based on another market, which is known as the underlying market. Almost any underlying market can the base of derivative markets, such as individual stock market, stock indices, and forex market. There are many different forms of this market. The most common forms are futures market, options market, warrants market, contract for difference (CFD) market, and spread betting.6(Investopedia)
Forex Market
The Forex market is a global decentralized market for the trading of currencies. It is open twenty four hours a days, five days a week and all year round. As the most liquid market in the world, the participants include large banks, central banks, institutions, governments and retail investors. It is also the market trading the largest amount of cash value. In this market, the participants can buy and sell
http://www.investopedia.com/walkthrough/corporate-finance/1/financial-markets.aspx
5 Introduction – Types of Financial Markets and Their Roles | Investopedia (n.d.) Retrieved April
2016, from
http://www.investopedia.com/walkthrough/corporate-finance/1/financial-markets.aspx
6 Introduction – Types of Financial Markets and Their Roles | Investopedia (n.d.) Retrieved April
2016, from
12
currencies at current or determined prices. However, the Forex market does not determine the relative values of different currencies, but sets the current market price of the value of one currency as demanded against another.7 (Babypips)
In a typical Forex market transaction, a party purchases some quantity of one currency by paying some quantity of another currency. The modern foreign exchange market began constructing during the 1970s after three decades of government restrictions on foreign exchange transactions (the Bretton Woods system of monetary management established the rules for commercial and financial relations among the world's major industrial states after World War II), when countries gradually switched to floating exchange rates from the previous
exchange rate regime, which remained fixed as per the Bretton Woods system.8
(Wikipedia)
The performance of Forex market is influenced by lots factors, including political events, economic growth, inflation and other economic factors. Internal, regional and international political conditions and events can have a profound effect on currency markets. ct the strength of a nation’s currency. Reports such as GDP, employment levels and retail sales detail the levels of a country’s economic growth and health. Generally, the more healthy and robust a country’s economy, the better its currency will perform, and the more demand for it there will be. If there is a high level of inflation in the country or if inflation levels are perceived to be rising, usually a currency will lose value. This is because inflation makes things more expensive and so demand for that particular currency drops.
However, a currency may sometimes strengthen when inflation rises because of
7 What Is Forex? (n.d.). Retrieved April, 2016, from
http://www.babypips.com/school/preschool/what-is-forex/what-is-forex.html
8 Wikipedia.(n.d.). Foreign Exchange Market. Retrieved April 2016 from
13
expectations that the central bank will raise interest rates to combat rising inflation.9 (HY Markets)
2.2 Forex Trading Currency Pairs
There are many official currencies that are used all over the world, but there only a handful of currencies that are traded in the forex market. In currency trading, only the most economically or politically stable and liquid currencies are
demanded in sufficient quantities. For example, due to the size and strength of the United States economy, the American dollar is the world's most actively traded currency.
In general, the eight most traded currencies (in no specific order) are the U.S. dollar (USD), the Canadian dollar (CAD), the euro (EUR), the British pound (GBP), the Swiss franc (CHF), the New Zealand dollar (NZD), the Australian dollar (AUD) and the Japanese yen (JPY). In Forex Market, currencies must be traded in pairs. The table below show the commonly traded currency pairs.10
(Babypips)
Table 1. Major Currency Pairs in Forex Market
9 HY Markets. (n.d.). Forex. Retrieved April 2016 from
http://www.hymarkets.com/english/products_forexb.html
10 When Can You Trade Forex: Forex Trading Sessions. (n.d.). Retrieved April, 2016, from
14
Forex Trading Sessions
The Forex market can be broken up into four major trading sessions: the Sydney session, the Tokyo session, the London session, and the New York session. Below are the open and close times for each session:
New York opens at 8:00 am to 5:00 pm EST (EDT) Tokyo opens at 7:00 pm to 4:00 am EST (EDT) Sydney opens at 5:00 pm to 2:00 am EST (EDT) London opens at 3:00 am to 12:00 noon EST (EDT) And so, there are hours when two sessions overlap:
New York and London: between 8:00 am — 12:00 noon EST (EDT) Sydney and Tokyo: between 7:00 pm — 2:00 am EST (EDT)
London and Tokyo: between 3:00 am — 4:00am EST (EDT) Best Times during the Day to Trade Forex
15
Logically, the best time to trade is when there is an overlap in trading times between open markets. Overlaps equal higher price ranges, resulting in greater opportunities. Here is a closer look at the three overlaps that happen each day: U.S./London (8am to noon): The heaviest overlap within the markets occurs in the U.S./London markets. More than 70% of all trades happen when these markets overlap because the U.S. dollar and the euro are the two most popular currencies to trade. If a trader is looking for the most optimal time to trade, then this would be the ideal time.
Sydney/Tokyo (2am to 4am): This time period is not as volatile as the
U.S./London overlap, but it still offers a chance to trade in a period of higher pip fluctuation. The ideal currency pair to aim for in this period is the EUR/JPY pair, as these are the two main currencies influenced.
London/Tokyo (3am to 4am): This overlap sees the least amount of action of the three overlaps because of the time and the one-hour overlap gives little
opportunity to watch large pip changes occur.
Understanding the markets and their overlaps can aid a trader in arranging his or her trading schedule. Sometimes the profits come from the trade using the
overlaps and information asymmetry.11 (Babypips)
Common Forex Trading Terms
Base/Quote CurrencyThe base currency is the first currency quoted in a currency pair in Forex. The quote currency is the second currency quoted in a currency pair in Forex. For
11 Best Time of Days to Trade Forex. (n.d.). Retrieved April, 2016, from
16
example, for the EUR/USD currency pair, the EURO would be the base currency, and the U.S. dollar would be the base currency.12 (Babypips)
Bid Price
The bid price is the price at which a broker is willing to buy the base currency in exchange for the quote currency. This represents that the bid is the best
available price at which a trader will sell to the market.13 (Babypips)
Ask Price
The ask price is the price at which a broker is willing to sell the base currency in exchange for the quote currency. This means that the ask price is the best available price at which a trader will buy from the market.14 (Babypips)
Pip (percentage in point)
A pip is the smallest price move that a given exchange rate makes based on market convention. The value of one pip depends on the currency pairs and pricing convention. Because most of major currency pairs are priced to four decimal places (except Yen), the pip is defined to the last decimal point. For example, for the currency pair of Euro and U.S. Dollar (EUR/USD), the exchange rate of 1.2800 (1 EUR = 1.2800 USD) changes to 1.2810, the price ratio
increases by 10 pips. In this case, if a trader buys 1 standard lot ($100,000) of EUR/USD, paying USD 100,000, and after 5 pips change, the trader sells 1
12 How to Make Money Trading Forex. (n.d.). Retrieved April 2016, from
http://www.babypips.com/school/preschool/how-to-trade-forex/how-you-make-money-in-forex.html
13 How to Make Money Trading Forex. (n.d.). Retrieved April 2016, from
http://www.babypips.com/school/preschool/how-to-trade-forex/how-you-make-money-in-forex.html
14 How to Make Money Trading Forex. (n.d.). Retrieved April 2016, from
http://www.babypips.com/school/preschool/how-to-trade-forex/how-you-make-money-in-forex.html
17
standard lot, receiving USD 100,100 and achieving a profit of 100 USD.15
(Investopedia) Leverage
Leverage is the use of various financial instruments or borrowed capital, such as margin, options futures and so on, to increase the potential return of an
investment, or the amount of debt for financing a firm’s assets. A firm is highly leveraged if it has significantly more debt than equity. Leverage is most
commonly used in real estate transactions through the use of mortgages to purchase a house.16 (Investopedia)
Lot size
In the forex market, there are three sizes of lots: micro, mini and standard. A micro lot consists of 1,000 units of the base currency. A mini lot equals to 10,000 units of the base currency. A standard lot is the equivalent to 100,000 units of the base currency.17 (Investopedia)
Short/Long
Taking a long position on a currency pair means that a trader buys the base currency and wants the value of the base currency will increase and/or the value of the quote currency will decrease. Taking a short position means that a trader
15 Pip | Investopedia. (n.d.) Retrieved April 2016, from
http://www.investopedia.com/terms/p/pip.asp?o=40186&l=dir&qsrc=999&qo=investopediaSiteSea rch
16 Leverage | Investopedia. (n.d.) Retrieved April 2016, from
http://www.investopedia.com/terms/l/leverage.asp?o=40186&l=dir&qsrc=999&qo=investopediaSit eSearch&ap=investopedia.com
17 Lot | Investopedia. (n.d.) Retrieved April 2016, from
http://www.investopedia.com/terms/l/lot.asp?o=40186&l=dir&qsrc=1&qo=serpSearchTopBox&ap =investopedia.com
18
buys the base currency and wants the value of the base currency will decrease and/or the values of the quote currency will increase.18 (Babypips).
Margin Call
A margin call usually occurs when an investor borrows money from a broker to make investments. When the investor decides to use margin to buy or sell securities, he actually pays for them with both his own funds and borrowed money from a broker. A margin call is the demand of a broker on an investor using margin to deposit additional money or securities so that the margin account is brought up to the minimum maintenance margin. When the account value depresses to a value calculated by the broker, the investor receives the margin call.19 (Investopedia)
Stop Loss
A stop loss order is an order which a broker places to sell a security when it reaches a certain price. It is designed to limit an investor’s loss on a position in a security. If the value of a trade is below the predetermined certain price, a market order will be triggered and it will be sold at the next available price. Stop loss order performs well if the market is declining in an orderly manner, but not if the decline is disorderly or sharp. 20(Investopedia)
18 How to Make Money Trading Forex. (n.d.). Retrieved April 2016, from
http://www.babypips.com/school/preschool/how-to-trade-forex/how-you-mak-money-in-forex.html
19 Margin Call | Investopedia. (n.d.) Retrieved April 2016,from
http://www.investopedia.com/terms/m/margincall.asp
20 Stop-Loss Order | Investopedia. (n.d.) Retrieved April 2016 from
20
Chapter 3: Overview of Portfolio Management
Assets and Securities
It is best to know and understand the different types of securities and
investments, in order have a better understanding of options that can be taken when investing in the markets. There are several types each with its own advantages and risks.
Stocks
Stocks may be the most well known security. A stock is a security that represents a claim on the corporation’s assets and earnings. There two types of stock, common and preferred. A common stock usually gives the owner the ability to vote at shareholders’ meetings and receive dividends. Preferred doesn’t necessarily give you the benefit held by common stock, but gives investors a higher claim on assets and earnings.
An investor may buy the stock of a specific company for many reasons. The first being, capital appreciation or profit, when the stock increases in price. Stocks out of the securities listed later on, offer “the greatest potential of growth (capital appreciation) over the long haul. Investors willing to stick with stocks over long periods of time … have been rewarded with strong, positive returns.” according to the Securities Exchange Committee (SEC 2016). Another is the dividend payments which occur when the company the stocks is bought from distributes the earnings made to stockholders. Lastly, while not pertaining to profit, by owning a large amount of shares in a company, it may be possible to attend shareholder meetings and be able to influence the company.
21
Mutual Funds
Mutual funds are made up from a fund created by pooling money from several investors. The goal of mutual funds is to use the larger group fund in order to invest in varying securities such as stocks, bonds and other assets. Mutual funds can have different objectives, such as high risk, low risk, long term, short term. A major advantage of a mutual fund is that it can afford to purchase different
securities that not only diversify it, but create a portfolio that an individual may not be able to afford or manage.
Exchange Traded Funds (ETF)
An exchange traded fund, or ETF, is a security that can be bought similar to a stock, in the stock market. ETF’s focus on tracking an index, bond or major assets. ETFs are similar to mutual funds but generally have a higher daily liquidity and lower fees that a mutual fund share. The can also experience several price changes throughout the day, as they are being exchanged. Some examples of ETF’s are the Spider (SPY) that tracks the S&P 500 Index, or the QQQ that tracks the Nasdaq 100. Investopedia brings attention to several that track specific industries such oil (OIH), energy XLE or commodities such as gold (GLD) and silver (SLV) (Investopedia-. While not as well-known there are other ETF’s which tracks the movements of currency globally.
Currency ETFs are similar, but are usually invested in one type of currency or several. The goal of Currency ETF’s is to imitate the pattern of the currency in the foreign exchange market. They can be popular with investors that want to get into to the field of the foreign exchange market, but not necessarily trade
individually. The more common currency ETF’s following the top international currencies such as the USD, CAD, EURO, British pound and JPY.
22
Hedge Funds
Similar to the mutual funds, are the hedge funds. Hedge funds are a different type of investment opportunity. Traditionally, these usually focus on using a large fund in order to make a high return. Hedge funds are usually run by a private investment group that opens to certain investors. The manager of the hedge takes a percentage of the profits. When money is pooled into a hedge fund, the individual takes a percentage of the profit, but doesn’t own individual assets of the hedge fund.
Commodity
Basic goods that are commercially used an exchangeable with others of the same type, are commodities. They can be traded on in a commodity exchange, as long as they reach the minimum standards. Commodities are products with little differentiation, such as oil, gas, grains and gold. Some new technological ones include cell phone minutes and bandwidth. The exchange, including the sale and purchase of commodities are usually done by futures contracts, which help set the standards, quantity and quality of the goods exchange.
Portfolio Optimization
The list of securities mentioned before gives an idea of options that can be chosen in order to create a portfolio. A portfolio is simply a collection of different securities, bonds, and valuables that work together or follow a methodology. The goal of a successful portfolio is to raise cash or money for the investors of that portfolio. A portfolio only consisting of one type of investment may become unstable or high risk. Regardless of the securities chosen, the price or growth of
23
the security can be affected by outside factors. For stocks these can be faulty products or bankruptcy from a company. For the foreign exchange market, changes in the stock market or political events can drastically change prices, or create instability. By adding different types of investments such as cash, stocks, and the ones mentioned above to your portfolio, you are diversifying it.
Diversification is a major component, that can help reach long term financial goals, and also helps minimize risk.
The securities in those fields should also vary between high risk and low risk and growth. Often the differing rates of return average each other out, so that major losses will be evened out by major gains. They should also attempt to pick different industries, in case there is an unforeseen event that would
systematically hurt the portfolio. Also, according to Investopedia, “Portfolio theory tells us that after 10-12 diversified stocks, you are very close to optimal
diversification” (Investopedia #). While our group is mainly focusing on the foreign exchange market, it should be noted that a well-diversified portfolio or fund should have more assets.
Along with diversification is pruning. This means cutting out or allocating more investments in parts of the portfolio that is successful. For example, let’s say there is a portfolio that is a collection of several hedge funds that act as their own system. It may be better in the long run to remove any that consistently have a negative loss. The reverse should also happen, allocate more money in systems that are faring better.
24
Money Management
Money management includes budgeting, saving, investing, spending and any other usage of cash by an individual or a set of people. The word, money management, in financial markets usually implies that the money is under the supervision of an investment professional. That investment professional is the decision maker for the money for uses such as mutual funds or pension plans. Usually the investment professional, works in a group with people in several fields of expertise, from research and investment options to noting the assets and determining what action to take. The group will have a fiduciary duty to create a portfolio or find a compatible security. In exchange for these services, a fee, usually a percentage of earnings from the fund, is given to the money
management group.
However, an individual investor can oversee his or her own investments. This comes with a greater set of risks, especially if the investor has limited knowledge of the market. Money put into any security should not be the last of your savings, but rather what you can afford to lose, especially when trading as an individual in the foreign exchange market. When in the foreign exchange market, you should only risk a small percentage of your account on each individual trade. As such, it is key to know how much can money can be put in a single trade and lost without preventing you from trading in the future. A rule of thumb method described by Babypips is the Anti-Martingale rule: “: bet more when you are on a winning streak and less when you are losing. Also, never bet more than 1% of your core equity (starting balance-amount in open positions)” (Babypips 2015). This allows you to endure losing streaks and large drawdown in your account. The less you risk on a trade, the less your maximum drawdown will be. The more loss, the
25
harder it is to breakeven, or even stop a continuous downward spiral in your account.
Even though an individual investor can join the Forex market with a small amount of money, doesn’t necessarily mean they should. When it comes to the Forex market, the starting capital can greatly affect their total profitability. According to Jeremy Wagner, head of Forex trading instructor, “through the analysis of
thousands of trading accounts is that traders with larger account balances tend to be profitable on a higher percentage of trades” (Wagner 2011). The cause of this result is attributed to effective leverage. Smaller traders have the tendency to be less experienced and therefore are more likely to have higher levels of effective leverage. This can cause a harmful cycle, where investors get emotionally
involved either continue to increase their accounts leverage or give up. Investors with large funds, a likely to see larger profits and act more conservatively, and thus minimize their risks. It is recommended to start with at least a fund of $5,000 for this reason, with a maximum leverage of 10:1.
Risk Management
Risk management is identifying the risks, uncertainty and acceptance of gains and losses in comparison to their investment goals. Risk tolerance is the degree of variability or uncertainty that the investor is willing to endure. Because a portfolio is going to have upward and downward trends, the investor’s risk
tolerance should be able to withstand such losses. Many risk averse people may choose to have a long-term low risk investment, while others with a lower risk aversion may choose the opposite. Investors should evaluate their own risk tolerance when creating their portfolio. During market downswings, investors of mutual funds often become concerned by their perceived losses and pull their
26
assets from a mutual fund to avoid further losses. This is harmful to the mutual fund and the client. This usually happens when a client is given a portfolio that is more volatile than he or she is comfortable with. This is a result of when client’s risk tolerance is overestimated. The opposite can occur where the investor feels like they can take more risks for greater growth.
27
Chapter 4: Fundamental Analysis
Fundamental analysis is the study that spotlights political, social, and economic issues that influence the currency of a nation. The troublesome part is breaking down what components influence supply and demand. These components regulate if the economy of a specific nation is either weak or strong. A great economy delivers higher value in its currency. But there are a few special cases; nations that depend heavily on imports may intercede in the foreign exchange market to control their currency value in light of the fact that despite that they might have a solid economy, they may not need their goods to end up overpriced on the grounds that it will drive their exports down.
Throughout the completion of the project we were required to utilize fundamental analysis. Keeping in mind the end goal to make profitable overall trades, it was essential that we had great comprehension on the current political, social and economic issues worldwide. We could look if the news could influence our
trading sessions by exploring Forex-related websites and relevant world financial news. These sites give the present news identified with unemployment, reports released or significant events going on and any other signals the spectator could study the effect level it would have in the Forex market.
There are a few elements that influence the strength of a currency with respect to others. Contingent upon the kind of economy of the nation, this will have diverse levels of effect in the economy; for instance, in an economy where the major
28
source of income are its exports, if the actual levels are under the projection then that is going to have a vast negative effect on the currency. A nation that has different methods for generating income will not suffer such a major impact. Likewise, there are a few currency forms that are "connected" to specific
commodities, being as they are huge exporters of them, or they are associated to each other; for instance, the Australian dollar is associated with gold and the Canadian dollar is inversely associated to oil. There are additionally, currency pairs that are correlated each other, for instance presently the EUR/USD and EUR/JPY are significantly correlated with each other. In this way, for our own particular purposes, we are going to study a few indicators that add to these issues and the impact it has on them.
Interest Rates
There are two types of interest rates, nominal and real. The nominal rate is the rate for which you get compensated for the amount of cash you have in the bank. For instance, assume you purchase a 1-year bond for face value that pays 5%. You pay $1,000 toward the start of the year and get $1,050 toward the end of the year. But the 5% made has not been accounted for inflation. This is the point at which the actual interest rate kicks in; the actual interest rate is the inflation subtracted from the nominal rate. At this moment, in the United States, having a savings account is not lucrative because the inflation rate is bigger than the nominal rate.
Inflation
Inflation is the rate of rise on the general monetary value of all merchandise and everyday services. For instance, if the cost of going to the movies for two used to be $20, inflation will raise that figure to $25 over a period of time, despite the fact
29
that the service is the exact same one. Forex trading Inflation indicators measure the inflation levels of a particular nation's currency in a given time. Keeping in mind a nation’s end goal of managing inflation, their response more often than not includes raising interest rates. This implies the particular currency in that nation rises in light of the newly assigned interest rates; this qualifies as a short-term effect that is reflected promptly in the Forex market. Before long, when the interest rates are high, this currency is then usually sold, and after that it drops once more.
Fundamental Indicators
Gross Domestic ProductThis is the most used of all indicators, as it is the broadest of all of them. It incorporates each sector of the economy and it represents to the total value of the nation's production amid the period and comprises of the purchases of
domestically produced goods and services by businesses, government elements and foreigners. The Gross Domestic Product (GDP) additionally has real and nominal value. The Nominal Gross Domestic Product measures the value of goods and services produced accounted for in their current costs. The Real Gross Domestic Product measures the value of goods and services provided accounted for in costs of some base year.
There are a few methods for measuring the Gross Domestic Product however by a wide margin the most generally utilized methodology
30
is the expenditure method where: GDP = consumption + investments + government spending + (exports − imports)
The GDP level of various nations can be compared against another by converting over their worth in national currency either by utilizing the current currency conversion rate, where the GDP is calculated by exchange rates prevailing on the international currency market. This method provides better signs of a nation's international purchasing power and economic strength. One more method for comparison is utilizing the purchasing power parity exchange rate, whereby the Purchasing of Power Parity (PPP) of every currency with respect to a chosen standard, i.e. the U.S. dollar, ascertains the GDP. This method offers a perspective of the real expectations for everyday comforts of lesser-developed nations as it adjusts for the shortcomings of local currencies in world markets.
This is vital in trading on the grounds that is a crucial measure of economic activity. Investors closely monitor the economy since it typically directs how investments will perform. The stock market likes to see healthy economic development since that means higher corporate profits. The bond market wouldn't fret growth however is to a great degree sensitive to whether the economy is growing too rapidly because this could only lead to inflation. The GDP report contains a great deal of data, because it not only gives an idea of how the overall economy is currently performing, but it additionally enlightens investors regarding important trends in the market. Gross Domestic Product components like consumer spending, business investments, private investments, and price (inflation) indices are great indicators of future market trends. The typical impact these have is that if actual estimations are better than the
31
forecasted one, and then it is beneficial for the currency and the other way around.
There are 3 versions of this report, advance (first), preliminary (second) and final (third). The Advance release being the first is usually the one with the biggest effect on the market. Data is commonly released amid the last week of the month. The first or advance estimate is released amid the last week of the month
following after the end of a quarter.
Unemployment Rate
The unemployment rate is a significant issue in the strength of an economy. It is essential for traders on the grounds that it acts as an indicator since it
demonstrates the proportion of individuals in the workforce that are currently unemployed, however are capable and willing to work. It is somewhat hard to calculate this proportion with precision given the fact that not all individuals who are not working either want or are able to work. Also, some might work from home, be in school, be disabled or have already retired. Subsequently, those individuals are not accounted for towards this proportion.
The unemployment rate is viewed as a lagging indicator. This implies it just changes after the monetary circumstances of the country have changed. This gives traders pieces of information about future interest rates and monetary policies. A lower than anticipated unemployment rate has a tendency to raise currency values since traders trust that it could lead to higher interest rates. On the other hand, higher than anticipated unemployment rates, for the most part, leads to a lower currency since it is relied upon to lower interest rates.
32
There are more indicators that keep up with the latest relevant news; allowing trading session be worthwhile. There are a few variables that influence the strength of a currency in respect to others. In this way, for our own particular purposes we are going to see a few indicators that add to these issues and the outcome it has on them.
Consumer Sentiment (Michigan Index)
Consumer Sentiment otherwise called the Michigan Index (since its source is the University of Michigan) covers more than 66% of the economy, therefore traders are continuously anxious to know what consumers are up to in order to predict how the market will behave. The more confident customers are about the economy and their own assets, the higher the probability of them spending. It is anything but difficult to perceive how the index of customer sentiment offers understanding to the behavior of the economy.
There are two month to month releases, the initial and final reading, much the same as the Conference Board's Consumer Confidence Index in light of expected and current conditions. The expectations index is a part of the
Conference Board's Leading Indicators index. The distinctive times released are Preliminary 10:00 ET on the second Friday of the month (information for current month) and Final 10:00 ET on the fourth Friday of the month.
33
Consumer Confidence
This indicator is released once every month by The Conference Board, more often than not toward the end and measures the level of a composite index based on surveyed households. An impartial level is in the range of 100 households. Figures beneath 75 are for the most part considered weak while levels above 125 are strong. A sharp drop in confidence can indicate that the economy is weakening; however the correlation between spending and
confidence figures is not too precise. This is vital in trading in light of the fact that the financial confidence of consumers dictate how much they will be spending, here in the United States, it depends on each individual’s cash flow and to what extent will they be consuming, which is critical.
Pessimistic consumers concerns foreign investors in the U.S. markets because it raises the likelihood of falling interest rates therefore weakening the economy, both of which are troublesome to the dollar's value. Foreign investors may sell the dollar and search for higher yields and a stronger currency. An optimistic consumer can raise interest rate and stock markets returns to levels that give a higher return in respect to different nations, which would result in an increased demand for U.S. dollars. Surveying multiple family households makes up this indicator; around five thousand on the relative level of present and future
economic conditions including work availability, business conditions and general economic circumstance. Regularly if the current level is higher than the
anticipated it is positive for the currency. In the event that it is opposite, it would have a negative effect the currency as previously stated.
34
Consumer Price Index
This indicator measures inflation as experienced by consumers in their everyday living expenses. The increase in Consumer Price Index (CPI) is the thing that the vast majority considers as the inflation rate. It is utilized by retailers as a part of predicting future price increases, by employers in calculating pay rates and by the government in deciding future cost-of-living increases for Social Security. Indications of inflation means the central bank needs to raise interest rates. The most generally utilized indicators for inflation is CPI. In the event that CPI is increasing, then it gives a central bank, for example, the Fed enough information to increase rates. Higher interest rates are considered bullish for a nation's currency.
The CPI is a measure of the change after some time in the costs paid by
consumers for a market based of goods and services. These goods and services incorporate CDs, news, shelter, food and clothing. Things on which the average consumer regularly spends money on, for example, food is given more weight, or significance, in calculating the index than other items on which the average consumer spends less, for example, apparel accessories, hats, etc.
Economic assistants record the costs of more than eighty thousand goods every month in order to create a measure for the CPI. The recorded data is sent to the national office of Bureau of Labor Statistics where commodity experts, who have thorough knowledge about the specific goods or services pricing, review the data. These experts check the information for consistency and accurateness and make any needed modifications or changes.
35
Producer Price Index
Merchants primarily utilize the Produce Price Index (PPI) as an indicator of inflation after some time. In spite of the fact that the similarly working Consumer Price Index (CPI) is thought to be a more helpful measure of current inflation, the PPI's incorporation of goods underway makes it an important indicator of price inflation in specific industries.
One key downside of the PPI for foreign exchange market applications is that the PPI excludes all information on imported goods, making it hard to recognize the impact of one nation's market on another regarding currency prices. The report communicates prices through a percentage index of a standard level of
production (as opposed to through a dollar amount), and it separates its data into three general categories: stage-of-handling, industry-based, and commodity-based. The report moreover shows changes in the index from month to month and the index change from the earlier year. The commodity-based and industry-based indices are greatly broad, permitting a high level of specificity when searching for data on a specific asset.
Current Account Balance
The Current Account Balance (CAB) is a function identifying with a nation's Balance of Payments (BOP). Essentially, it is the broadest measure of international streams of assets, goods, and services all through a nation.
Hypothetically, this level ought to be zero. The CAB can strongly reflect a nation's overall economic standing. In the event that the Current Account Balance of a nation is at excess, it then shows that the economy is a net creditor to the rest of the world. Furthermore, it exhibits the amount that nation is saving instead of
36
spending, implying that the nation is providing many resources to different economies, and is owed money because of it.
A CAB level that is in deficit though, demonstrates that an economy that is a net debtor implying that it is spending more than it is saving and therefore is utilizing assets from different economies in order to meet its own domestic consumption and investment requirements.A nation's CAB is an approach to decide its
economic activity and can be used to interpret the current degree of activity of its industries, services and capital market, and in addition to its credit or debts to other nations.
The formula utilized for obtaining the CAB is: CAB=X-M+NY+NCT. (Where X = Exports of goods and services, M = Imports of goods and services, NY = Net income abroad and NCT = Net current transfers.)
Trade Balance
This indicator measures the ratio of imports to exports that makes up the nation's economy. On the off chance that there are more exports, this implies there is a trade surplus and the trade balance will be positive. Then again if imports are higher, then there is a trade deficiency, and the trade balance will be negative. The significance of this indicator is clearly critical for any Forex trader in light of the fact that the data on the net exports can forecast future trends in inflation and foreign investment and can offer pieces of information to the future behavior of the currency market.
The trade balance is composed of three variables: the prices of goods, tax rates on imports or exports of goods and the exchange rate between two currency
37
types. This last element is fundamental to foreign exchange trading. Since trade balance depends intensely on current exchange rates, this is a key indicator for the state of a foreign asset market. For instance, this is the reason why Japan has as of late intervened such a great amount in their currency, since such a large number of individuals are buying, is making it stronger, something that Japan does not need in light of the fact that is unfavorable to their biggest source of income, their exports.
There are various measures for trade balance, however one of the main sources of data on the state of trade the U.S. is the International Trade report released month to month by the Census Bureau and the Bureau of Economic Analysis. This report is released around the third week of the month and points of interest the performance of many exported goods and services in various sectors of the economy.
Beige Book
The Beige Book is basically a summary of financial conditions. Every Federal Reserve Bank assembles data on their current economic condition in its District through reports from Branch directors, Banks and meetings with key economists, businessmen, market experts, and different sources. It summarizes this data by District and sector. This report permits outsiders to realize what the Fed
governors are looking at as they plan for their up and coming Federal Open Market Committee meeting.
The Fed utilizes this report, alongside different indicators, to decide interest rate policy at FOMC meetings. The Beige Book is viewed as an important tool, acting
38
basically as gage on the overall strength of the economy, and it is believed that once in a while it can have the ability to move market trends if the findings represent a noteworthy deviation from current analysts’ forecasts. In the event that the Beige Book depicts inflationary pressures, the Fed might raise interest rates, which is bullish on the dollar. In the event that the Beige Book depicts recessionary conditions, the Fed might bring down interest rates, which is bearish on the dollar. This is book is released eight times a year.
Durable Goods
Measures demand for U.S. manufactured durable goods, from both domestic and foreign sources. At the point when the index is increasing, it suggests demand is becoming stronger, which will most likely result in rising production and therefore creating more jobs. A falling index suggests the inverse. The durable goods orders reports serves to precisely measure the dollar volume of all orders,
shipments, and unfilled requests for the previous month. For this reason, durable goods are characterized as those goods with an expected lifespan of three years or more.
This report is prominent for its narrow category of non-defense capital goods which tend to reflect the GDP category Producers’ Durable Equipment (PDE) where shipments of nondefense goods are a good proxy for PDE in the present quarter, while giving a sign of PDE growth in the coming quarters. This report is released by the Census Bureau of the Department of Commerce around the 26th of the month at 8:30am eastern time for information of the previous month.
39
Retail Sales
This is an assessment of the total sales of good by all retail establishments in the U.S. for the month earlier of the release of the report. Information is presented in nominal dollars. Be that as it may, the information is adjusted for seasonal, holiday and trading day changes between the months of the year.
The utilization of the Retail Sales report in trading is clear, because the report gives to great degree specific information about which industries and
commodities consumers are spending the vast majority of their money on. In any case, one significant downside of the report is that it just reflects sales prices without considering inflation of certain volatile industries (gas and different energies specifically.) The report also does not give any information on service industry sales, making the Personal Income and Spending report more valuable in this aspect. Still, traders consider the Retail Sales report a standout amongst many and consider it one of the most useful economic indicators, with an extensive variety of utilizations for different asset markets.
This indicator is essential in light of the fact that the Personal Consumption
Expenditures (PCE) speaks to around 66% of the GDP. By observing retail sales, policy makers can make an assessment of the growth of PCE for present and future quarters. The reports' source is the U.S. Division of Commerce and it is released month to month.
Personal Consumption Expenditures Price Index
Individual Consumption Expenditure, or PCE, is an inflation index like the
40
the Department of Commerce releases it and it is the ideal gage of inflation used by the Federal Reserve.
ISM Manufacturing Index
The ISM Manufacturing Index is utilized as an economic indicator. It is believed that this survey is essential in figuring out what the market is probably going to do, and the Institute for Supply Management distributes it, on a month-to-month
premise. The report will demonstrate data from the earlier month's recorded information, and is released on the first business day after the end of the month.
This indicator gives subtle information about the manufacturing part of the economy, and it is therefore viewed as a solid indicator of the economy's
development. It is the first report of the month, as far as economic indicators go, which is why it should have a more significant attention and benefit to look into. The survey deals particularly with the manufacturing industry in the nation. ISM gives an extensive range of different reports also that help determine risk in the market at any given time.
Industrial Production and Capacity Utilization
This indicator is influences both the inflation and the GDP side of the economy, a the reason why it does is because the Industrial Production and Capacity
Utilization (IPCU) is a measure of economic activity, released on a month to month premise by the United States Federal Reserve. The IPCU report for every month contains information for earlier months (for instance, December’s report releases data for November) about the total amount of U.S. industrial production
41
for that month, expressed as a percentage of the gross production for a past baseline year. The report also gives data about percentage changes from month to month and year to year, and a detailed analysis of production by industry grouping, with an emphasis on mining, utilities and manufacturing. The information in the report depends on employment records that detail the aggregate hours worked by the industrial-sector representatives.
The report additionally incorporates a measure of capacity utilization, which means the percent ratio of actual production to potential production. The report presents information about average capacity over various years, a record of percent change in capacity from month to month, and a breakdown of capacity measures by industry and by stage of fulfillment from rough to finalized
products/goods.
Traders consider the IPCU report important as a gage for the future performance of assets in the marketplace. As a result of this, the report can likewise work as a trigger to increase buying or selling pressure in certain industries. A capacity utilization percent of 85% or more can be viewed as a sign for inevitable inflation, yet the characteristic struggle of measuring industrial capacity suggests this measure shouldn't be solely depended on to foresee market behavior.
This is an index intended to gage changes in the level of output in the industrial sector of the economy. The index is gathered by both industry such as
manufacturing, mining, and utilities; and raw materials and products/goods such as consumer goods, business equipment, and intermediate goods.
42
Chapter 5: Technical Analysis
Technical analysis is known as the approach and methodology in which a trader interprets the market in order to determine price trend. A trader can study
previous price movement to determine future market prices because it is believed that the market tends to repeat itself. This means if a price level has been held as support or resistance in the past, traders will recall this level and base their
trades using this knowledge. Along these lines you can find possible directions and therefore trends for price level by looking in the past for related patterns.
An extremely well known approach to determine trends is by focusing on the highs and lows in the charts. A peak is interpreted, as the exchange rate’s highest value in a predetermined timeframe and a trough is the lowest value taken by the price on the same timeframe. Trends are set up by numerous peaks or through going the same direction in the chart. Having trendlines aids the trader make a more informed decision on whether to go long or short on a currency price. An uptrend signals to buy, a downtrend proposes to sell. Reversals of a trend are also imperative while studying the market. While local lows are known as support levels, local highs are known as resistance levels. In the event that the price touches an uptrend resistance level and does not goes past it, it is an unmistakable sign of reversal. But, if the price breaks through the resistance level then there is even a stronger possibility for reversal to happen. This behavior can also be applied to downtrends and support levels.
43
The Forex market offers a wide range of technical indicators that are accessible to traders in all platforms. Technical indicators mainly consist of a series of data points used to anticipate movements in currency prices. The indicators that were relevant to this case study were: Fibonacci Numbers, Bollinger Bands, Volatility, PTS, support and resistance, moving average, exponential moving average.
Technical Indicators
Support and ResistanceThese indicators are levels that demonstrate when prices are likely to turn around. With practice, you are able to tell when prices are likely to reverse when there is a bounce on the resistance or the support levels. For the most part, the highest price reached in a certain timeframe is the resistance and the lowest price reached is the support level. One important aspect of support and resistance indicators is that the all the more repeatedly the current price tests such level without actually touching or breaking it, demonstrates that the region of support or resistance is exceptionally pronounced. Likewise, when the current price breaks through resistance, it could imply that the resistance is now the support. At the point when the price breaks through a support or resistance level, the strength of it relies on how the support or resistance levels have been holding up.
44
Figure 1: Support and Resistance Model examples in Forex21
Simple Moving Averages
Computing the average price of a security over a specific number of periods forms a simple moving average. Most moving averages are based on closing prices. A 5-day simple moving average is the five-day sum of closing prices divided by five. As its name implies, a moving average is an average that moves. Old data is dropped as new data comes available. This causes the average to move along the time scale.
21
45
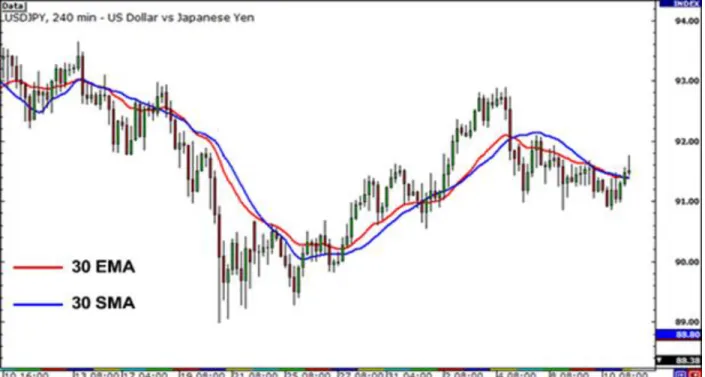
Exponential Moving Averages
Because simple moving averages are not too reliable when it comes to the representation of a noteworthy trend, mainly because of the presence of sudden spikes, you can utilize Exponential Moving Average (EMA) instead. The EMA aids in clearing the spikes as it puts more weight into calculation in the latest days. It likewise reacts quicker than the Simple Moving Average. The most ideal approach to utilize Moving Averages indicators is to plot distinctive sorts so you can see both the short and long term development of the market. The following table shows the pros and cons for SMA and EMA:
Table 2: Pros and Cons for SMA and EMA22
46
Figure 2: EMA30 vs. SMA30 graphical representation23
Volatility
There are several different volatility indicators. Even so, main function of a volatility indicator is to measure the variation of price or currency over a specific period of time. Large increases in prices increase the volatility, while low
fluctuations have a low volatility. Fluctuations in volatility are normal for a currency pair, however can demonstrate unpredictability. In Forex, seeing your currency-pair increase in value with a high volatility rate is a good sign. However, it can also be very worrying because a high volatility could result in a very quick collapse.
23
47
Figure 3: Volatility Indicators Examples (Daily FX)24
Above is an image of a volatility indicator from the dailyfx news (Stanley 2014). As you can see, volatility is a derivative of price. Instead of focusing on the increase, it focuses on the growth rate of the current price or exchange.
Generally, high levels of volatility expose traders to more risk than low volatility. In exchange, there can be higher gains as prices change dramatically. For experienced investors, it can be an opportunity to quickly gain money. However, for may not apply for new traders because it can stand as an even greater risk for them.
Bollinger Bands
Bollinger Bands is a type of indicator that attempts to predict the future
movements of the market by using past history. The main use of the Bollinger
24https://www.dailyfx.com/forex/education/trading_tips/daily_trading_lesson/2014/08/12/Measurin
48
band indicator is to tell whether the market is moving fast or slow and stable. It uses the concept of volatility and displays the appropriate trend lines so that investors can understand it easier. The method uses a lot of mathematical formulas; fortunately, TradeStation can implement this with any Forex currency pair automatically.
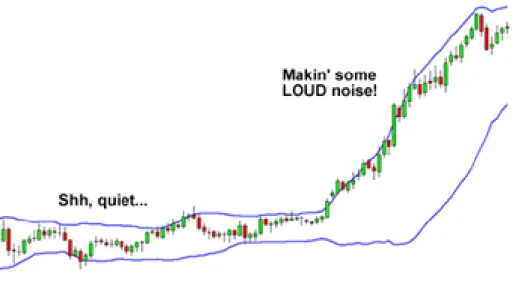
Figure 4: Bollinger Band Strategy Example (Babypips 2015)25
The Bollinger Band strategy follows a set of rules. The price tends to return to the middle of the bands. When the value is slow, the bands are close together. If the price moves up, the bands spread apart. Lastly, when the bands “squeeze” together, it usually means that a breakout will occur soon. This event is known as the Bollinger Squeeze. The focus of the indicator is mostly predicting the moment the market changes from stable to high change, and which direction the change will take place in.
49
Keltnel Channel26
Keltnel Channel (KC) is volatility-based envelope set above and below
exponential moving average. It is mainly used to measure the market trend and signal the possible price breakout. Although multiple variations can be used to calculate KC, exponential moving average is generally used to construct the midline. The channel distance is calculated by multiplying a constant, which is normally set as 1.5, with the Average True Range Values over a specific time period. Then, the upper band and lower band is set by plus or subtract channel distance from midline. The buy signals are usually generated when the price closes above upper bond of Keltnel Channel and the sell signals are usually generated when the price closes below the Lower Band.
26 Keltnel Channel. (n.d.). Retrieved January 1st, 2016, from
http://stockcharts.com/school/doku.php?
50
Figure 5: Keltnel Channel (20-day EMA, 1.5 x ATR)27
Relative Strength Index
Relative Strength Index (RSI) is a technical momentum indicator used in financial market to measure velocity and magnitude of directional price movement. It represents data graphically by oscillating between 0 and 100. The indicator is calculated using the average gains and losses of an asset over a specified time period, which is usually set as 14 periods. The following formula is used to calculate RSI:
27 Keltner Channel. (n.d.). Retrieved from
http://www.onlinetradingconcepts.com/TechnicalAnalysis /KeltnerChannel.html
51
RSI = 100 – 100/(1+RS) where RS is the average of x days’ up closes/the average of x days’ down closes.28 (Blystone)
The most basic application of RSI is used to identify areas that are potential overbought and oversold. Normally, RSI above 70 is interpreted as indicating overbought situations and is seen to be a bearish indicator. Conversely, RSI below 30 is interpreted as indicating oversold situations and is seen to be a bullish indicator.
Figure 6: RSI Overbought and Oversold conditions29
28 Blystone,D.(n.d.) Overbought Or Oversold? Use The Relative Strength Index To Find Out.
Retrieved April 24, 2016 from http://www.investopedia.com/articles/active-trading/ 042114/overbought-or-oversold-use-relative-strength-index-find-out.asp
52
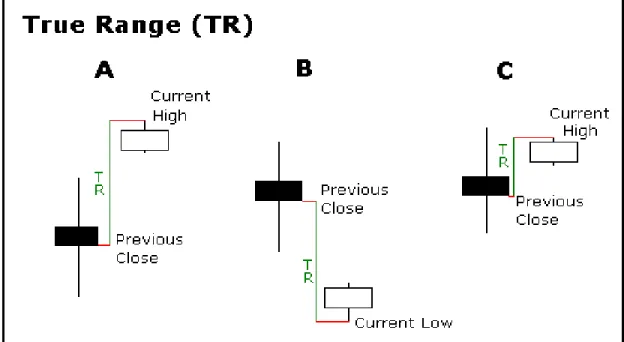
Average True Range Values30
The average true range (ATR) is a technical analysis volatility indicator introduced by Welles Wilder in his book: New Concepts in Technical Trading Systems. Wilder started with a concept called True Range (TR), which is defined as the greatest of the following:
1. Current High less the current Low
2. Absolute value of current High less the previous Close
3. Absolute value of current Low less the previous Close (absolute value)
The average true range (ATR) is an exponential moving average of the true range. Because it is based on TR, which is all positive number, ATR is always a positive number and reflects the volatility as an absolute level.
29 http://www.investopedia.com/articles/active-trading/
042114/overbought-or-oversold-use-relative-strength-index-find-out.asp
30 Average True Range (ATR).(n.d.).Retrieved March 1st, 2016 from
http://stockcharts.com/school/doku.
53
Figure 7: True Range Strategy Example31
Average Directional Index
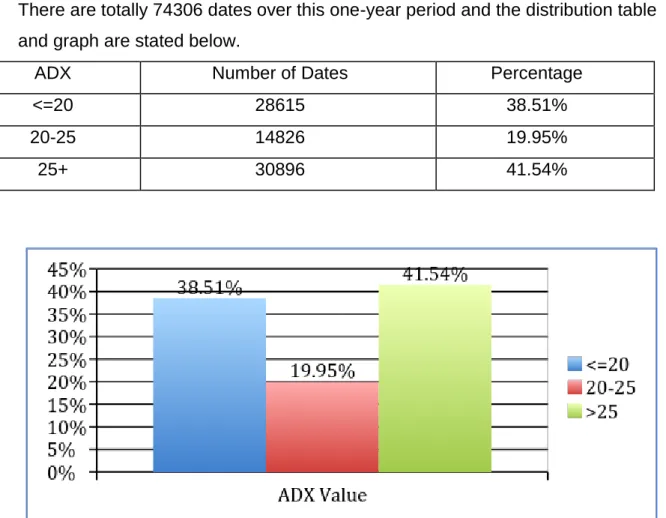
The average directional index (ADX) is a technical analysis indicator to measures the strength of prevailing trend and weather the movement exists in the market. It is calculated based on the moving average of price ranging expansion over a given period of time. It is non-directional and quantifies trend strength by rising in both uptrends and downtrends.32 (Schaap)
ADX values above 25 suggests the trend’s strength is strong enough for trend trading strategies and ADX values below 20 suggests the no trend is present.
31 Average True Range (ATR).(n.d.).Retrieved March 1st, 2016 from
http://stockcharts.com/school/doku.
php?id=chart_school:technical_indicators:average_true_range_atr
32Schaap,C.(n.d.) ADX: The Trend Strength Indicator. Retrieved April 24, 2016 from
54
ADX values between 20 and 25 are the gray zone that indicates some trend are emerged.33
33 Average Directional Index(ADX).(n.d.). Retrieved February 1st, 2016 from
http://stockcharts.com/school/doku.php?id=chart_school:technical_indicators:average_directional _index_adx