Network Anomaly Detection based on Multi-scale Dynamic
Characteristics of Traffic
J. Yuan, R. Yuan, X. Chen
Jing Yuan*, Ruixi Yuan, Xi Chen
Department of Automation, Tsinghua University Beijing, China 100084
*Corresponding author: [email protected] [email protected], [email protected]
Abstract: This paper proposes a novel detection engine, called the Wavelet-Recurrence-Clustering (WRC) detection model, to study the network anomaly detec-tion problem that is widely attractive in Internet security area. The WRC model first applies the wavelet transform and recurrence analysis to calculate the multi-scale dy-namic characteristics of network traffic, and then identifies network anomalies through the clustering algorithm with those dynamic characteristics. The evaluation results on DARPA 1999 dataset indicate that the WRC detection model can effectively improve the detection accuracy with a low false alarm rate.
Keywords: network anomaly detection, multi-scale dynamic characteristics, recur-rence analysis, WRC detection model.
1
Introduction
Currently, Internet suffers from a large number of different hacker attacks and threats fre-quently. In most cases, the hacking attacks cause anomalous traffic behaviors. Thus, how to accurately detect network anomalies by analyzing traffic behaviors becomes attractive in recent years. The basic idea of anomaly detection approaches is building the behavior profile of normal traffic and then identifying the observation of traffic as anomalous when it deviates from the nor-mal profile. These methods can be basically categorized into the following two aspects. The first common approach to detection network anomalies is to establish normal traffic profiles with time series analysis, and then to identify the statistical observation of traffic as normal or anomaly, based on the deviation between the observation and the prediction value. Some traditional time series analysis for detecting anomalies, such as exponential smoothing and the auto-regressive process, were utilized in [1], [2]. These time series methods all require traffic series to be station-ary. However, many prior studies indicated that traffic series are actually non-stationary and showed some nonlinear dynamic characteristics, such as self-similar, long range dependence and recurrence [3], [4]. Thus, statistical detection approaches by the use of traditional time series analysis may not be effective any more.
The other conventional approach for detecting network anomalies is built upon the machine learning theory. Based on statistical observations of traffic, such as the average packet size, the flow duration and the flow size, we can design and train effective classifiers to identify malicious traffic behaviors [5]- [7]. While these approaches do have a fast detection speed, they still have some problems, so that they are unreliable and may have high false alarm rates. For example, traffic statistical behaviors of the training dataset could be dissimilar to that of the testing dataset [8]. Also, traffic statistical observations have certain randomness and may vary along with network scales and application environments.
As the application of the two types of approaches above are both limited to some special scenarios, how to build new detection models especially with novel analysis tools is to effectively detect network anomalies with high detection accuracy and low false alarm rate, is definitely
of interest to researchers and engineers working in this area. Before trying to propose a new detection model, let us look into the network traffic again to see if there is any new essential element that can be a hammer onto the nail. As a matter of fact, there are two important properties of the network traffic – the multi-scale property and the recurrence property. Since our work is motivated by these two properties, let us have a brief review on them.
1) Multi-scale property: the network traffic has different statistical behaviors at different
time scales, i.e. during long time intervals observations show stable and periodic changes, while during short time intervals they are random and fluctuate sharply. Moreover, the prior study in [9] also indicated that different types of network attacks exist in different time scales. Thus, the multi-scale property of the network traffic is essentially important and should raise attention.
2) Recurrence property: the network traffic system is a complex dynamic system that
exhibits some nonlinear and intrinsic features, such as recurrence. Recurrence is a fundamental property of dynamic systems, which indicates intrinsic evolution regularities of traffic states. Compared with statistical observations of traffic, recurrence patterns of traffic states are inherent and uninfluenced by network scales and application environments.
In this paper, we propose a novel model, called the Wavelet-Recurrence-Clustering (WRC)
detection model, to detect network anomalies. To address the first property, we apply the
wavelet transform to analyze the network traffic at different time scales respectively, to build the accurate traffic profile and highlight local and random variations of traffic behaviors. To address the second property, we calculate the dynamic characteristics of the network traffic at different frequencies, to reveal non-stationary transition patterns caused by anomalous events, based on the recurrence analysis. Our WRC detection model incorporates both these two properties.
The main contributions of this paper are summarized as follows. (1) a nonlinear analysis method to calculate the multi-scale dynamic characteristics of network traffic by employing the wavelet transform and the recurrence analysis; (2) a detection model for identifying network anomalies based on dynamic characteristics; (3) evaluations and comparisons of the WRC de-tection model with traditional dede-tection methods on DARPA 1999 dataset.
The rest of this paper is organized as follows. Section 2 overviews the WRC detection model. In Section 3, the implementation of the WRC model is illustrated in detail. Section 4 shows experiments to evaluate the performance of the WRC model. Section 5 concludes our work.
2
WRC detection model
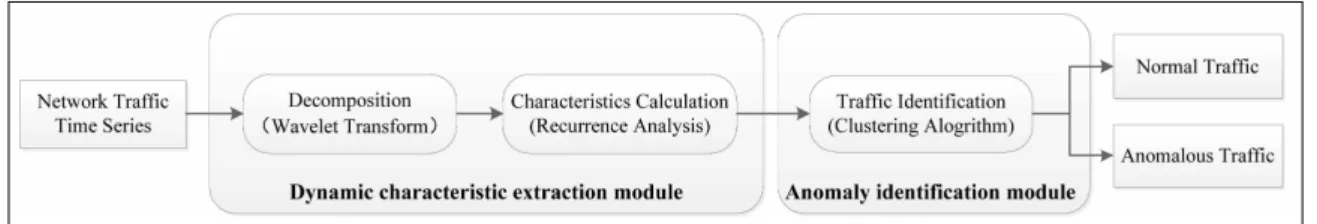
As shown in Fig. 1, our WRC detection model consists of two components, i.e., the dynamic characteristic extraction module and the anomaly identification module. In this section, we illustrate each module in detail.
2.1 Dynamic characteristic extraction module
Based on the recurrence property of network traffic states, we propose a multi-scale recur-rence characteristic extraction method. First, the wavelet transform is used to decompose and reconstruct the traffic at different frequencies, and then the recurrence analysis is employed to calculate the dynamic characteristics of traffic, which can effectively highlight the non-stationary transition patterns caused by malicious events and improve the performance of network anomaly detection.
A. Multi-scale analysis
Wavelet transform [10] is a multi-scale analysis method. It has a good time-frequency resolu-tion, i.e., gets the good frequency resolution at low frequencies and gets the good time resolution at high frequencies, which can help us to capture the traffic behaviors at different time scales. In this paper, we adopt the discrete wavelet transform (DWT) to reconstruct the traffic at different frequencies. DWT is a multi-stage algorithm that decomposes traffic time series into a coarse approximation and a series of detail information, which are used to reconstruct the traffic, by employing a scaling function (low pass filters, LP) and a wavelet function (high pass filters, HP). B. Recurrence analysis
Network traffic system is a dynamic system. The trajectory of traffic state shows recurrence phenomena in the phase space. Recurrence is a fundamental property of dynamic systems, which indicates the evolution regularities of the state trajectory, i.e., after a period time, the system state is identical or similar to the former states and the evolution patterns are repeating. Thus, based on this inherent property, our WRC detection model calculates the dynamic characteristics of network traffic to accurately describe traffic behaviors and reveal the non-stationary transition patterns.
1) Recurrence plot
In order to intuitively explore the recurrence phenomena, WRC detection model employs recurrence plot (RP) [11] to visualize the recurrence property of traffic states in the high-dimensional phase space into a two-high-dimensional plane.
Given a network traffic time series x = {xi}, i = 1,2, ..., n, the traffic system state can be
expressed as follows:
Xj = [xj, xj+τ, ..., xj+(m+1)τ] j= 1,2, ..., N (1)
wheremis the embedding dimension andτ is the time delay,N =n−(m−1)τ. After obtaining
traffic system states, we use RP to investigate the recurrence phenomena of traffic states. The mathematical expression of RP is shown as follows:
Ri,j = Θ(ε− ∥Xi−Xj∥) j= 1,2, ..., N (2)
where Ri,j is an element of the recurrence matrix, ε is the threshold, Xi is a system state in
the m-dimensional phase space, ∥ · ∥is a norm, N is the number of states, Θ(·) is the Heaviside
function defined as : Θ(y) = { 0 y60 1 y >0 (3) RP gives an intuitive description of the recurrence phenomena of traffic states in the phase
space. If the distance between the states Xi and Xj is smaller than ε, then the value of Ri,j
is 1 and there is a black dot at (i, j) in the RP; otherwise, the value of Ri,j is 0 and there is a
Compared with the normal traffic, the RP of the anomalous traffic exists wide white bands obviously (non-stationary transition of states), which indicates some malicious events happened.
0 200 400 600 0 100 200 300 400 500 600
(a) Normal traffic
0 200 400 600 0 100 200 300 400 500 600 (b) Anomalous traffic
Figure 2: The RPs of normal and anomalous traffic series 2) Recurrence quantification analysis
Recurrence quantification analysis (RQA) [12] is employed by our WRC detection model to quantify the structure textures shown in RP to reveal the evolution patterns of traffic states. The proper quantification variables studied are as follows.
(1) Recurrence Ratio (RR) is the percentage of recurrence points in the phase space, which measures the density of recurrence points in RP. If dynamic systems are periodic, the value of RR will be high. RR= 1 N2 N ∑ i,j=1 Ri,j (4)
whereRi,j is the recurrence point calculated by formula (2).
(2) Determinism (DET) is the ratio of recurrence points that form diagonal line structures in RP to all recurrence points. It measures the determinism of traffic systems, i.e., it can tell us how deterministic and predictable the system is. If the traffic system is periodical, the value of DET will be high. That is because the period system states can form long diagonal lines.
DET = ∑N l=lminlP(l) ∑N i,j=1Ri,j (5)
whereP(l)is the frequency distribution of diagonal line with lengthl. lminis the minimal length
of diagonal lines.
(3) Entropy (ENT) is the Shannon entropy of the probability of diagonal line lengths. It measures the complexity of traffic systems.
EN T =− N ∑ l=lmin p(l) log2p(l) (6) wherep(l) = ∑NP(l) l=lminP(l)
is the probability of frequency distribution of diagonal line l.
The dynamic characteristic extraction module calculates the above three quantification vari-ables of network traffic at different frequencies, in order to form the feature vectors to reveal the inherent traffic behaviors and discover the non-stationary transition caused by anomalous events.
2.2 Anomaly identification module
In our WRC detection model, a clustering algorithm, i.e., k-means [13] is employed to identify normal and anomalous traffic based on the feature vectors obtained from the dynamic charac-teristic extraction module. Detailed steps of k-means method for identifying anomalies are as follows.
Step 1: randomly selects k instances from the traffic training dataset to represent the
centroids of kclustersc1, c2, ..., ck;
Step 2: for each instancex in training dataset, calculates its distance to the centroids of all
kclusters, d(ci, x), i= 1,2, ..., k. If the value ofd(cm, x) is smallest, then assignsxintocm;
Step 3: when all instances in the training dataset are assigned, recalculates the centroids of
all kclusters;
Step 4: repeats step 2 and step 3 until the centroids of allk clusters no longer change;
Step 5: for each instanceyin the testing dataset, first calculates its distance to the centroids
of allk clusters,d(ci, y), i= 1,2, ..., k, and then finds the clustercn with the closest distance;
Step 6: according to the following threshold rule, identifies y as a normal traffic or an
anomalous traffic. {
y= 1 if P(ω1n|y∈cn)> th y= 0 if P(ω1n|y∈cn)≤th
(7)
where, “1” and “0” represent the types of anomalous and normal traffic respectively. ω1n is the
anomalous traffic in clustercn,P(ω1n|y∈cn)is the probability of the anomalous traffic instances
incn. this a threshold and its value is0.5, which means if and only if the majority of the cluster
cn are anomalous traffic, theny is identified as an anomaly.
3
Implementation of WRC detection model
In this section, we first preprocess DARPA 1999 traffic traces to obtain the statistical traffic time series as the input of WRC detection model, and then describe the implementation process of WRC in detail.
3.1 Data preprocessing
A. DARPA 1999 dataset
DARPA 1999 intrusion detection dataset [14] has been widely used for evaluating the perfor-mance of intrusion detection systems. This dataset includes five weeks tcpdump packet traces collected from two sniffers: “inside sniffer” between the gateway and the simulated air force network, and “outside sniffer” between the gateway and the simulated Internet. Among the five weeks, traffic of the first and third weeks are anomaly-free, while traffic of the rest include anomalous traffic. For each week, packet traces are captured from Monday to Friday, and for each day, they are collected from 8:00am to 6:00am in the next day. In addition, we find the traffic volume of each day is very small after 6:00pm, thus we analyze the traffic traces only during workday from 8:00am to 6:00pm (10 hours).
DARPA 1999 dataset includes five types of attacks, i.e., Denial of Service Attacks (DoS), User to Root Attacks (U2R), Remote to Local Attacks (R2L), Probes and Data. U2R and Data only exploit computer system vulnerabilities and do not have bad impact on the performance of network. Their traffic behaviors cannot be differed from the normal traffic, i.e., they are stealthy for network. Thus, in our experiments, we do not consider these two types of attacks.
B. Network traffic series acquistion
We preprocess DARPA 1999 packet traces and obtain the flow-based statistical observations to form different traffic time series to be analyzed in the WRC detection model. First, the tcpdump packet traces are converted into flow based on five tuples (source IP, destination IP, source Port, destination Port, transportation protocol), and then five flow-based statistics listed in Table 1 are selected to form the traffic time series (the time interval is one minute).
Table 1: Flow-based statistics of network traffic
Statistic Description
S1 flownum The number of flow per minute
S2 avepktnum The average number of packet per flow
S3 avebyte The average byte per flow (average flow size)
S4 avepktsize The average byte per packet (average packet size)
S5 ratio The ratio of flownum to avepktsize
In Table 1, the first four statistics are directly calculated from the flow traffic and give us a detailed picture about the volume of the traffic. The fifth statistics is the ratio of the number of flow to the average packet size, which measures the interaction communication behaviors of traffic. Fig. 3 gives an example of the normal and anomalous traffic time series based on
the S2 statistic. In this paper, the anomalous traffic time series means the traffic series that
contains anomalies. From Fig. 3, we can see that the statistic of avepktnum cannot distinguish anomalous traffic from normal traffic. Thus, our WRC detection model calculates the dynamic characteristics of network traffic, which are more sensitive to the small-scale variations and transitions of traffic than statistical features.
Day1 Day2 Day3 Day4 Day5
0 100 200 300 400 500 600 700
(a) time (Normal traffic)
avepktnum
Day1 Day2 Day3 Day4 Day5
0 100 200 300 400 500 600 700 800
(b) time (Anomalous traffic)
avepktnum
Figure 3: The normal and anomalous traffic time series (S2: avepktnum)
3.2 Feature vectors extraction for clustering identification
Once the traffic time series have been obtained, WRC detection model analyzes these traffic series to extract the multi-scale dynamic characteristics to compose the feature vectors of traffic, which will be used to identify network anomalies.
A. Multi-scale analysis for traffic series
Given a network traffic time series x = {xi}, i = 1,2, ..., n, we use the daubechies wavelet
to decompose and reconstruct the traffic signals at different frequencies, i.e., low-frequency and high-frequency, which are expressed as below.
h={hi} i= 1,2, ..., n (9)
B. Recurrence dynamic characteristics extraction
After obtaining the traffic series at different frequencies, we employ the recurrence quantifi-cation analysis (RQA) method to calculate the dynamic characteristics.
1)Parameter selection for RQA
Time delay τ, embedding dimension m and threshold distance εare three fundamental
pa-rameters for RQA to extract the recurrence characteristics accurately. In this paper, we use
the mutual information method to select the proper time delay τ and adopt the false nearest
neighbors method to determine the correct embedding dimensionm[15]. Fig. 4 and Fig. 5 show
the results of the mutual information and the percentage of false nearest neighbors for traffic series at different frequencies based on the five statistics, respectively.
0 5 10 15 20 0 0.5 1 1.5 2
(a) Time delay (Original)
Mutual information S1 S 2 S3 S 4 S5 0 5 10 15 20 0 0.5 1 1.5 2 2.5
(b) Time delay (Low−frequency)
Mutual information S 1 S2 S 3 S4 S 5 0 5 10 15 20 0 0.5 1 1.5 2
(c) Time delay (High−frequency)
Mutual information S 1 S2 S3 S4 S5
Figure 4: Time delay of network traffic series
0 2 4 6 8 10 0 0.2 0.4 0.6 0.8 1
(a) Embedding dimension (Original)
Percentage of false nearest neighbor
S1 S 2 S3 S 4 S5 0 2 4 6 8 10 0 0.2 0.4 0.6 0.8 1
(b) Embedding dimension (Low−frequency)
Percentage of false nearest neighbor
S1 S2 S3 S4 S5 0 2 4 6 8 10 0 0.2 0.4 0.6 0.8 1
(c) Embedding dimension (High−frequency)
Percentage of falset nearest neighbor
S1 S2 S3 S4 S5
Figure 5: Embedding dimension of network traffic series
From Fig. 4, we can find that for the original traffic and high-frequency traffic, the mutual information get the first minimum value at time unit 3, while for the low-frequency traffic, the first minimum value is obtained around time unit 10. From Fig. 5, we can see that the
percentage of false nearest neighbors is down to zero after m= 5. The previous study indicated
that the embedding parameters (includingτ andm) has less influence on recurrence analysis [16].
Therefore, we choseτ = 3, m= 5for recurrence quantification analysis without loss of generality.
In addition, based on the rule of thumb, we set the threshold distance to 10% of the maximum diameter of phase space [17].
2) Dynamic characteristics calculated using RQA
Based on the traffic time series at different frequencies and the determined parameters, we employ RQA to calculate the multi-scale dynamic characteristics of network traffic so as to reveal the inherent traffic behaviors and discover the non-stationary transition patterns caused by malicious attacks.
In order to identify traffic anomalies in time, WRC detection model employs RQA method within a sliding window to analyze traffic series. First, the whole traffic time series is divided into several subseries by a sliding window, and then the recurrence characteristics (RR, DET and ENT) introduced in section 2.1.2 are calculated for these subseries. If the size and the shift
of the sliding window are W and Ws, then the start time and the end time of subseries r are
tstart= (r−1)Ws+ 1andtend = (r−1)Ws+W. In our experiment, we setW to thirty minutes
and Ws to six minutes.
For each subseries r, after calculating its recurrence characteristics (RR, DET and ENT),
we can use a feature vector [fRR, fDET, fEN T] to describe the traffic behaviors in it, which
will be used to identify traffic anomalies by k-means algorithm. Fig. 6 shows the recurrence
characteristics of the normal and anomalous traffic time series based on the S1 statistic.
0 20 40 60 80 100 0 0.2 0.4 0.6 0.8 1
(a) time (Normal traffic)
RR 0 20 40 60 80 100 0 0.2 0.4 0.6 0.8 1
(b) time (Normal traffic)
DET 0 20 40 60 80 100 0 0.5 1 1.5 2 2.5 3
(c) time (Normal traffic)
ENT 0 20 40 60 80 100 0 0.2 0.4 0.6 0.8 1
(d) time (Anomalous traffic)
RR 0 20 40 60 80 100 0 0.2 0.4 0.6 0.8 1
(e) time (Anomalous traffic)
DET 0 20 40 60 80 100 0 0.5 1 1.5 2 2.5 3
(f) time (Anomalous traffic)
ENT
Figure 6: The dynamics characteristics of the normal and anomalous traffic series
As shown in Fig. 6, the dynamic characteristics of the anomalous traffic series are distin-guished from that of the normal traffic series. In Fig. 6-(a) and Fig. 6-(d), the value of RR significantly increases when malicious events happened in the traffic series. Thus, RR is an ef-fective feature for detecting anomalies. From Fig. 6-(c) and Fig. 6-(f), we find ENT is another good discriminator to identify anomalous attacks. The entropy measures the uncertainty of sys-tems. The larger the ENT is, the more uncertain the system is. In normal traffic series the daily fluctuations are stable, so the value of ENT is small. On the contrary, in anomalous traffic series, the fluctuations are unstable and the value of ENT is increasing due to the malicious events. Therefore, from Fig. 6, we can conclude that the feature vectors that consist of these three recurrence characteristics can accurately describe the traffic behavior patterns and differ the anomalous behaviors from the normal.
3.3 Implementation process of WRC
Based on the dynamic feature vectors, this section illustrates the detailed implementation process of the WRC detection model as follows:
Input: network traffic time series (five statistics)x={xi}, i= 1,2, ..., n
Step 1: for a traffic time series x, employs the wavelet transform to reconstruct the
low-frequency traffic seriesl and the high-frequency traffic seriesh;
Step 2: based on the sliding window, uses RQA method to calculate the recurrence
charac-teristics of different traffic seriesl andh, respectively;
l={F lr}={[fr,RR, fr,DET, fr,EN T]} r= 1,2, ..., Nw (10) h={F hr}={[fr,RR, fr,DET, fr,EN T]} r = 1,2, ..., Nw (11)
wherer is the rth subseries,N
w is the number of subseries, Nw = nWs−W + 1. The traffic series x
can be expressed as follows:
x={Fr}={[F lr,F hr]} (12)
Step 3: for each traffic series (five statistics), repeats step 1 and step 2 and then combines the
dynamic characteristics of the five traffic series together to describe the traffic behavior patterns. The expression is as follows:
X ={Xr}={[Fr1, Fr2, Fr3, Fr4, Fr5]} (13)
Step 4: uses k-means algorithm to classify each Xr into different clusters and identify the
anomalous traffic based on the threshold rule.
4
Evaluation of WRC detection model
In this section ,we evaluate the performance of WRC detection model on DARPA 1999 dataset and compare it with existing detection methods.
4.1 Evaluation metrics
We use the following three criterions to evaluate the performance of the WRC detection mode.
• Detection accuracy rate (DAR): the ratio of the anomalous traffic that are truly detected by WRC model in traffic series to all anomalous traffic.
• False negative rate (FNR): the ratio of the anomalous traffic that are missed by WRC model in traffic series to all anomalous traffic.
• False positive rate (FPR): the ratio of the normal traffic that are incorrectly identified as anomalies by WRC model in traffic series to all normal traffic.
4.2 Evaluation results
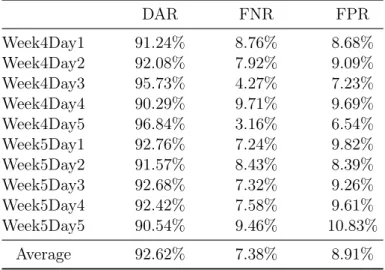
DARPA 1999 dataset includes five weeks traffic. We choose the first three weeks traffic as the training dataset and the rest as the testing dataset. During the training phase, based on the dynamic characteristics, traffic are classified into different clusters by our WRC detection model. The number of clusters is 10. In the testing phase, the traffic of week4 and week5 are identified as the normal or anomalous traffic based on the threshold rule. Table 2 lists the detection results of WRC model for week4 and week5. The results show that week4day5 has the highest detection accuracy, and the average detection accuracy and false alarm rate are 92.62% and 8.91%.
From the evaluation results on DARPA 1999 dataset, we can conclude that based on the multi-scale dynamic characteristics of network traffic, WRC detection model can accurately describe the traffic behavior patterns and effectively detect the anomalous traffic in time.
Table 2: Detection results for week4 and week5 DAR FNR FPR Week4Day1 91.24% 8.76% 8.68% Week4Day2 92.08% 7.92% 9.09% Week4Day3 95.73% 4.27% 7.23% Week4Day4 90.29% 9.71% 9.69% Week4Day5 96.84% 3.16% 6.54% Week5Day1 92.76% 7.24% 9.82% Week5Day2 91.57% 8.43% 8.39% Week5Day3 92.68% 7.32% 9.26% Week5Day4 92.42% 7.58% 9.61% Week5Day5 90.54% 9.46% 10.83% Average 92.62% 7.38% 8.91% 4.3 Comparison results
WRC detection model adopts the wavelet transform method for extracting multi-scale char-acteristics and the k-means algorithm for identifying traffic anomalies. In the previous studies, these two methods have already been employed to detect anomalies. In order to validate that our model indeed improves the detection performance, this section compares the WRC detection model with the existing detection methods.
While, in previous studies, the wavelet transform was usually combined with other methods to detect network anomalies. In the purpose of indicating the impact of wavelet transform on the detection performance through a fair comparison, we propose the Recurrence-Clustering (RC*) detection model that is similar to WRC model except employing the wavelet transform method. Thus, this section performs comparisons with k-means and RC* detection model. Table 3 shows the results.
Table 3: Comparison results
DAR FNR FPR
k-means 76.19% 23.81% 25.74%
RC* 83.54% 16.46% 12.91%
WRC 92.62% 7.38% 8.91%
From Table 3, we can see that among these three methods, k-means has the worst detection performance. That is because k-means uses the statistical observations of network traffic to detect anomalies, which have certain randomness and may be unreliable to characterize the traffic behavior patterns, leading to the high false positive rate.
Like WRC, the RC* detection model also employs the dynamic characteristics to describe the traffic inherent behavior patterns, which are sensitive to the non-stationary transition caused by anomalies. Thus, compared with k-means, its detection performance is indeed improved, especially the false positive rate is significantly reduced. However, its detection performance is still poorer than that of WRC model. That is because WRC model calculates the dynamic characteristics of network traffic at different time scales based on the wavelet transform, which can highlight the local and short-timescale variations of traffic behavior caused by anomalies, resulting in the good detection performance for WRC detection model.
From Table 3, we can conclude that compared with the traditional statistical detection meth-ods, WRC model can accurately detect traffic anomalies in time and obviously improve the detection performance, i.e., it has the high detection accuracy with a low false alarm rate.
5
Conclusions
The statistical observations of network traffic have certain randomness, which may vary along with network scales or application environments. Thus, it is difficult to accurately describe the traffic behaviors by adopting traditional statistical detection methods. This paper proposes a novel network anomaly detection model based on the multi-scale dynamic characteristics of traffic, i.e., the Wavelet-Recurrence-Clustering (WRC) detection model. The WRC detection model identifies traffic anomalies based on the inherent dynamic features of the traffic at different
frequencies. Evaluation results on DARPA 1999 dataset show that WRC model has better
detection performance, compared with existing methods. More specifically, based on the multi-scale recurrence dynamic characteristics, our WRC detection model can accurately describe the traffic behaviors and timely discover the non-stationary transition caused by malicious events, which leads to the good detection performance.
Bibliography
[1] Kim, H. J.; Na, J. C.; Jang, J. S.; Network traffic anomaly detection based on ratio and
volume analysis, International Journal of Computer Science and Network Security, 6(5):
190-194, 2006.
[2] Wu, Q.; Shao Z.; Network anomaly detection using time series analysis, Proc. of the Joint
Int. Conference on Autonomic and Autonomous Systems and International Conference on Network and Services, Papeete, Tahiti, 42-47, 2005.
[3] Willinger, W.; Paxson, V.; Taqqu, M. S.; Self-similarity and heavy tail: structural modeling
of network traffic, A Pratical Guide to Heavy Tails: Statistical Techniques and Applications,
BirkhRăuser, Boston, USA, 1998.
[4] Grossglauser, M.; Bolot, J. C.; On the relevance of long-range dependence in network traffic,
IEEE/ACM Transactions on Networking, 7(5): 629-640, 1999.
[5] Tsai, C. F.; Hsu, Y. F.; Lin, C.; Lin, W.; Intrusion detection by machine learning: a review,
Experts Systems with Applications, 36(10): 11994-12000, 2009.
[6] Shon, T.; Moon, J.; A hybrid machine learning approach to network anomaly detection,
Information Science, 177: 3799-3821, 2007.
[7] Gaddam, S. R.; Phoha, V. V.; Balagani, K. S. ; K-Means+ID3: a novel method for supervised anomaly detection by cascading K-Means clustering and ID3 decision tree learning methods,
IEEE Transactions on Knowledge and Data Engineering, 19(3): 345-354, 2007.
[8] Sabhnani, M.; Serpen, G.; Why machine learning algorithms fail in misuse detection on KDD
intrusion detection dataset, Intelligent Data Analysis, 8(4): 403-415, 2004.
[9] Barford, P.; Kline, J.; Plonka, D.; Ron, A.; A signal analysis of network traffic anomalies,
Pro-ceedings of the 2nd ACM SIGCOMM Workshop on Internet Measurement, Marseille, France, 71-82, 2002.
[10] Polikar, R.; Wavelet tutorial, http://users.rowan.edu/ polikar/WAVELETS/ WTtuto-rial.html, 2001.
[11] Eckmann, J. P.; Kamphorst, S. O.; Ruelle, D.; Recurrence plots of dynamical systems,
Europhysics Letters, 4(9): 973-977, 1987.
[12] Zbilut, J. P.; Webber, C. L.; Embedding and delays as derived from quantification of
recur-rence plots, Physics Letter A, 171: 199-203, 1992.
[13] Duda, R. O.; Hart, P. E.; Stork, D. G.; Pattern classification, 2rd edn., Wiley-intersicence, New York, USA, 2000.
[14] DARPA 1999; http://www.ll.mit.edu/mission/communications/cyber/CSTcorpora/ideval/ data/1999data.html, 1999.
[15] Ohira, T.; Schreiber T.; Nonlinear time series analysis, 2rd edn., Cambridge University Press, New York, USA, 2004.
[16] Chen, W. (2006); Study on the identification of two-phase flow patterns, Master Thesis.
[17] Marwan, N.; Romano, M. C.; Thiel, M.; Kurths, J.; Recurrence plots for the analysis of