Development of a novel high throughput method for
identifying phage-host pairs in an extreme
environment
Israel Temiloluwa Olonade
A thesis submitted in partial fulfilment of the requirements for the
degree of
Doctor of Philosophy (PhD)
Department of Biotechnology,
University of the Western Cape,
Bellville, Cape Town, South Africa.
Supervisor: Professor Marla Trindade (Tuffin)
August, 2016
i
Declaration
I, Israel Temiloluwa Olonade, hereby declare that “Development of a novel high throughput method for identifying phage-host pairs in an extreme environment” is my own work, that
it has not been submitted for any degree or examination in any other university, and that all the sources I have used or quoted have been indicated and acknowledged by complete references.
Date:……… Signed:……….
ii
Abstract
There are approximately 1031 bacteriophages in the biosphere, outnumbering bacteria 10:1, hence, the dynamic and specific nature of phage-host interactions exerts significant influence on microbial communities. Bacteriophages also represent the reservoir of the highest known genetic diversity making them a potential source of novel biotechnological products. However, the isolation of novel bacteriophages is limited by the observation that less than 1% of bacterial hosts have been cultured.
This study aimed to bypass this problem by developing novel culture independent approaches to improve our ability to isolate novel phage-host pairs. Samples were collected from an abandoned copper prospecting site near the Gobabeb Desert Research and Training Station and a Salt lake located in the Swakopmund region of the Namibian desert. Two approaches were explored in this study namely viral tagging and reverse metaviromics.
For viral tagging, fluorescently labelling the environmental phage fraction before challenging the environmental bacterial fraction with tagged phages proved difficult. This was most likely due to the complex interaction of the labelling agent with phages and requires further studies.
For the reverse metaviromics approach, total DNA from the environmental phage fractions was extracted, sequenced and analyzed for novel phages. Analysis of the phage diversity showed that the copper site was dominated by tailed viruses as has been shown for other extreme arid environments. However, the saline site was atypical of marine environments, with tailed viruses being the most abundant, suggesting that the diversity present is not only driven by salinity.
Using the metaviromic sequence data to guide the selection of potential bacterial hosts, two strategies were employed. In the first, putative hosts were predicted based on similarity of
iii
phage sequences to those identified in databases. Media targeting these specific genera were employed, 8 bacterial species were isolated and based on 16S rRNA similarity to the closest known species were identified as Halomonas caseinilytica, Halomonas eurihalina, Halomonas sinaiensis,Idiomarina loihiensis, Marinobacter xestospongiae, Virgibacillus salarius and two
Salinivibrio species. The 16S rRNA analysis also suggested that H. sinaiensis, V. salarius and both Salinivibrio species are novel. All 8 isolates were challenged with the environmental phage fraction. A novel phage, SMHB1, was isolated on one of the Salinivibrio spp. and is only the second characterized phage ever described for this genus. SMHB1 is a 32 kb myovirus, with a head diameter of 56 nm, and a tail length of 106 nm.
The second approach involved the design of fluorescently labelled probes targeting phages identified from the metaviromic sequence data. In a control E. coli system to detect cloned phage DNA fragments, 87% of the interrogated cells showed significant hybridization of the phage specific probe to the target. The optimized method was applied to a simulated environmental bacterial fraction and a detection limit of 1:100 was observed for the bacteria containing the phage DNA fragment of interest.
This study demonstrates the possibility of improving the specificity of isolating phage-host pairs in a culture-independent manner by incorporating sequence data in the experimental design; and contributes to our knowledge of the phage diversity of an understudied extreme environment.
Keywords: extreme environments, metaviromics, viral diversity, phage-host interactions, viral tagging, fluorescence in situ hybridization.
iv
Acknowledgments
My profound gratitude to:
God. I would not have made it without You. No brainer. I owe You everything. I am so grateful.
My Supervisor, Professor Marla Trindade. Thank you for the opportunity, guidance, and for providing an excellent research environment.
Lonnie van Zyl, my “Co-supervisor”, for the advice, lectures, corrections, suggestions, reagent chasing and arguments. Thank you for everything.
My Dad. A great example of love and sacrifice. I hope I can repay you.
My Mum. For the umpteenth time, yes, I have eaten, but no, I am not telling you what I ate. Love you mum.
Emmanuel and Christianah. Wonderful siblings and the reason I can’t rest on my oars.
Seun Akinyemi #ThatIsAll.
IMBMers. You have been wonderful in every way.
v
Dedication
To Mrs Akinyemi. You left way too early but gave me the greatest gift of all.
vi
Table of Contents
Declaration ... i Abstract ... ii Acknowledgments... iv Dedication ... v Table of Contents ... viTable of Figures ... xiii
List of Tables ... xviii
Abbreviations ... xx
1 LITERATURE REVIEW ... 1
1.1 DEFINITION ... 2
1.2 HISTORY OF PHAGES ... 2
1.3 PHAGE CLASSIFICATION ... 4
1.4 GLOBAL PHAGE DIVERSITY ... 7
1.5 PHAGE GENOMICS ... 10 1.6 PHAGE-HOST INTERACTIONS ... 15 1.6.1 Lytic cycle ... 19 1.6.2 Lysogenic cycle ... 24 1.6.3 Pseudolysogeny... 27 1.6.4 Phage resistance ... 29
1.7 POTENTIAL BENEFITS TO STUDYING PHAGE-HOST INTERACTIONS ... 31
vii
1.7.1 Better understanding of bacterial turnover in the environment and
biogeochemical cycles ... 31
1.7.2 Finding novel enzymes through phage metavirome sequencing ... 32
1.7.3 Development of phage as a genetic tool ... 33
1.7.3.1 Phage display... 33
1.7.3.2 Phage typing ... 34
1.7.3.3 Targeted gene delivery ... 34
1.7.3.4 Phagemids ... 35
1.7.3.5 Cosmids ... 35
1.7.3.6 Promoters ... 36
1.7.4 Phage therapy ... 36
1.8 LIMITATIONS OF CURRENT SAMPLING METHODS... 39
1.8.1 The conserved gene approach ... 40
1.8.2 The metagenomic approach ... 41
1.9 DEVELOPING NEW PHAGE- HOST PAIRS ISOLATION TECHNIQUES ... 43
1.9.1 Reverse metaviromics ... 43
1.9.2 Fluorescent labelling ... 43
1.10 AIMS AND OBJECTIVES ... 44
2 USING METAVIROMIC SEQUENCE DATA TO GUIDE THE ISOLATION OF A NOVEL PHAGE ... 45
2.1 INTRODUCTION ... 46
2.2 MATERIALS AND METHODS ... 52
viii
2.2.1 Sample collection and preparation for microbial isolation ... 52
2.2.1.1 Phage purification ... 52
2.2.1.2 Bacterial isolation ... 53
2.2.2 Metavirome sequencing and bioinformatics ... 53
2.2.3 Isolation and identification of saline bacterial isolates ... 55
2.2.3.1 16S rRNA identification of saline site (SS) bacterial isolates ... 58
2.2.3.2 Gel electrophoresis ... 58
2.2.4 Phage-host screening ... 59
2.2.4.1 Thalassomonas ... 59
2.2.4.2 Saline spring ... 60
2.3 RESULTS AND DISCUSSION ... 60
2.3.1 Metavirome assembly ... 60
2.3.2 COPPER SITE ... 61
2.3.2.1 Viral diversity and taxonomic composition ... 61
2.3.2.2 Identification of novel phages ... 64
2.3.2.3 Analysis of the BA3-like phage genome... 66
2.3.2.4 Isolation of the BA3-like phage (Contig13) ... 73
2.3.2.5 Could a Thalassomonas species be the host? ... 73
2.3.3 SWAKOP SALINE SITE ... 78
2.3.3.1 Viral diversity and taxonomic composition ... 78
2.3.3.2 Identification of novel phages ... 81
ix
2.3.3.3 Bacterial isolation ... 83
2.3.3.4 Isolation of a novel phage ... 85
2.4 CONCLUSION ... 86
3 CHARACTERIZATION OF PHAGE SMHB1 ... 87
3.1 INTRODUCTION ... 88
3.2 MATERIALS AND METHODS ... 89
3.2.1 Isolation of pure phage stock ... 89
3.2.2 Transmission electron microscopy (TEM) ... 89
3.2.3 Host range testing ... 90
3.2.4 Extraction of genomic DNA for phage SMHB1 and Salinivibrio isolates ... 90
3.2.5 Preparation of clone library of phage SMHB1 genomic DNA ... 91
3.2.5.1 SMHB1 genomic DNA restriction digest ... 91
3.2.5.2 Blunt-end cloning ... 92
3.2.5.3 Preparation of electrocompetent cells ... 92
3.2.5.4 Transformation ... 93
3.2.5.5 Plasmid DNA extraction using the Alkaline lysis method ... 93
3.2.5.6 Clone de-replication and sequencing ... 94
3.2.6 Whole genome sequencing and analysis... 94
3.3 RESULTS AND DISCUSSION ... 96
3.3.1 TEM morphological characterization ... 96
3.3.2 Determination of phage host range ... 96
x
3.3.3 Phage genomic DNA restriction digest analysis ... 97
3.3.4 Phage genomic DNA library construction ... 99
3.3.5 Whole genome analysis ... 101
3.3.5.1 Lysis/Lysogeny ... 115
3.3.5.2 DNA replication, packaging and repair ... 118
3.3.5.3 Virion morphogenesis ... 122
3.3.5.4 Bacterial genes ... 123
3.3.5.5 Possible mechanism of phage SMHB1 resistance in SS2 ... 123
3.4 CONCLUSION ... 126
4 FLUORESCENT LABELLING... 127
4.1 INTRODUCTION ... 128
4.1.1 Fluorescence activated cell sorting (FACS) ... 128
4.1.2 Viral tagging ... 131
4.1.3 Fluorescent in situ hybridization ... 132
4.2 MATERIALS AND METHODS ... 135
4.2.1 Propagation of Geobacillus thermoglucosidasius 11955 and its phage, GVE3 ………..135
4.2.2 Preparation of environmental samples ... 135
4.2.3 Biotin labelling of phage fraction ... 135
4.2.4 SYBR gold labelling of phage fraction ... 136
4.2.5 Preparation of bacterial fraction for viral tagging... 137
4.2.6 Phage- bacterial interaction... 138
xi
4.2.7 PCR amplification of FISH probes and target ... 139
4.2.8 CY3-dCTP incorporation via PCR ... 141
4.2.9 3’ end Cy3-dCTP incorporation... 142
4.2.10 Digoxigenin labelling... 143
4.2.11 Melting temperature analysis of DIG labelled probe in hybridization-like buffer ………..143
4.2.12 Preparation of chemically competent cells ... 144
4.2.13 Ligation ... 144
4.2.14 Transformation ... 145
4.2.15 Optimization of FISH experiment ... 145
4.2.15.1 Sample preparation ... 146
4.2.15.2 Paraformaldehyde fixation ... 147
4.2.15.3 Lysozyme treatment ... 147
4.2.15.4 Inactivation of endogenous peroxidases ... 148
4.2.15.5 Hybridization ... 148
4.2.15.6 Stringency washes ... 150
4.2.15.7 Antibody binding ... 152
4.2.15.8 Catalyzed reporter deposition (CARD) ... 152
4.2.16 Fluorescence activated cell sorting (FACS) ... 153
4.3 RESULTS AND DISCUSSION ... 154
4.3.1 VIRAL TAGGING ... 154 4.3.1.1 Biotin labelling ... 154
xii
4.3.1.2 SYBR gold labelling ... 156
4.3.2 FLUORESCENCE IN SITU HYBRIDIZATION ... 164
4.3.2.1 Probe and target amplification from metaviromic DNA ... 164
4.3.2.2 Control hybridization experiment using NaCl based buffer ... 170
4.3.2.3 PCR incorporation of CY3-dCTP ... 171
4.3.2.4 DIG labelling ... 173
4.3.2.5 Determination of optimum hybridization conditions using SSC based buffer ………..174
4.3.2.6 Control hybridization experiment using SSC based buffer ... 176
4.3.2.7 Establishing hybridization specificity and signal detection limit... 181
4.3.3 IMPLICATIONS OF THE METHODOLOGY FOR ENVIRONMENTAL SAMPLES ... 189
4.4 CONCLUSION ... 190
5 GENERAL DISCUSSION AND CONSIDERATIONS ... 191
APPENDICES ... 203 APPENDIX A ... 203 APPENDIX B ... 206 REFERENCES ... 207
xiii
Table of Figures
Figure 1.1: Classification of phages based on nucleic acid composition ... 7
Figure 1.2: Qualitative mosaic relationship between the whole genomes of phage Sf6 and HK620, with their circular genomes opened at the 50 kbp -end of their small terminase genes. ... 12
Figure 1.3: Phamily circles of three consecutive genes (62–64) of mycobacteriophage Giles.. ... 15
Figure 1.4: Diagram of how some bacteriophages infect bacterial cells.. ... 17
Figure 1.5: (A) An electron micrograph of T4 phage showing the morphology with distinct tail fibres (B) A descriptive model of bacteriophage T4. ... 20
Figure 1.6: Schematic of lytic and lysogenic life cycles of phages. ... 24
Figure 1.7: (A) An electron micrograph of λ phage showing the morphology with distinct tail
fibres (B) A descriptive model of λ bacteriophage. ... 26
Figure 1.8: The lysogenic life cycle of lambda phage with a description of the effect of an induction event. ... 27
Figure 1.9: Schematic representation of Pseudolysogeny ... 28
Figure 1.10: A model of the proposed concept of biogeochemical cycling in a marine food web. ... 31
Figure 2.1: A map of Namibia showing the Namib Desert stretching across the coast inland. ... 48
Figure 2.2: A. Copper rich soil sample for the prospecting site B. Sample from the Swakop saline site consisting of microbial mat and spring water. ... 51
Figure 2.3: Graphical representation of the phage diversity of the copper site ... 62
xiv
Figure 2.4: Graphical representation of one of the phage families (podoviruses) found in the
copper site. ... 63
Figure 2.5: Comparative analysis of phage BA3 and Contig13 identified from the Namibian metavirome. ... 74
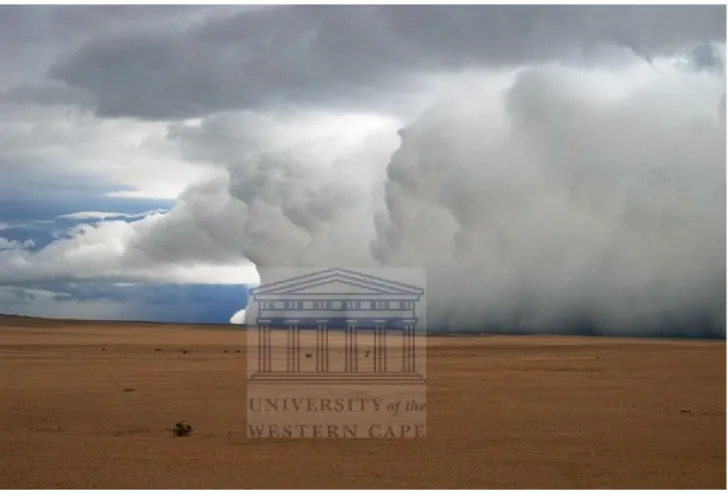
Figure 2.6: Image of a ‘shelf cloud’ formed over the Central Namibian desert.. ... 77
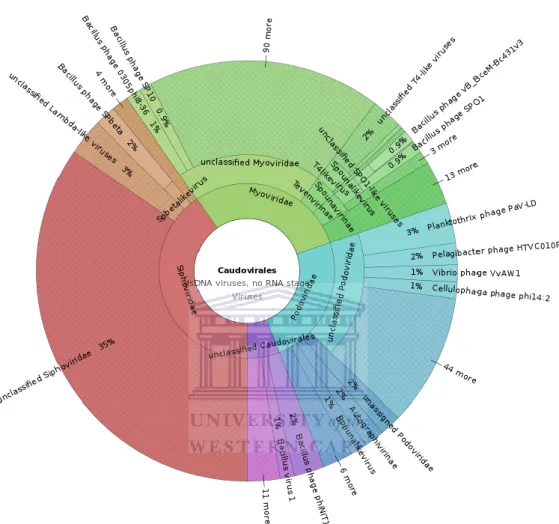
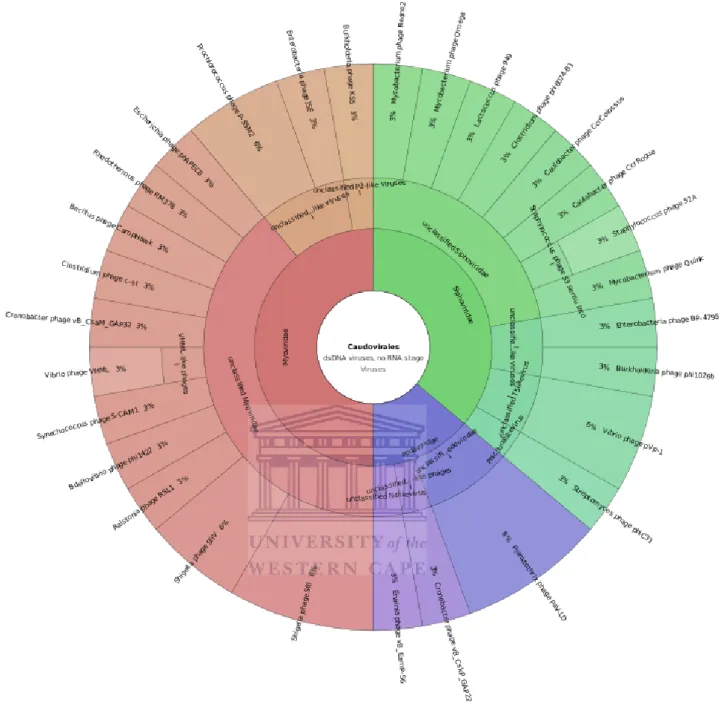
Figure 2.7: Graphical representation of the Caudovirales diversity of the saline site ... 79
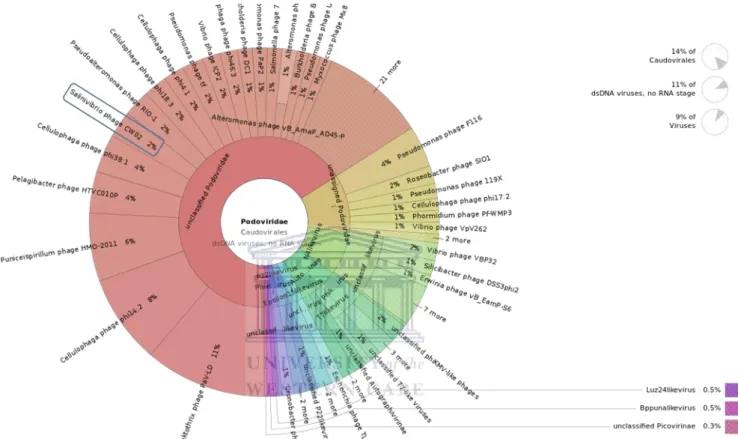
Figure 2.8: Graphical representation of the podoviruses found in the saline site ... 80
Figure 3.1: A & B. Electron micrographs of phage SMHB1 B. Electron micrograph showing phage attachment to cellular debris after cell disruption. ... 96
Figure 3.2: Agarose gel electrophoresis showing restriction patterns generated from digesting phage SMHB1 DNA with six restriction enzymes. ... 98
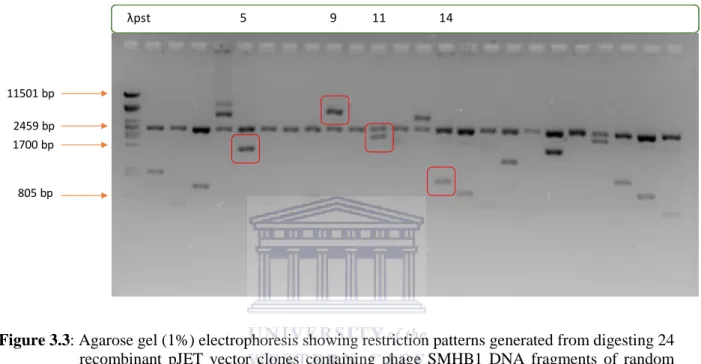
Figure 3.3: Agarose gel electrophoresis showing restriction patterns generated from digesting 24 recombinant pJET vector clones containing phage SMHB1 DNA fragments of random sizes.. ... 99
Figure 3.4: Ideograms representing local alignments of BLAST results of compared genomes. ... 109
Figure 3.5: A GC skew analysis of the genome of phage SMHB1 ... 112
Figure 3.6: Graphical representation of the integration site of phage SMHB1 within the genome of the host, SS3... 113
Figure 3.7: Arrangement of the phage integration site with respect to the fragment of the tRNA dihydrouridine synthase (DusA) gene excised during conversion from the lysogenic to the lytic cycle. ... 114
Figure 3.8: An overview of the genome of phage SMHB1 using the PHASTER tool ... 116
Figure 3.9: Graphical representation of the roles of the repressor cro genes in lysis/lysogeny switch. ... 117
xv
Figure 3.10: Phylogenetic tree comparing phage terminases.. ... 120
Figure 4.1: Graphical representation of the FACSorting process ... 129
Figure 4.2: FACS data representation. (A) Dot plot of fluorescently tagged cells (B) Histogram representing the fluorescence intensity of sorted events.... 130
Figure 4.3: An overview of viral tagging. ... 131
Figure 4.4: A graphical representation of the basic principle of tyramide deposition. ... 134
Figure 4.5: A summary of the FISH protocol used in this study. ... 146
Figure 4.6: Biotin labelling of GVE3 phage particles A & C. G. thermoglucosidasius cells after the addition of biotin-streptavidin-FITC labelled GVE3 phages. ... 155
Figure 4.7: Micrographs showing SYBR gold labelled GVE3 phage particles attached to G. thermoglucosidasius cells. ... 157
Figure 4.8: FACS dot plots showing the fluorescence intensity of labelled control events. A. G. thermoglucosidasius ethidium bromide labelled bacterial cells B. G. thermoglucosidasius unlabelled bacterial cells; C. SYBR gold labelled GVE3 phage suspension. D. Unlabelled GVE3 phage suspension. ... 158
Figure 4.9: FACS dot plots showing the fluorescence intensity of labelled control events A: G. thermoglucosidasius ethidium bromide labelled bacterial cells; B: SYBR gold- labelled GVE3 phage suspension. ... 159
Figure 4.10: Dot plot of ethidium bromide-labelled G. thermoglucosidasius bacterial cells A: Initial sort B: Re-sort of the events collected in A... 160
Figure 4.11: Dot plot of SYBR gold-labelled GVE3 phages A: Initial sort; B: Re-sort of the events collected in A. ... 161
Figure 4.12: Dot plots of E. coli cells used to validate the backwashing process ... 163
Figure 4.13: A graphical representation of contig 179 showing the open reading frames. .. 168
xvi
Figure 4.14: Restriction digest of the DS5 fragment using enzymes to produce FISH probes of random lengths ... 169
Figure 4.15: Micrographs showing 4.8kb/pJET/BL21 E. coli cells, with multiple copies of the target DNA fragment, after hybridization experiments. ... 170
Figure 4.16: Cy3 incorporation into FISH probe using various DNA polymerases. ... 172
Figure 4.17: Visualization of DIG incorporation using a 2% agarose gel. ... 174
Figure 4.18: Melting curve analysis of DS probe-target hybridization in the hybridization buffer using fixed parameters.. ... 175
Figure 4.19: Micrographs showing E. coli cells, with multiple copies of the target DNA fragment, after hybridization experiments under conditions determined using a melting curve analysis.. ... 176
Figure 4.20: Histograms showing the fluorescence intensity of FACSorted E. coli
experiments.. ... 177
Figure 4.21: Histograms showing the fluorescence intensity of FACSorted control E. coli
BL21 experiments.. ... 179
Figure 4.22: Dot plots showing the fluorescence intensity of FACSorted E. coli BL21 experiments.. ... 180
Figure 4.23: Histograms showing the fluorescence intensity of mixed Salinivibrio strains.. ... 183
Figure 4.24: Dot plots showing the fluorescence intensity of mixed Salinivibrio strains.. .. 184
Figure 4.25: Dot plots showing the fluorescence intensity of E. coli clones within a mix of bacterial cells after hybridization using DIG labelled DS probe. ... 186
Figure 4.26: Histograms showing the fluorescence intensity of control E. coli cells within a mix of bacterial after hybridization using DIG labelled DS probe. ... 187
xvii
Figure 4.27: Histograms showing the fluorescence intensity of SS3 within a mix of bacterial cells after hybridization using DIG labelled, phage specific MHB probe. ... 188
xviii
List of Tables
Table 1.1: An overview of phage families. ... 5
Table 1.2: Potential applications of phages. ... 37
Table 2.1: Media composition for isolating bacteria from the Swakopmund saline site. ... 56
Table 2.2: A summary of the largest contigs assembled from the copper site metavirome.... 65
Table 2.3: Table summarizing predicted ORFs of the Contig13 phage based on BLASTx hits on the NCBI database.. ... 67
Table 2.4: A summary of the largest contigs assembled from the Swakop saline site metavirome. ... 81
Table 2.5: A summary of the Swakop saline contigs showing similarity to the only characterized Salinivibrio phage CW02 ... 82
Table 2.6: Summary of the bacteria species isolated from the Swakop saline site. ... 84
Table 3.1: BLAST analysis of selected clones. ... 100
Table 3.2: Summary of the sequence data analysis for the whole genomes of Salinivibrio
strains SS2 and SS3. ... 102
Table 3.3: Summary of the sequence analysis report for the assembly of phage SMHB1 ... 102
Table 3.4: A summary of the BLASTx analysis of the ORFs of phage SMHB1. ... 104
Table 3.5: Summary of the Pearson’s correlation coefficients showing the relationship between
SMHB1 and similar phages ... 110
Table 3.6: Summary of the Pearson’s correlation coefficients showing the relationship between
SMHB1 and Salinivibrio bacterial species ... 111
Table 3.7: CRISPRs and number of spacers identified in the genomes of Salinivibrio species SS2 and SS3 using CRISPRFinder (Grissa et al. 2007). ... 124
Table 3.8: SS2 spacers with perfect matches to the genome of phage SMHB1 ... 125
xix
Table 4.1: A summary of the probes and targets used in this study. ... 140
Table 4.2: Thermo-cycling conditions for DNA polymerases used for CY3-dCTP incorporation ... 141
Table 4.3: Sodium chloride based hybridization buffer (Fuchs et al. 2010). ... 149
Table 4.4: Saline-sodium citrate based hybridization buffer (Moraru et al. 2010). ... 149
Table 4.5: Sodium chloride based standard wash buffer (Pernthaler et al. 2002). ... 151
Table 4.6: Sodium chloride concentration in the washing buffer for washing at 48°C after hybridizing at 46oC (Pernthaler et al. 2002). ... 151
Table 4.7: Components of the CARD amplification buffer (Moraru et al. 2010). ... 152
Table 4.8: A summary of the BLASTx analysis of predicted ORFs of contig 179. ... 165
xx
Abbreviations
°C Celsius µg Microgram
µg/ml Microgram per millilitre µl Microlitre
µm Micrometre µM Micromolar
ATP Adenosine triphosphate BLAST Basic local alignment tool BLASTn Nucleotide BLAST
BLASTp Protein BLAST
BLASTx Protein databases using a translated nucleotide query bp Base pair
BSA Bovine serum albumin
CaCl2. 6H20 Calcium chloride hexahydrate CI Chloroform isoamyl alcohol Contig Contiguous
CTAB Cetyltrimethylammonium bromide DNA Deoxyribonucleic acid
dNTPs Deoxynucleotide triphosphates EDTA Ethylenediaminetetraacetic acid FACS Fluorescence activated cell sorting FeCl3 Iron (III) chloride
xxi
Fe(NH4)2(SO4)2. 6H2O Ammonium iron(II) sulfate hexahydrate FISH Fluorescence in situ hybridization FSC Forward scatter
HCl Hydrochloric acid
IMBM Institute for Microbial Biotechnology and Metagenomics Kb Kilobase pairs
KBr Potassium bromide KCl Potassium chloride
K2HPO4 Potassium phosphate dibasic K2S04 Potassium sulphate
LB Luria-Bertani M Molar
Mbp Megabase pair
MgCl2. 6H20 Magnesium chloride hexahydrate MgSO4. 7H20 Magnesium sulphate heptahydrate Min Minute(s)
ml Millilitre mM Millimolar NaBr Sodium bromide NaCl Sodium chloride NaHCO3 Sodium bicarbonate
NCBI National Centre for Biotechnology Information ng Nanogram nm Nanometres OD Optical density
xxii ORF Open reading frame PBS Phosphate buffered saline
PCI Phenol/Chloroform/Isoamyl alcohol PCR Polymerase chain reaction
RNA Ribonucleic acid rpm Revolutions per minute rRNA Ribosomal ribonucleic acid Sec Seconds
SSC Saline sodium citrate TAE Tris-Acetate-EDTA buffer
tBLASTx translated nucleotide databases search using a translated nucleotide query
TE Tris-EDTA buffer
TEM Transmission electron microscopy U Unit
UV Ultraviolet
Volts/cm Volts per centimetre w/v Weight per volume
1
1
LITERATURE REVIEW
2 1.1 DEFINITION
Bacteriophages (informally, phages, from the Greek word ‘phagein’ meaning “to eat”) are viruses that infect bacteria (Clokie et al., 2011; Ghannad & Mohammadi, 2012). Typically, phages consist of genetic material (DNA or RNA) enclosed within a protein coat (Hankin, 1896; Prescott, 1993). With an estimate of about 1031 viral particles present in the environment, they are known to be widely distributed in nature, thought to outnumber bacteria 10:1 and play an important role in shaping microbial diversity and ecology (Fuhrman, 1999; Clokie et al., 2011; Ghannad & Mohammadi, 2012).
1.2 HISTORY OF PHAGES
There has been a fair amount of debate over the discovery of bacteriophages. The first recorded mention of phage-like activity was in 1896 when British Bacteriologist, Ernest Hankin, observed antibacterial activity against Vibrio cholerae in the water from the Ganges and Jumna rivers in India. He suggested that the spread of the Cholera epidemic was limited by an unidentified substance which was heat labile and passed through fine porcelain filters. A similar occurrence was reported in 1898 by Russian Scientist, Gamaleya, while investigating
Bacillus subtilis (Samsygina & Boni, 1984). However, phages were not further explored until 1915 when Fredrick Twort reported a similar phenomenon and hypothesized that the unknown antibacterial agent might be a virus.
Bacteriophages were ‘officially’ discovered in 1917 by Felix d'Herelle, a French-Canadian microbiologist at the Institut Pasteur in Paris. He had also observed the phage phenomenon in 1910 in Mexico while investigating biological methods for controlling an epizootic event in locusts. During the summer of 1915, d'Herelle was commissioned to investigate the outbreak of severe heamorrhagic dysentery among French troops at Maisons-Laffitte, on the outskirts of
3
Paris. His earlier ‘phage’ observation formed the basis of his hypothesis for producing an effective vaccine against dysentery. He made bacterium-free filtrates of patient’s fecal matter and mixed them with Shigella strains isolated from the patients. Experimental animals were inoculated with a portion of the mixture and the rest was spread on agar plates and observed. Small, clear zones were first observed on those plates and were initially called taches (plaques), then taches vierges (clear plaques) (d’Herelle, 1917).
d'Herelle first isolated phages in 1916 and presented his findings at the meeting of the Academy of Science in September 1917. He also proposed the name ‘bacteriophage’. His findings were accepted and published during meeting proceedings (d’Herelle, 1917). His publication caused a dispute in the scientific community as some argued that Twort discovered phages first (Twort, 1915). d'Herelle continued his research to prove that bacteriophages where viruses and not just enzymes as a few fellow researchers suspected (Bordet & Ciuca, 1921). The argument about discovery eventually subsided, phages were accepted as independent biological entities and the associated antibacterial activity was referred to as the “Twort-d'Herelle phenomenon" and, later, the "bacteriophage phenomenon” (Sulakvelidze et al., 2001).
In the following decades, bacteriophages played significant roles in some of the major advancements in our understanding of biology. T2 and T4 phages were used in the experiments to determine that genetic information was carried by DNA rather than protein (Hershey, 1952). The first successful gene mapping used the T4 phage genome (Benzer, 1955). T4 was also used to demonstrate that DNA undergoes discontinuous replication (Okazaki et al., 1968). Lambda phage was used in experiments during which restriction endonuclease modification systems were first detected (Bertani & Weigle, 1953), and also used for understanding gene regulation (Ptashne et al., 1980), as well as a vector for other molecular biology applications (Sambrook
et al., 1989).
4
Recently, phages are being studied as an important factor in shaping microbial diversity (Thurber, 2009), as potential sources of novel enzymes (Hughes et al., 1998; Fischetti, 2010; Nelson et al., 2012), and as model systems for gene delivery and expression (Larocca et al., 2002). Improvements in sequencing technologies have also led to an unprecedented access to bacteriophage genome sequences which are expected to further increase our understanding of phage genomics and biology.
1.3 PHAGE CLASSIFICATION
The International Committee on Taxonomy of Viruses (ICTV) classifies viruses based on morphology and nucleic acid composition among other criteria.
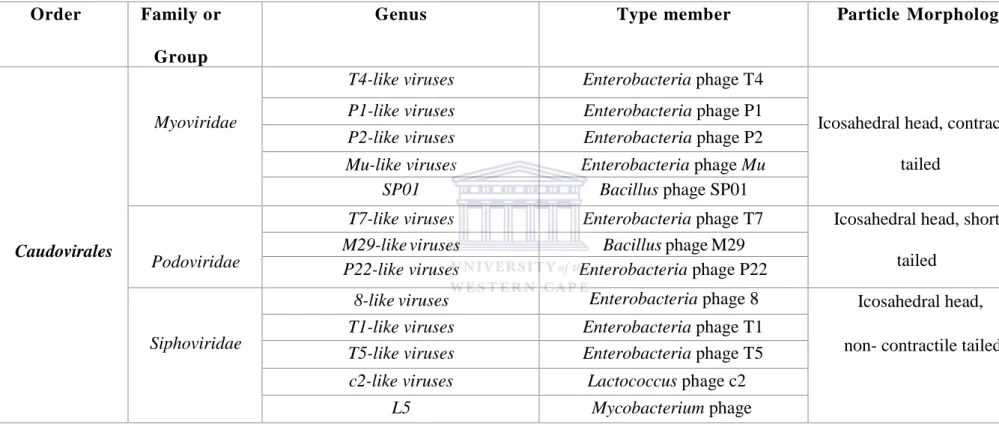
Caudovirales (tailed bacteriophages) account for over 96% of currently known phages and perhaps the majority of phages in nature (Ackermann, 2007). A second Order, Ligamenvirales, consisting of two rod shaped phages was recently described (Prangishvili & Krupovic, 2012). Other known phages are currently unassigned to any Order. No phages have been described for some bacteria phyla such as Aquificae and Chrysiogenes largely because their presence has not been investigated (Ackermann, 2007; Ackermann, 2009). Table 1.1 below summarizes known phage families and their characteristics:
5
Table 1.1: An overview of phage families. Adapted from Ackermann 2007; Prangishvili & Krupovic 2012 and modified.
Order Family or Group
Genus Type member Particle Morphology
Caudovirales
Myoviridae
T4-like viruses Enterobacteria phage T4
Icosahedral head, contractile tailed
P1-like viruses Enterobacteria phage P1
P2-like viruses Enterobacteria phage P2
Mu-like viruses Enterobacteria phage Mu SP01 Bacillus phage SP01
Podoviridae
T7-like viruses Enterobacteria phage T7 Icosahedral head, short tailed
M29-like viruses Bacillus phage M29
P22-like viruses Enterobacteria phage P22
Siphoviridae
8-like viruses Enterobacteria phage 8 Icosahedral head, non- contractile tailed
T1-like viruses Enterobacteria phage T1
T5-like viruses Enterobacteria phage T5
c2-like viruses Lactococcus phage c2
L5 Mycobacterium phage L5
6 Ligamenvirales Lipothrixviridae Alphalipothrixvirus, Betalipothrixvirus, Gammalipothrixvirus Deltalipothrixvirus
Acidianus filamentous virus 1 Rod
Rudiviridae Rudivirus Sulfolobus islandicus rod-shaped
virus 1
Rod
Unassigned
Cystoviridae Cystovirus Ø6 Isometric
Inoviridae Inovirus Enterobacteria phage M13 Rod
Plectrovirus Acholeplasma phage MV-L51
Leviviridae Levivirus Enterobacteria phage MS2 Icosahedral
Allolevirus Enterobacteria phage Q$
Microviridae Microvirus Enterobacteria phage ØX174
Icosahedral
Spirovirus Spiroplasma phage 4
Bdellomicrovirus Bdellomicrovirus phage MAC1
Chlamydiamicrovirus Chlamydia phage 1
Plasmaviridae Plasmavirus Acholeplasma phage L2 pleiomorphic
Tectiviridae Tectivirus Enterobacteria phage PRD1 Icosahedral
Corticoviridae Corticovirus Alteromonas phage PM2 Icosahedral
7
While the composition of nucleic acids contained within bacteriophages has been observed to differ, ranging from ssRNA to ssDNA to dsDNA, the majority contain double stranded DNA within the capsid (Ackermann, 2007). Phages can also be classified based on the presence or absence of an envelope around the genetic material. The envelope is a lipid bilayer surrounding the capsid and is composed of some bacterial host proteins, phospholipids and some viral glycoproteins that aid host infection (Tolonen et al., 2001; Nisole & Saïb, 2004). Plasmaviruses possess such envelopes. Figure 1.1 below shows the classification of phages based on nucleic acid composition.
Figure 1.1: Classification of phages based on nucleic acid composition (http://agridr.in) (Accessed: 15-10-2014).
1.4 GLOBAL PHAGE DIVERSITY
While the discovery of phages and application of phage model systems has contributed greatly to molecular biology, not until recently has the impact of viruses on ecosystems been fully appreciated (Bogovazova et al., 1991; Cairns et al., 2007). Bacteriophages are ubiquitous,
8
numbering from about 107 to 109 per gram of top soil or sediment (Danovaro & Serresi, 2000; Hewson et al., 2001) to 1010 per liter of surface sea water (Bergh et al., 1989). Phages are now recognized to contribute significantly to nutrient sink in the ocean by being major predators of bacteria and archaea (Wilhelm & Suttle, 1999).
Phages have also been recognized as major contributors to genetic exchange in the environment and are estimated to transduce 1025 to 1028 base pairs of DNA per year in the marine environment alone (Paul, 1999).
There are an estimated 1031 bacteriophages in the biosphere, outnumbering bacteria 10 to 1 (Fuhrman, 1999; Wommack & Colwell, 2000; Ashelford et al., 2003), hence, the dynamic and specific nature of phage-host interactions exerts significant influence on microbial communities (Hambly & Suttle, 2005; Clokie et al., 2011). For example, cyanobacteria of the genus Synechococcus are among the most abundant picophytoplankton in the ocean, accounting for up 30 % of total primary production (Waterbury et al., 1986). The concentration of Synechococcus specific phages have been found to range between 102 to 105 per ml in near shore and offshore waters (Waterbury & Valois, 1993; Suttle & Chan, 1994). It was reported that up to 3% of Synechococcus species isolated from various marine environments contain mature phages and these phages may be responsible for up to 14% of cyanobacterial mortality on a daily basis (Suttle & Chan, 1994). This provides an indication of the correlation between phage persistence in the environment and the turnover of the susceptible bacterial population (Wilhelm & Suttle, 1999).
Haloalkaline environments are thought to have the highest abundance and diversity of viruses of all types of environments, with the highest viral count documented to be 2 x 10⁹ per ml in the hypersaline Mono Lake, California (Brum et al., 2005). The impact of such exceptionally high abundance on trophic levels was recently demonstrated in the East African Rift Valley
9
lakes where a short food chain involving cyanophages, the cyanobacterium Arthrospira fusiformis and the Lesser Flamingo exists (Peduzzi et al., 2014). The cyanobacterium is the most important source of food for the flamingo which has recently been classified as ‘near-threatened’ (IUCN Red List, 2016: http://www.iucnredlist.org). However, the population of A. fusiformis collapses drastically and unpredictably and this fluctuation has been reported as the major factor influencing the population and distribution of the Lesser Flamingo (Vareschi & Jacobs, 1985; Krienitz & Kotut, 2010). The study showed that cyanophage infection was directly responsible for the substantial lysis of A. fusiformis, hence the drastic reduction in flamingo population. The study also made an interesting observation that although the virus to bacteria ratio constantly fluctuated, the difference remained in the same order of magnitude. This suggests that viruses were actively involved in keeping bacterial populations at a threshold.
The study of phage diversity is complex and usually incomplete. Many studies evaluate only the presence of free phage particles while neglecting the impact of prophages. It is known that most bacteria contain more than one prophage within their genomes and it has also been reported that approximately 60% of bacteria in the marine environment contain inducible prophages (Cochran & Paul, 1998). However, these investigations generally fail to account for the potential increase in the number of phage particles as a result of an induction event. The relatively low incidence of lysogeny may be attributed to fluctuations in temperature and nutrients (Jiang & Paul, 1994; Wilson et al., 1996; Cochran & Paul, 1998). It is therefore unsurprising that high concentrations of phage particles have been reported in coastal water and oceans, and even higher concentration in lakes depending on season and geographical location (Kirby et al., 1994; Wommack & Colwell, 2000). A study of phages in Chesapeake Bay, an eutrophic estuarine water body, found bacterial density to be 106 cells per ml and phage concentration to be 107 particles per ml with variations dependent on the season (Wommack et
10
al., 1999). There were about 5 to 10 viral particles per bacterial cell per sampling site. The study also hypothesized that the community contained about 10 to 50 different bacterial species and 100-300 different phage strains. This resulted in the suggestion that phages are the most abundant biological entities in the biosphere (Riley, 2006).
1.5 PHAGE GENOMICS
Phage ΦX174, a 5375 bp single stranded DNA phage, was the first whole genome to be sequenced largely due to the relatively small size and ease of isolation (Sanger et al., 1977). This was followed by the whole genome sequencing of the double stranded DNA phage lambda phage at 48502 bp (Sanger et al., 1982). Advancements in DNA sequencing technologies have seen the number of complete phage genomes increase exponentially. Currently, there are 1452 complete phage genomes on the NCBI database. The increased interest in sequencing phages can be attributed to two major reasons. First, the realization that phages are more abundant than initially thought and that the degree of relatedness of known genomes is such that insight can be gained into the evolutionary mechanisms that shape such abundance. Second, the increasing application of phages and derived products in developing industrial, biotechnological, and clinical tools (Hatfull, 2008).
Phage genomes range in size from 2435 bp (Leuconostoc phage L5) to 497513 bp (Bacillus
phage G) (Edwards & Rohwer, 2005; Deschavanne et al., 2010). However, phage genome size distribution is not homogenous, possibly due to biases in current isolation techniques which include size exclusion using filters and propagation only on bacterial hosts that can be cultured (Serwer et al., 2007). Hence, the size distribution observed from sequences may not necessarily reflect the existing distribution in nature. Also, the small number of sequenced phages with large genomes can be partially attributed to the observation that bacteriophages with large
11
heads, hence big genomes, typically form very small plaques on agar plates and can be easily overlooked during isolation (Serwer et al., 2007).
The majority of sequenced phages are double stranded DNA-containing siphoviruses ranging between 30 to 60 kb which account for about 55% of all known phages (Deschavanne et al., 2010). This reflects the observation by electron microscopy that tailed phages most likely dominate the biosphere (Ackermann, 2007) and supports the finding that genes responsible for virion structure and assembly typically account for at least 15 kb of the whole genome, with the tape measure protein gene of siphoviruses alone accounting for between 1.5kb to 6 kb (Hatfull, 2008).
Comparative analysis of phage genomes has revealed interesting themes. For example, most siphoviruses have syntenic regions among genes that code for structural and assembly proteins (Casjens, 2005). The head and tail genes are usually arranged together with the head genes situated 5’ of the tail genes (Figure 1.2). The head genes usually contain a protease, the portal protein, a scaffold protein, one or two terminase subunits, and the major capsid subunit while the tail genes contain the major tail subunit, the tape measure protein and other minor tail proteins (Casjens, 2005). In some phages, such as MU and λ, the tail genes contain two overlapping open reading frames which are expressed through a programmed translational frameshift (Xu et al., 2004). The length of the tape measure protein gene is directly proportional to the tail length of the phage (Katsura & Hendrix, 1984). This syntenic organization is conserved even in phages that have no similarity both at a nucleotide level and across predicted proteins (Casjens et al., 1992). This is therefore thought to be an early evolutionary feature.
12
Figure 1.2: Qualitative mosaic relationship between the whole genomes of phage Sf6 and HK620, with their circular genomes opened at the 50 kbp -end of their small terminase genes. Above, the arrows denote the major transcripts (thin arrows represent early operons; thick arrows represent the late operon), and representative functions of both genomes are provided. Black horizontal bars indicate regions of sequence similarity, and grey areas between the genomes indicate regions of >95% (dark), 90–95% (medium) and 80–90% (light) nucleotide sequence identity (Casjens, 2005).
A few variations of this syntenic theme have been observed. For example, the lysis genes in mycobacteriophages are found in different locations with respect to the structural and assembly genes. In some mycobacteriophages such as TM4, the lysis genes are usually found downstream of the minor tail protein genes (Ford et al., 1998) while in others like phage L5, the lysis genes are found upstream of the terminase gene usually between the terminase and the cos site (Hatfull & Sarkis, 1993).
Also, many mycobacteriophages have an integration cassette which is usually located close to the centre regardless of the size of the genome. However, one instance was observed where the integration cassette was found within the tail genes. This was thought to be due to the presence of a secondary attachment site within the genome (Morris et al., 2008).
This syntenic organization is less defined in larger phage genomes (>125 kb) and is generally limited to structural genes where most of the conserved regions are punctuated by hyper plastic regions (Casjens, 2005; Comeau et al., 2007). These hyper plastic regions contain relatively
13
small genes whose functions are mostly unknown but are suspected to be involved in phage adsorption to the bacterial host and protection of the genetic content of the phage from modification by the host (Rifat et al., 2008).
The presence of extra genes with no known function is a common feature of phage genomes. These genes are referred to as ‘morons’ and are characteristically inserted between two predicted phage genes. Morons are thought to be residues of horizontal gene transfer (Hendrix
et al., 2000). Newly incorporated morons can be recognized by the significant difference in GC content compared to surrounding genes. A moron that benefits the phage is fully integrated into its genome over time (Hendrix et al., 2000; Hendrix, 2002) .
Phage genomes are highly mosaic (Brüssow & Desiere, 2001). This means that each phage genome can be described as being composed of multiple, unique and exchangeable functional units from a common gene pool. These functional units are referred to as ‘modules’ and examples include head, tail and structural genes (Hendrix, 2002; Brüssow et al., 2004). Modules differ in size, rate of exchange and genomes in which they are found (Hatfull, 2008).
The recombination events that produces the high level of mosaicism observed in phages is driven by lateral gene transfer and involves homologous, and less often heterologous, exchange of genetic material between phages of different sizes, morphology and host range (Hendrix et al., 1999). Two models have been proposed to explain how this recombination occurs.
The first model proposed that gene junctions contain short conserved boundary sequences that serve as targets for the catalysis of homologous recombination by phage-encoded or host-encoded recombinases (Susskind & Botstein, 1978). Although a number of potential boundary sequences have been reported (Clark et al., 2001), their functions have not been satisfactorily
14
described and given that these potential recombination targets are not widespread, it is highly unlikely that the majority of recombination events follow this model.
The second model suggests that recombination events are random, frequently leading to the disruption of essential gene functions and mostly resulting in the production of non-viable phages which are rapidly eliminated (Hendrix, 2002). However, multiple recombination events may sometimes result in productive genetic exchange leading to the incorporation of functional modules of the right size into a genome. This viable combination of genes may result in the assembly of a ‘new’ phage. A study suggested that phage-encoded RecE or RecT- like recombination systems (Martinsohn et al., 2008) or CRISPR sequences (Sorek et al., 2008) may be involved in generating mosaicism through homologous recombination.
An alternative approach to understanding phage mosaicism is to compare predicted phage protein sequences. This approach is useful because many phages do not share any similarity at the nucleotide level, hence protein sequences are better predictors of evolutionary ancestry and mosaicism. Phylogenetic reconstructions using protein sequences have shown that different genes, gene clusters and or gene segments all have different ancestry and therefore represent individual modules within a mosaic genome (Pedulla et al., 2003; Hatfull et al., 2006; Liu et al., 2006).
Phage diversity is high enough to significantly limit the broad application of phylogenetic comparisons. Phamerator (Figure 1.3), a bioinformatic tool, was recently developed to include
15
genomes that do not belong to the same phylogenetic cluster in the analysis of phage mosaicism (Cresawn et al., 2011).
Figure 1.3: Phamily circles of three consecutive genes (62–64) of mycobacteriophage Giles. Each circle corresponds to three different Phams representing group of related proteins; and the thickness of the lines connecting each phamily constituent is related to the strengths of the relationships. Each of the three Giles genes clearly has a different evolutionary history (Hatfull, 2008).
Generally, mosaicism in phage genomes is so extensive that any attempt to define phylogenetic relationships of whole genomes would be limited to a few very closely related phages. This phenomenon forms the basis of identifying closely related phages using genes such as terminase and g20 and attempting to identify potential bacterial hosts.
1.6 PHAGE-HOST INTERACTIONS
Phages do not possess the ability to move independently hence, for infection, they depend on random contact with specific receptors on the bacterial host (Gabashvili et al., 1997; Moldovan
et al., 2007). They bind to receptors such as proteins, teichoic acids, lipopolysaccharides or flagella on the host cell surface (Riede et al., 1985; Rakhuba et al., 2010). The specificity of this action means that most phages have a narrow host range (Carlton, 1999; Ohno et al., 2012).
16
Contact with the specific receptor is mediated via tail fibres or similar structures for non-tailed phages. For example, in a number of susceptible gram-negative bacteria, the phage uses the pilus to guide contact with the cell. When the pilus is retracted by the bacterium, bound virions are translocated to the outer membrane of the bacterium (Romantschuk & Bamford, 1985; van Duin, 1988; Webster, 1996), a process which is thought to enable penetration of the possible slime layer on the bacterial surface (Romantschuk & Bamford, 1985). Examples of such phages include the filamentous ssDNA viruses (e.g., M13, fd and fl) (Webster, 1996), icosahedral ssRNA phages of E. coli (e.g., Qβ and MS2) (van Duin, 1988) and the enveloped phage ϕ6 of
Pseudomonas syringae (Romantschuk & Bamford, 1985). The filamentous phages interact specifically with the tip of the host cell F-pilus using the minor coat protein (pIII) (Jacobson, 1972) while the icosahedral ssRNA phages and phage ϕ6 attach to the side of the pili (Bamford
et al., 1976; van Duin, 1988).
The phage attachment process can be reversible, referred to as desorption, where the phage simply falls off, or irreversible, upon which infection occurs (Schwartz, 1975). Upon irreversible attachment to a susceptible host, the bacteriophage generally pierces the cell membrane and injects its packaged nucleic acid into the cell in a specialized manner (Mayer, 2007; Chatterjee & Rothenberg, 2012). The nucleic acid is the only phage component that enters the cell, while the viral capsid remains attached to the bacterial cell surface (Poranen et al., 2002) and the effectiveness of the injection of genetic material is thought to be enhanced by the presence of ATP in the tail, if present (Fiers et al., 1976; Mayer, 2007).
17
Figure 1.4: Diagram of how some bacteriophages infect bacterial cells.
(https://www.boundless.com/microbiology/textbooks/boundless-microbiology- textbook/viruses-9/culturing-viruses-120/batch-culture-of-bacteriophages-619-5182/ [Accessed: 11-03-2016]).
Tailed dsDNA bacteriophages deliver their genome into the cytoplasm through a circular portal complex. The portal is located at one of the vertices of the capsid, connecting the tail to the capsid (Valpuesta & Carrascosa, 1994). The tail is involved in host recognition and attachment, which facilitates genome delivery into the cell (Poranen et al., 2002). The piercing action of the tail is thought to induce some permeability changes in the plasma membrane leading to the formation of a channel or pore within the host envelope (Dreiseikelmann, 1994). The pore for phage genome delivery across the envelope differs for phages. For example, λ phage induces the formation of a channel using cellular proteins (Roessner & Ihler, 1986), while phage T5 encodes a pore-forming protein (pb2), as a part of its tail, and forms a hydrophilic transmembrane channel within lipid membranes (Feucht et al., 1990). Phage T7, encodes proteins (gp14, gp15, and gp16) which are ejected from the virion through the tail and probably mechanically create a channel across the cell envelope (Molineux, 2001). It has been suggested
18
that phage T4 creates a pore by inducing the fusion of the outer and plasma membranes (Tarahovsky et al., 1991).
The mechanism of genome delivery has also been studied for non-tailed dsDNA phages. For example, phage PRD1 has no tail but possesses an envelope, which is a lipid bi-layer between its genome and capsid. On contact with a receptor, one of the capsid vertices releases a receptor-binding spike, causing the formation of a 14 nm opening within the receptor (Butcher et al., 1995; Rydman et al., 1999). Part of the phage envelope is transformed into a tubular structure that penetrates the capsid through the opening at the vertex. Viral membrane proteins assist this “tail-tube” structure in penetrating the cell envelope, creating a link between the interiors of the cell and the virus through which the genome is delivered into the cytoplasm (Poranen et al., 2002).
The fate of the phage capsid after successful genome delivery has been studied. The capsid may fall off, but for some phages, it has been shown to fuse with the bacterial outer membrane afterwards. For example, phage ϕ6 possesses an envelope and contains extension oligomeric units composed of two proteins, the receptor-binding spike, P3, and the fusogenic transmembrane protein, P6, which anchors the spike (Bamford et al., 1987; Overbaugh et al., 2001). P6 is activated once the spike protein P3 completes its interaction with the bacterial pilus (Romantschuk & Bamford, 1985; Bamford et al., 1987). This initiates the pH-independent fusion of the phage envelope with the bacterial outer membrane (Bamford et al., 1987).
In non-enveloped phages such as fd, a filamentous phage of E. coli, the major capsid protein (pVIII) is associated with the bacterial plasma membrane during both virus entry and assembly (Webster, 1996). The insertion of the coat protein during the entry process logistically resembles the insertion of the viral envelope into the host membrane. Phage fd also uses the
19
bacterial pilus for attachment but requires an obligatory co-receptor, the C-terminal domain of the periplasmic protein TolA, for infection (Riechmann & Holliger, 1997). The interaction with the co-receptor triggers the virion uncoating, and the insertion of the viral major capsid protein into the bacterial plasma membrane (Click & Webster, 1998). The fusion of the phage capsid is a carefully mediated process which helps to preserve the integrity of the cell membrane and avoid leakage of cellular components from the junction of the viral and host components (Poranen et al., 2002). Upon successful genome delivery, a phage can enter one of four life cycles which are briefly described below:
1.6.1 Lytic cycle
The E. coli-infecting T4 phage (Figure 1.5) is a classic example of a phage capable of undergoing the lytic but not lysogenic cycle. It is one of the largest known phages with a length of approximately 200nm and 90nm width and possesses hollow tail fibres adapted for injecting genetic material in a hypodermic syringe- like manner (Rabbani et al., 2004). T4 phage encodes about 200 genes which have been widely studied (Knipe & Howley, 2001).
20
Figure 1.5: (A) An electron micrograph of T4 phage showing the morphology with distinct tail fibres (Miller et al., 2003) (B) A descriptive model of bacteriophage T4 (bugs.bio.usyd.edu.au [Accessed: 25-04-2013]).
The life cycle of T4 phage is summarized as follows: host recognition is achieved through contact between the tail and tryptophan or liposaccharide receptors on E. coli’s surface (Goldstein et al., 1984; Hu et al., 2015). Once contact is made, the tail transmits a signal to the capsid to facilitate both the opening of the channel through which DNA moves and the genome is injected. The baseplate harbours some short tail fibres (STFs) and six long tail fibres (LTFs) and the LTFs can be divided into proximal and distal half-fibres which are angled at about 20 degrees from each other (Cerritelli et al., 1996; Ward et al., 1970). The LTFs are able to exist in two conformations: retracted (up) or extended (down) state (Conley & Wood, 1975). It was initially thought that the fibres were extended when the phage requires rapid adsorption to a host, and retracted when unfavourable conditions such as low temperature, low pH and low ionic strength, occurred, however, research has shown that for infection, each LTF exists in a state of dynamic equilibrium between retraction and extension (Kellenberger et al., 1996; Hu
et al., 2015).
B
21
The collar (Figure 1.5B) and whiskers (not shown) are formed by the assembly of twelve copies of the wac protein just below the head-tail junction of the phage (Dickson et al., 1970; Yanagida & Ahmad-Zadeh, 1970; Coombs & Eiserling, 1977; Fokine et al., 2013). The Wac proteins attach to the hinge connecting the proximal and distal fibres, causing the proximal half-fibre to attach to the baseplate protein gp9. This attachment involves the binding of six gp9 trimers to the upper edge of the baseplate (Terzaghi et al., 1979; Leiman et al., 2010). This coaxial attachment of the LTFs to the C-terminal domain of gp9 allows the LTFs to orientate correctly with respect to the capsid and contractile sheath of the phage (Leiman et al., 2004; Kostyuchenko et al., 2005).
The LTFs, which have become extended, bind to the E. coli B lipopolysaccharide (Prehm et al., 1976) or outer membrane protein C (OmpC for K-12) (Montag et al., 1990) causing the transition of the baseplate from a hexagonal to star conformation, and increasing the diameter from 40 to 60 nm (Simon & Anderson, 1967a; Simon & Anderson, 1967b). This conformational change also unpins the STFs from the baseplate, causing them to rotate downwards and bind to the A-KDO region of the lipopolysaccharide (LPS) (Riede et al., 1985; Leiman et al., 2010). This destabilizes the metastable conformation of the baseplate, causing it to contract, and forcing the tail tube into the cytoplasm of the cell for genome injection in a syringe-like manner (Hershey, 1952; Stent, 1963). Cell wall degradation is critical to the entry of the tail tube into the cytoplasm and this is achieved by the presence of trimers of gp5 as the needle and the protein has been shown to possess lysozyme activity (Mosig et al., 1989). Gp5 is thought to dissociate and diffuse away as the tail tube successfully enters the cytoplasm (Kao & McClain, 1980). In this cycle, the injected genetic material exists as a separate entity within the cytoplasm of the host (Tarahovsky et al., 1991; Rossmann et al., 2004).
22
The genome of phage T4, approximately 170 kb dsDNA, contains several origins of replication (oris) which can facilitate multiple rounds of DNA synthesis, and encodes proteins such as replicative helicase, topoisomerase and primase, which are involved in the replication process (Kreuzer & Brister, 2010). Seven putative origins of replication have been identified (named
oriA through oriG) and at least five, oriA, oriC, oriE, oriF, and oriG, have been shown to be involved in early replication (Brister & Nossal, 2007; Brister, 2008). Using these oris, the phage is able to initiate the first of two stages of replication; autonomous bidirectional replication. Studies of oriF and oriG have shown that they both contain an AT-rich downstream unwinding element (DUE) (Menkens & Kreuzer, 1988; Carles-Kinch & Kreuzer, 1997) and a middle-mode promoter which contains a binding site for the viral transcription factor MotA (Hinton et al., 2010). When transcription is initiated from the oriF MotA-dependent promoter, persistent R-loops are formed in the DUE region and this leaves the non-template strand hypersensitive to ssDNA cleavage (Carles-Kinch & Kreuzer, 1997; Belanger & Kreuzer, 1998). These R-loops are thought to be cleaved by viral RNase H, generating free 3'-OH ends used for priming the synthesis of the leading DNA strand by the host RNA polymerase (Carles-Kinch & Kreuzer, 1997; Belanger & Kreuzer, 1998). The phage encoded gp61 primase primes replication of the discontinuous lagging strand (Liu & Alberts, 1980; Nossal, 1980; Hinton & Nossal, 1987). A few minutes post-infection, the host RNA polymerase recognition site is altered in preparation for the expression of late phage genes, an action which also turns off the MotA-dependent middle mode promoters of oriF, and oriG (Hinton et al., 2010). This forces the phage to switch to stage two, recombinant-dependent replication (RDR), where it transcribes late genes using its own machinery and uses recombinant intermediates for the leading strand DNA synthesis of the instead of RNA primers (Goldstein et al, 1984).
Genome attributes of the T4 phage, namely its terminal redundancy (two terminal regions of each genome having the same sequence) and circular permutation (a consequence of random
23
cleavage of the circularized genome), make RDR possible (Streisinger et al., 1967). Terminal redundancy results in each 3′ ss end generated from bidirectional replication being homologous to the 5’ end of the DNA strand eventually leading to the generation of long DNA concatemers which is required for DNA packaging into new phage heads that will be assembled later (Kreuzer, 2000).
When the expression of late genes reaches a threshold, viral assembly is activated by helper proteins starting with the viral base plate which is attached to the tail and tail fibre proteins (Wommack & Colwell 2000; Snyder & Champness 2007). A mature phage capsid is also assembled and DNA is packaged using a simple mechanism- until the head is full. The DNA concatemer generated from recombinant-dependent replication is resolved by endonuclease VII (Mizuuchi et al., 1982) and packaging is initiated randomly along the phage genome (Kalinski & Black, 1986). Headful packaging ensures that each phage head contains approximately 103% of the genome length, making its terminally redundant by default (Streisinger et al., 1967).
The release of mature phage particles is facilitated by phage encoded enzymes. The inner membrane of the bacterial host is punctured by the enzyme holin, an action which allows endolysins and lysozyme access to the peptidoglycan cell wall causing its degradation. This significantly weakens the membrane thus allowing either the outflow of cellular content or influx of fluid from the external environment into the cell, thus bursting it and liberating viral particles (Cann, 1994). This results in cell lysis and release of newly assembled viral particles into the environment (Goldstein et al, 1984).
24
Figure 1.6: Schematic of lytic and lysogenic life cycles of phages. Lytic phages immediately enter a productive cycle, hijacking the bacterial cell machineries to replicate the phage genome, synthesize capsid and tail proteins, packaged the phage genome into progeny phage particles and release new virions via bacterial lysis. Temperate phages enter a lysogenic cycle, in which the phage genome is integrated into the bacterial genome and persists in a latent state that does neither promotes cell death nor the production of phage particles. Prophages are replicated together with the bacterial host genome during cell division but
switch into lytic cycle upon exposure to DNA damage.
(https://sites.google.com/site/cundiffbiologyportfolio/home/science-as-a-process/viral-life-cycles) [ Accessed: 4-1-2016].
1.6.2 Lysogenic cycle
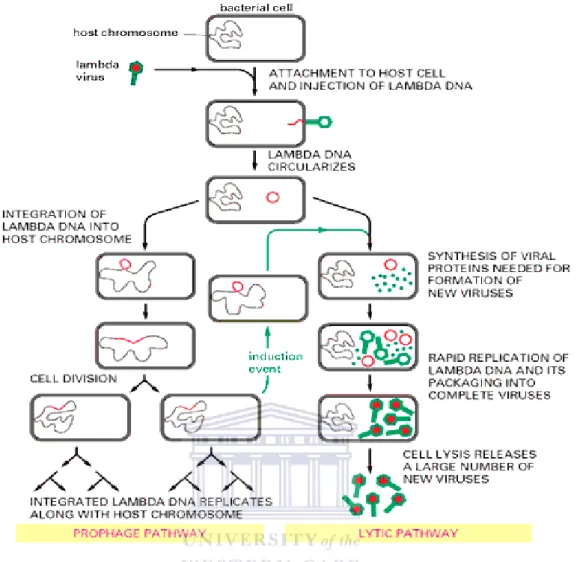
In the lysogenic (temperate) cycle, the phage genome is incorporated into the genome of the host and is referred to as prophage. As the host replicates, it passes along the viral genome to its daughter cells (Canchaya et al., 2004). The viral genome remains dormant until an induction event such as DNA damage, lack or excess of nutrients, or change in growth condition, causes conversion to the lytic cycle where more phage particles are assembled and released (Oppenheim et al., 2005).
25
A feature referred to as lysogenic conversion has been observed in a number of lysogenic phages. Naturally, the phage genome is incorporated into the host’s genome but not expressed until induced. However, in some instances, a region of the phage sequence may be expressed alongside the host genes leading to phenotypic changes in the host (Canchaya et al., 2004). Such changes may include making the host cell membrane more or less permeable to other phages which can alter its pathogenicity (Keen, 2012). This phenomenon has been observed in
Corynebacterium diphtheriae where the toxin identified as the main virulence factor is encoded in the genome of phage β (Mokrousov, 2009). Other examples include Streptococci where the pyogenic exotoxin responsible for the skin rash observed in scarlet fever is only expressed when the bacterium is a lysogen (Todar, 2001). Staphylococcal enterotoxin, panton-valentine leucocidin (PVL), exfoliative toxin (ETA) and staphylokinase (SAK) are also phage encoded in Staphylococci (Riley, 2006).
A widely studied example of a lysogenic phage is Lambda (Figure 1.7). The Lambda phage is a tailed phage capable of undergoing both lytic and lysogenic cycles and has been the basis of several studies that have increased our understanding of gene functions and regulation, DNA replication and virion assembly (Wommack & Colwell, 2000; Rajagopala et al., 2011).
26
Figure 1.7: (A) An electron micrograph of λ phage showing the morphology with distinct tail fibres
(Rajagopala et al., 2011) (B) A descriptive model of λ bacteriophage (en.wikibooks.org [Accessed: 25-04-2013]).
Detailed studies on this phage have focused on characterizing the genetic switch that determines whether the phage is incorporated into the host genome, thus becoming a prophage, or new viruses are assembled leading to cell lysis (Court et al., 2007).
In E. coli, lambda phage attaches and injects its DNA through the interaction of J protein found at the tip of its tail and the lamB gene product from the host. Host RNA polymerase binds to viral promoters pR and pL leading to bi-directional transcription (Werts et al., 1994).
Viral genome integration is driven by int (integrase) protein which simultaneously binds to both the attB site on the bacterial genome and the attP site on the viral genome. Site- specific integration implies that a host genome cannot have more than one copy of lambda gene sequence under normal circumstances (Goldstein et al., 1984; Rajagopala et al., 2011). When induced, the lytic cycle of lambda follows a similar pattern to T4 phage (Figure 1.8).
27
Figure 1.8: The lysogenic life cycle of lambda phage with a description of the effect of an induction event (Todar, 2001).
1.6.3 Pseudolysogeny
This simply refers to phages that are neither lytic nor lysogenic under prevailing conditions (Łoś & Węgrzyn, 2012). It is an unstable condition where the phage fails to actively replicate
and produce new viral particles nor establish itself as a prophage (Figure 1.9). Pseudolysogeny predominantly occurs under nutrient deprivation where the host bacterial cell is incapable of supporting either DNA replication or protein synthesis (Feiner et al., 2015). The phage genome remains in a non-integrating and non-replicating pre-prophage state, where it is referred to as an episomal phage, until a favourable nutritional state is restored, at which point it can either
28
enter a lytic or lysogenic life cycle (Miller & Day, 2008). The pseudolysogenic preprophage does not replicate, therefore, if the bacteria undergoes cell division while the nutrient deprivation state persists, the phage is inherited by only one daughter cell (Feiner et al., 2015).
Figure 1.9: Schematic representation of Pseudolysogeny (Feiner et al., 2015).
Classifying phages as pseudolysogenic can be difficult, as the phenomenon relies on the physiological state of the host cell. Bacterial cells are known to have variable growth rates under optimized laboratory conditions compared to natural environments. The latent time for a lytic phage might therefore be extended due to lack of some nutrients, leading to slower assembly