P R O C E E D I N G S
Open Access
Proposing a highly accurate protein structural
class predictor using segmentation-based
features
Abdollah Dehzangi
1,2*†, Kuldip Paliwal
3, James Lyons
3, Alok Sharma
1,4, Abdul Sattar
1,2From
The Twelfth Asia Pacific Bioinformatics Conference (APBC 2014)
Shanghai, China. 17-19 January 2014
Abstract
Background:Prediction of the structural classes of proteins can provide important information about their functionalities as well as their major tertiary structures. It is also considered as an important step towards protein structure prediction problem. Despite all the efforts have been made so far, finding a fast and accurate
computational approach to solve protein structural class prediction problem still remains a challenging problem in bioinformatics and computational biology.
Results:In this study we propose segmented distribution and segmented auto covariance feature extraction methods to capture local and global discriminatory information from evolutionary profiles and predicted secondary structure of the proteins. By applying SVM to our extracted features, for the first time we enhance the protein structural class prediction accuracy to over 90% and 85% for two popular low-homology benchmarks that have been widely used in the literature. We report 92.2% and 86.3% prediction accuracies for 25PDB and 1189 benchmarks which are respectively up to 7.9% and 2.8% better than previously reported results for these two benchmarks.
Conclusion:By proposing segmented distribution and segmented auto covariance feature extraction methods to
capture local and global discriminatory information from evolutionary profiles and predicted secondary structure of the proteins, we are able to enhance the protein structural class prediction performance significantly.
Background
Protein structural class prediction problem is defined as categorizing a given protein into one of the four struc-tural classes namely, all-a, all-b, a +b, and a/b [1]. Knowledge of the structural classes of proteins can also provide important information about their functional-ities and overall folding types [2,3]. Therefore, protein structural class prediction problem is considered as an important step towards the protein structure prediction problem. Despite the importance of this problem, find-ing a fast and accurate computational approach to solve
this problem when the sequence similarity rate is low still remains an unsolved problem for bioinformatics and computational biology.
During the past two decades, a wide range of studies, using machine learning-based methods, have been con-ducted to solve this problem [4,5]. These studies can be categorized into two groups. The first group consists of studies that have tried to address this problem by posing novel classification techniques [6,7]. They pro-posed a wide range of classification techniques based on different learning algorithms such as, Bayesian based learners [8], Meta-classifiers [9-13], Support Vector
Machines (SVM) [14-17], Artificial Neural Network
(ANN) [18-20], and ensemble classifiers [21-25]. Among a wide range of classification techniques used to tackle this problem, SVM classifier has attained the best results * Correspondence: [email protected]
†Contributed equally
1
Institute for Integrated and Intelligent Systems (IIIS), Griffith University, Kessels Road, Brisbane, Australia
Full list of author information is available at the end of the article
© 2014 Dehzangi et al.; licensee BioMed Central Ltd. This is an Open Access article distributed under the terms of the Creative Commons Attribution License (http://creativecommons.org/licenses/by/2.0), which permits unrestricted use, distribution, and reproduction in any medium, provided the original work is properly cited. The Creative Commons Public Domain Dedication waiver (http://creativecommons.org/publicdomain/zero/1.0/) applies to the data made availablein this article, unless otherwise stated.
for this task [5,22,26,27]. The second group consists of studies that have mainly focused on proposing novel features that capture local and global discriminatory information to address protein structural class predic-tion problem such as sequence based informapredic-tion [10,28-30], pseudo amino acid composition [31-33], phy-sicochemical-based information [15,22,28,34-36], and structural based information [5,33,37-40]. The most important enhancements in protein structural class pre-diction accuracy have been based on relying on these techniques rather than exploring the impact of classifi-cation techniques. These recent enhancements were mainly because of extracting features from Position
Specific Scoring Matrix (PSSM) profiles [41] as well as structural information extracted from the predicted sec-ondary structure of proteins [42].
The most significant enhancement by solely relying on the PSSM for feature extraction was achieved by [16,26,40]. They used PSSM profiles to extract sequence order infor-mation based on the concepts of dipeptide composition, auto covariance and composition of the amino acids. They used entire protein sequence as a general entity to extract these features. Hence, the auto covariance and dipeptide composition calculated along an entire protein sequence were used as its local descriptor. Further enhancement for protein structural class prediction accuracy has been achieved by including structural information extracted from the predicted secondary structure of the proteins using PSIPRED [42]. By adding these features to the extracted features from the PSSM, the protein structural class prediction accuracy has been significantly improved especially when the sequence similarity rate was low [27,37,43]. Similar to the features extracted from the PSSM, the whole protein as a general entity was used to extract these features as well. Despite all the recent efforts on extracting effective features to capture local and global discriminatory information from evolutionary and struc-tural profiles, the protein strucstruc-tural class prediction accu-racy have not been improved significantly since the study of Mizianty and Kurgan in 2009 [5,6].
In this study, we propose segmented auto covariance and segmented distribution feature extraction methods to cap-ture more local sequence order information from evolu-tionary and structural profiles. We also employe the concept of occurrence and composition feature groups to capture global sequence order information based on evolu-tionary, and structural profiles. First, by solely relying on the PSSM profiles for feature extraction, we enhance the protein structural class prediction accuracy by over 15% and 5% for 25PDB and 1189 benchmarks respectively com-pared to similar studies [26]. These enhancements highlight the potential discriminatory information embedded in the PSSM that have not been adequately explored in the litera-ture. Then, by exploring our proposed feature extraction
techniques to include structural information derived from the predicted secondary structure using SPINE-X [44], we achieve up to 92.2% and 86.3% prediction accuracies respectively for 25PDB and 1189 benchmarks and enhance the overall protein structural class prediction accuracy even further by 7.9% and 2.8% better than previously reported results found in the literature [5,6,27].
Benchmarks
To evaluate the prediction performance of our proposed approaches, we employe two benchmarks namely 25PDB and 1189. These two benchmarks have been widely used for protein structural class prediction problem. The 25PDB was introduced by [45] consisting of 1673 proteins with less than 25% sequence similarities in average (the homology-range between 22% and 45%). This benchmark extracted from 25% PDBSELECTED which includes high-resolution non-homologous proteins from theProtein
Data Bank (PDB)[46]. Therefore, it is considered as an appropriate representative of benchmarks consisting of proteins in twilight zone (proteins with sequence similari-ties between 20% and 45%) for protein structural class prediction problem. Hence, in this study, the 25PDB benchmark is used as the main source to investigate the effectiveness of our proposed model.
The other benchmark employed in this study is known as the 1189 benchmark. The 1189 benchmark was intro-duced by [8] consisting of 1189 proteins with less than 40% sequence similarities. This benchmark was modified in later studies to address further corrections ofStructural
Classification of Proteins (SCOP)[47] and 97 of its proteins were removed [45]. Therefore, later version of this mark consists of 1092 proteins. Sequences in this bench-mark have lower resolution than proteins in the 25PDB benchmark. Therefore, despite higher sequence similarity in average among proteins in this benchmark compared to 25PDB benchmark, similar (or in many cases, even lower) protein structural class prediction accuracies has been reported for 1189 benchmark compared to 25PDB bench-mark [5,6,24,48]. Since, this benchbench-mark has been widely used to investigate the performance of the methods used for protein structural class prediction problem, it is also adopted here to compare our achieved results directly with previously reported results found in the literature [45]. Employed benchmarks in this study and the number of proteins belonging to each structural class are shown in Table 1.
Feature extraction methods
In this study, we use PSSM profiles to extract evolution-ary-based information as well as predicted secondary structure using SPINE-X to extract structural-based information. PSSM is calculated by applying the PSI-BLAST [41] in which its cut off value (E) is set to 0.001
on our explored benchmarks (using NCBI’s non redun-dant (NR) protein data base). Given a protein sequence, PSSM produces the substitution probability of the amino acids along its sequence based on their position with all 20 amino acids. PSSM consists of two L × 20 matrices (Lis the length of a protein and the columns of the matrices represent 20 amino acids). The first matrix is called PSSM_cons and gives the log-odd of the substitution probability. The second matrix is called PSSM_prob and gives the normalized substitution prob-ability for each amino acid [27].
We also use predicted secondary structure using SPINE-X which was recently proposed by [44] and attained better results than PSIPRED on predicting pro-tein secondary structure (especially for the coded area). Given a protein sequence, SPINE-X produces aL × 3 matrix (which will be referred to SPINE-M for the rest of this study) including the normalized probability of contri-bution of a given amino acid based on its position along the protein sequence to build one of the three secondary structure elements namely,a-helix,b-strands, and coils. It also return a transformed version of the protein sequence (also extracted from the SPINE-M) in which each amino acid along the protein sequence is replaced with H(represents helix),E (represents strand), orC (represents coil) based on its tendency to incorporate in building one of these secondary structure elements. We will refer to this sequence as the structural consensus sequence. It is expected that predicted secondary struc-ture using SPINE-X provides significant structural infor-mation for the protein structural class prediction problem similar to or even better than PSIPRED due to its better performance [44].
Consensus sequence-based occurrence
To provide global discriminatory information about the sequence order of the amino acids along a protein sequence, we first extract the occurrence of the amino acids from the evolutionary consensus sequence as well as occurrence of secondary structure elements from the structural consensus sequence. As it was mentioned ear-lier, the structural consensus sequence is produced as one of the output of SPINE-X. The evolutionary consensus sequence is calculated based on the PSSM as follows. To extract this sequence, we replace a given amino acid along the original protein sequence (O1, O2, ...,OL) with an amino acid with maximum substitution probability in the row corresponding to the location of that amino acid in
the PSSM (CP1, CP2, ..., CPL). This is done using the
fol-lowing two steps. In the first step, the index is found as: Ii=argmax{Pij: 1≤j≤20}, 1≤i≤L, (1)
wherePijis the substitution probability of the amino acid at location i with the j-th amino acid in the PSSM_cons. In the second step, we replace the amino acid ati-thlocation of original protein sequence by thej-th amino acid to form the consensus sequence. Note that the PSSM_cons is used in this study for feature extraction (which it is normalized using min-max method) as it was used in the literature [26,27].
After calculating evolutionary consensus sequence, we count the occurrence of each amino acid (for all 20 amino acids) along this sequence and produce corre-sponding feature group (AAO). Similarly, we calculate the occurrence of each secondary structure element (for all three elements) in the structural consensus sequence and produce the corresponding feature group (SSEO). Occurrence feature group as the global descriptor of the proteins is used in this study instead of composition of the amino acids (occurrence of amino acids divided by the length of protein sequence) since it maintains the length information which is disregarded in the composi-tion feature group [15].
Semi-composition
In this method, we calculate semi-composition feature group from both PSSM and SPINE-M. It is called semi-composition because instead of using the protein sequence directly to calculate the composition of each amino acid along the protein sequence (as it was done conventionally [27]), we calculate the summation of the substitution probability for each amino acid directly from the PSSM (similar to [26]) or normalized frequency of each secondary structure element from the SPINE-M. The semi-composition derived from the PSSM (
PSSM-AAC) is calculated as follows: PSSM−AACj= 1 L L i=1 Pij, (j= 1, ..., 20). (2)
In the similar manner, we calculate the semi-composi-tion of each secondary structure element by adding the normalized frequencies of the corresponding element from the SPINE-M (SPINE-SSEC) as follows:
SPINE−SSECj= 1 L L i=1 Sij, (j= 1, 2, 3), (3)
where Sij is the normalized probability of the occur-rence of the j-thsecondary structure element at location
iof the protein sequence in the SPINE-M. It was shown that using semi-composition method is able to provide Table 1 The properties of 1189 and 25PDB benchmarks.
Benchmarks All-a All-b a/b a+b Total
1189 223 294 334 241 1092
more discriminatory information compared to extracting composition of the amino acids feature group from the original protein sequence [26]. This feature group is also able to provide important global discriminatory informa-tion about the substituinforma-tion probability of the amino acids as well as normalized frequency of secondary structure elements.
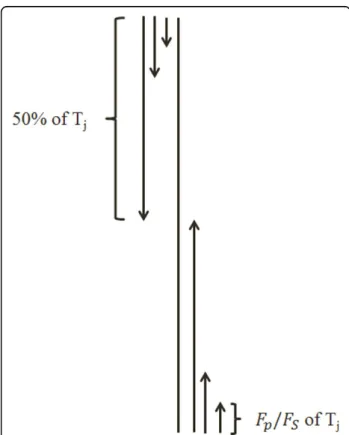
Segmented distribution
This method is specifically proposed to add more local sequence order information about how the amino acids based on their substitution probability with each other (extracted from the PSSM) as well as their tendency to incorporate in one of the secondary structure elements (extracted from SPINE-M) are distributed along the pro-tein sequence. We propose this segmentation method in the manner where segments of a protein sequence are of unequal lengths and each segment is represented by a distribution feature which is computed as follows. First, for the PSSM, to extract the segmented distribution feature group (PSSM-SD), we compute the total sum of substitution probability of the j column of the PSSM(Tj=Li=1Pij). Then, we start from the first row
of the PSSM and compute the partial sum of the substi-tution probability of the amino acid amino acidj, for the firsti amino acids which is given byS1=I
(1)
j
i=1Pij. Using the distribution factorFP(which is a parameter investigated in this study), we find out the maximum valueI(1)j of indexi such that partial sumS1 is less than
or equal to the FP% of total sum (Tj). Thus we can say that the first ?6? substitution probabilities contribute to
FP% of the total sum (Tj). We use ?6? to define the end-ing location of the first segment, while its beginnend-ing point is taken to be 1 (which represents the first row of the PSSM). The distribution feature of this segment is given by ?6?. In a similar manner, we find out the num-ber of first Ij(2),I(3)j , ...,I(50/FP)
j amino acids of the protein
sequence that contribute to 2FP%, 3FP%, ..., 50% ofTj (50% of Tjstarting from the first row of the PSSM), respectively. IndicesI(2)j ,I(3)j , ...,I(50/FP)
j , are used to define
the ending locations of segments 2, 3, ..., 50/FP, respec-tively; while the beginning location of all these segments remains to be 1. Hence, the distribution features for these segments are computed as I(ji),i= 2, 3, ..., 50/FP.
Note that we have thus computed 50/FPdistribution fea-tures by processing the protein sequence starting from the first row of the PSSM in downward direction. We repeat this process starting from the last row of the PSSM in upwards direction to get another set of 50/FP features (to explore the rest of 50% ofTjstarting from the end of protein sequence corresponding to the last
row of the PSSM). Thus, the total of 2× (50/FP) = 100/FP distribution features are computed for each column of the PSSM.
The distribution factor (FP) is a parameter which is determined here experimentally. For this, three values of
FP (5, 10, and 25) are investigated. Thus there will be 20, 10, and 4 features forFP= 5, 10 and 25, respectively for the j-th column of the PSSM. Since there are 20 amino acids (corresponding to 20 columns in the PSSM) we produce 20 × 20, 20 × 10, and 20 × 4 fea-tures corresponding to FP= 5, 10, and 25, respectively. In the similar manner, we calculate the segmented dis-tribution of the normalized frequency of the secondary structure elements from the SPINE-M (SPINE-SD) using
FS = 5, 10, and 25 (where Fsis used as the distribution factor for the SPINE-M equivalent toFP used for the PSSM) and extract 3 × 20, 3 × 10, and 3 × 4 features in total for all three elements, respectively. This procedure is shown in Figure 1.
Segmented auto covariance
The concept of auto covariance have been widely used in the literature to capture local sequence order infor-mation and attained better results compared to similar methods used for this task such as dipeptide composi-tion [15,48,26,49]. Pseudo amino acid composicomposi-tion
Figure 1Feature extraction scheme using the segmented distribution method.
based features are good examples of these types of fea-tures [4,50]. These feafea-tures have been computed using the whole protein sequence as a single entity for feature extraction. Therefore, they are not able to adequately explore the local sequence order information embedded in the protein sequence [26]. In the present study, we extend the concept of segmented distribution features as described in the previous subsection to compute the auto covariance features from the segmented protein sequence. This is done to provide more evolutionary and structural sequence order information both from the PSSM and SPINE-M. First for the PSSM, we seg-ment the protein sequence using distribution factor of 25% (FP = 25) until reaching toFP = 50 from each side (for thej-th column). Using a procedure similar to the one described in the previous subsection in whichFP= 25, we calculateI(1)j ,I(2)j ,I(3)j ,I(4)j . These indices are used to divide protein sequence into four segments as fol-lows: From the first amino acid (corresponding to the first row of the PSSM) to ?6?; From the first amino acid (corresponding to the first row of the PSSM) to I(2)j ; From the last amino acid (corresponding to the last row of the PSSM) toI(3)j ; And from the last amino acid (cor-responding to the last row of the PSSM) to I(4)j . Then we calculate KP (distance factor used for the PSSM) numbers of auto covariance coefficients for each of these segments as follows:
PSSM - segn,m,j= 1 (I(jn)−m)× In max−m i=1 (Pi,j−Pave,j)×(P(i+m),j−Save,j), (n= 1, 2, 3, 4&m= 1,. . .,KP&j= 1,. . ., 20), (4)
where,Pave, jis the average substitution probability for the j-th column in the PSSM (for 20 columns). Note that 4 ×KP auto covariance coefficients are computed in this manner (2 ×KPfeatures by analyzing the PSSM in the downward direction and 2 ×KP features by ana-lyzing the PSSM in the upward direction). We also com-pute the global auto covariance coefficient (KPfeatures) corresponding to thej-thcolumn to provide more infor-mation as follows: PSSM - ACm,j= 1 (L−m)× L−m i=1 (Pi,j−Pave,j)×(P(i+m),j−Pave,j), (m= 1,. . .,KP&j= 1,. . ., 20). (5)
Thus, we have extracted a total of (2KP+ 2KP+KP= 5KP) auto covariance features in this manner (PSSM-seg + PSSM-AC). Therefore, for PSSM, for all of the amino
acids (all 20 columns of the PSSM) segmented auto covar-iance of substitution probability of the amino acids are extracted and combined to build the corresponding fea-ture group ( PSSM-SAC which consists of 20 × (2KP+ 2KP + KP) features in total). This procedure is also repeated for SPINE-M in the similar manner (whereKSis adopted as the distance factor for the SPINE-M equivalent toKPused for the PSSM). For all three secondary struc-ture elements we calculate segmented auto covariance of normalized frequency of secondary structure elements as follows: SPINE - segn,m,j= 1 (I(jn)−m)× In max−m i=1 (Si,j−Save,j)×(S(i+m),j−Save,j), (n= 1, 2, 3, 4&m= 1,. . .,KS&j= 1, 2, 3), (6)
where,Save, jis the average substitution probability for the j-th column in the SPINE-M. Similarly, the global auto covariance corresponding to the j-th column in SPINE-M is computed and added to this feature group as follows: SPINE - ACm,j= 1 (L−m)× L−m i=1 (Si,j−Save,j)×(S(i+m),j−Save,j), (m= 1,. . .,KS&j= 1, 2, 3). (7)
Combining seg and AC, we build SPINE-SAC feature group consisting of 3 × (2KS+ 2KS+KS)) fea-tures in total (4KSfeatures in SPINE-seg andKSfeatures in SPINE-AC).
Support Vector Machine (SVM)
SVM was introduced by [51] aiming to find theMaximal
Margin Hyperplane (MMH)based on the concept of the support vector theory to minimize the error. It trans-forms the input data to higher dimension using the ker-nel trick to be able to find support vectors (for nonlinear cases). The classification of some known points in input spacexiisyiwhich is defined to be either -1 or +1. Ifx′is a point in input space with unknown classification then:
y=sign n i=1 aiyiK(xi,x) +b , (8)
wherey′is the predicted class of pointx′. The function
K()is the kernel function;nis the number of support vec-tors andaiare adjustable weights andbis the bias. This classier is considered as the state-of-the-art classification techniques in the pattern recognition and attained the best results for the protein structural class prediction problem [5,6,26,27]. In this study, SVM classifier implemented in
the LIBSVM toolbox using Radial Base Function (RBF) as its kernel is used [52]. RBF kernel is adopted in our experi-ments due to its better performance than other kernels functions (e.g. polynomial kernel, linear kernel, and sig-moid [5,6]). RBF kernel is defined as follows:
K(xi,xj) =e−γ||xi−xj|| 2
, (9)
where g is the kernel parameter,xi and xj are input feature vectors. In this study, the gin addition to the cost parameter C(which also called the soft margin parameter) of the SVM classifier are optimized using grid search algorithm implemented in the LIBSVM package. The grid search algorithm tries various pairs of gandCvalues and selects the values with the best clas-sification accuracy [52] (using 10-fold cross validation evaluation method). The range of gamma and C para-meters to be searched in this algorithm are taken to be their default values used in the SVMLIB toolbox (these ranges were from 2-5to 215 forC and from 2-15to 23 for gamma). It is a simple algorithm as it has just two parameters to optimize (gandC). Despite its simplicity, it has been shown to be an effective method to optimize these parameters [26].
Results and discussion
We first investigate the effectiveness of our proposed feature extraction methods to capture local and global discriminatory information from the PSSM. We com-pare their performances with similar studies that relied solely on the PSSM for feature extraction [26]. In this step, we also explore the effective value for distance fac-tor (KP) in segmented auto covariance feature extraction method as well as segmentation factor (FP) in segmen-ted distribution method. To find the effective value for segmented auto covariance method, we study the KP value between 1 and 10 (similar to [26]). We also study the segmentation factor (FP) in segmentation distribution between three values used in this study (25, 10 and 5). In the second step, we conduct a similar experiments using the SPINE-X for feature extraction. We investigate the effectiveness of our proposed feature extraction method to extract these features from the SPINE-M as well as the effective values forKS(between 1 and 10) andFS(among three values (25, 10, and 5) used in this study) in the similar manner. In the final step, we add the structural features extracted from the SPINE-M using our proposed methods to the extracted features from the PSSM and compare our results with the best results found in the lit-erature for the protein structural class prediction pro-blem [5,6,27].
To explore the impact of the distance factor on the seg-mented auto covariance method, 10-fold cross validation is adopted as it was widely used in similar studies [26,45].
In this paper, we have used k-fold cross validation where
k= 10 to measure the prediction performance. We also provide these performance results using k-fold cross vali-dation as a function ofkwherek= 2, 3, 4, ..., 10 in Addi-tional File 1. In the 10-fold cross validation, the benchmark is divided into ten non-overlapping subsets called fold. Then in each iteration, the combination of nine folds is used for training purpose and the remained fold is used for testing purpose. This process repeats for all 10 folds to be used as the testing set. We also use Jackknife cross validation to report our overall achieved prediction accuracy as well as prediction accuracy achieved for each structural class individually to compare them with previous studies. In this method, in each itera-tion, all but one sample use as a training purpose while the remained sample is used for testing purpose. This process repeats for all the samples available in the bench-mark to be used as the testing sample. Jackknife is con-sidered as a computationally expensive approach for evaluation. Furthermore, it was shown in [45] that its performance is similar to 10-fold cross validation. Since it has been widely used to evaluate protein structural class prediction accuracy, it is also adopted in this study to enable us to directly compare our results with the state of the art results found in the literature [5,6,26,27]. We will use the overall prediction accuracy (in percen-tage) as the main accuracy measurement to be able to directly compare our achieved results with previously reported results found in the literature which is defined as follows:
Q= C
N ×100, (10)
whereCis the number of correctly classified test sam-ples andNis the total number of test samples. We will also report the sensitivity, specificity and Matthews
Correlation Coefficient (MCC)measurements for each structural class to provide more information about the statistical significant of our achieved results [27,45]. Sen-sitivity measures the proportion of correctly classified proteins compared to the whole number of samples which are classified as correct (correct versus incorrect) and is calculated as follows:
Sensitivity= TP
TP+FN ×100, (11)
where TPis the number of correctly identified (true positive) samples, whileFNis the number of incorrectly rejected samples (false negative). On the other hand, specificity measures the proportion of the number of correctly rejected samples compared to the whole num-ber of rejected samples (correctly versus incorrectly) and is calculated as follows:
Specificity= TN
TN+FP×100, (12)
where TN is the number of correctly rejected (true negative) samples whileFPis the number of incorrectly accepted samples (false positive). These two parameters are closely related to the prediction error and a predic-tor which is 100% sensitive and specific is considered as a perfect predictor (while 0% sensitive and specific is opposite). On the other hand, MCC measures the classi-fication correlation and varies between -1 and 1 (where 1 indicates higher prediction quality while -1 indicate lower prediction quality and 0 indicate random correla-tion) and calculated as follows:
MCC= (TN×TP)−(TN×FP)
(TP+FP)(TP+FN)(TN+FP)(TN+FN).(13) More information about these three measurement for protein structural class prediction problem can be found in [27] and [45]. We will report sensitivity as well as specificity and MCC measures for all four structural classes for the best results reported in this study.
Exploring the impact of our proposed methods relying only on PSSM for feature extraction
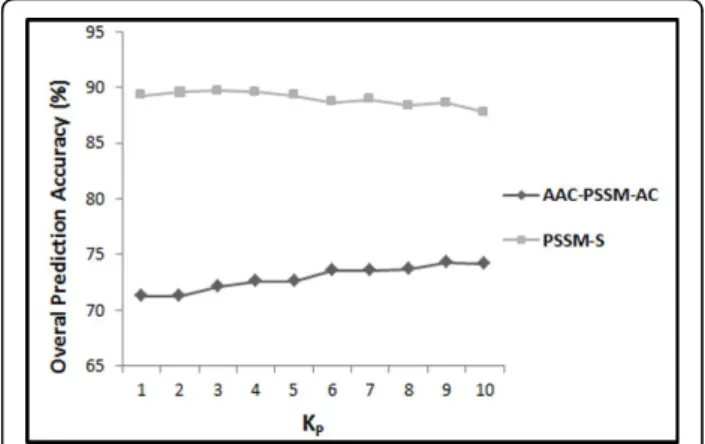
In this step, we first extract the feature vector proposed by [26] and reproduce their results with respect to different distance factors (between 1 and 10). Their explored feature vector consists of semi-composition (PSSM-AAC) and global auto covariance (PSSM-AC) features extracted from the PSSM (called ACC-PSSM-AC). In continuation, we build a feature vector based on our proposed feature extraction methods in this study relying solely on the PSSM for feature extraction. We extract AAO (occur-rence of the amino acids extracted from evolutionary consensus sequence (20 features)), PSSM-AAC (semi-composition from PSSM (20 features)), PSSM-SAC (seg-mented auto covariance in whichKPhas been adjusted to 1 to 10 in 10 different experiments (KP× 5 × 20 features)), and PSSM-SD (segmented distribution in which segmen-tation factor has been adjusted to 25 (4 × 20 = 80 fea-tures)) feature groups. The combination of these feature groups is referred as PSSM-S (AAO + PSSM-AAC + PSSM-SD + PSSM-SAC = PSSM-S). The results achieved by reproducing [26] experiment compared to our results with respect to different values ofKP(between 1 and 10) for the 25PDB and 1189 benchmarks are shown in Figure 2 and Figure 3 respectively.
Note that we optimizedg and C forKP = 1 andFP= 25 using grid algorithms on the 1189 benchmarks (to avoid over tuning) and used corresponding values for the rest of this study (g= 0.055 andC= 500). We deter-mine the parameters used in this study for feature extraction as well as employed classification technique
on the 1189 benchmark while the 25PDB is not used at all and reserved to investigate the generality and effec-tiveness of our proposed model. However, our experi-ments have determined that there is no significant difference between the optimized parameters for the 25PDB and 1189 benchmarks for our extracted features.
As we can see in Figure 2 and Figure 3, our extracted feature vector significantly outperforms the results reported in [26] for all the values used forKP (between 1 and 10). It shows the effectiveness of the proposed segmentation-based method to explore discriminatory information embedded in the PSSM compared to use of whole protein sequence as a general entity. It also shows that by using segmented auto co-variance method, even by using very low values forKP, we can achieve to high prediction accuracy since it is able to explore adequate local sequence order information (also emphasis on the impact of segmented distribution method). We report up to 89.6% prediction accuracy (using jackknife cross valida-tion) by adjustingKPto 4 (20 + 20 + 5 ×KP(= 4) × 20 + 80 = 520 features in total) which is 15.5% better than 74.1% prediction accuracy achieved by reproducing [26] Figure 2The overall accuracies of PSSM-S compared to
AAC-PSSM-AC for 25PDB benchmark.
Figure 3The overall accuracies of PSSM-S compared to
experiment (using KP= 9 in AAC_PSSM_AC) for the 25PDB benchmark (Figure 2). Similarly, we achieve up to 79.7% prediction accuracy by adjustingKPto 4 which is 5.1% better than 74.6% prediction accuracy achieved by reproducing [26] experiment (usingKP= 6 in AAC_PSS-M_AC) for the 1189 benchmark (Figure 3). Since the best results for both 25PDB and 1189 benchmarks are achieved by settingKPto 4 (the achieved results do not differ signif-icantly for different values used forKP(between 1 and 10) which highlights the effectiveness of segmentation techni-que rather than the effect of the distance factor (KP) to extract this feature group), it is adopted as a distance fac-tor to extract features for segmented auto covariance from the PSSM for the rest of this study.
We also repeat this experiment to explore the impact of segmentation factor FPin segmented distribution fea-ture extraction method. The prediction accuracies achieve by adjusting the segmentation factor to 10 and 5 are not improved (which even by increasingKP, they are reduced) compared to the achieved results by adjust-ing this parameter to 25. It highlights the sufficiency and effectiveness of adopting FP = 25 as the segmentation factor compare to use of 10 and 5. In other word, using four segments is able to effectively provide adequate dis-criminatory information for this task better than increasing the number of segments to 10 or 20.
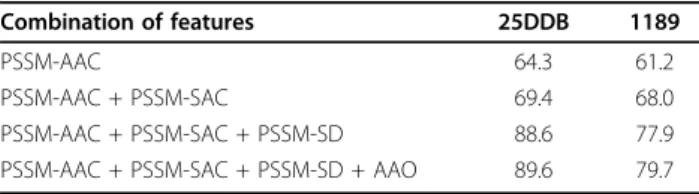
In Table 2, we show the prediction accuracy achieved by adding proposed feature groups (in which KP = 4 andFP= 25) in this study one by one to PSSM-AAC to build PSSM-S (for both 25PDB and 1189 benchmarks). In this manner, we can investigate the effectiveness of each feature group individually on the reported predic-tion accuracy. As we can see, adding PSSM-SAC and PSSM-SD significantly enhance the protein structural class prediction accuracy which highlights the impact of segmentation approach to provide significant discrimi-natory information for this task.
Exploring the impact of our proposed methods relying only on SPINE-X for feature extraction
In this step, we investigate the impact of our proposed feature extraction method on the SPINE-X for feature extraction. We build a feature vector based on our
proposed methods in this study relying solely on the SPINE-M for feature extraction. We extract SSEO (occurrence of the secondary structure elements from predicted secondary structure using SPINE-M (3 fea-tures)), SPINE-SSEC (semi-composition from SPINE-M (3 features)), SPINE-SAC (segmented auto covariance were KS adjust to 1 to 10 in 10 different experiments (KS× 5 × 3 features)), and SPINE-SD (segmented distri-bution where segmentation factor adjusts to 25 (4 × 3 = 12 features)) feature groups. The combination of these feature groups is referred as S (SSEO + SPINE-SSEC + SPINE-SD + SPINE-SAC = SPINE-S). The pro-tein structural class prediction results are obtained in this subsection using the Jack-knife cross validation method.
The results achieved for SPINE-S with respect to dif-ferent values of KS (between 1 and 10) for the 25PDB and the 1189 benchmarks are shown in Figure 4. These results are obtained with distribution factorFS = 25. As we can see in Figure 4, these SPINE-S features give best results forKS ≥ 4. ForKS = 4, these features produce 82.3% for the 25PDB benchmark and 80.3% for the 1189 benchmark. Note that these results are comparable to their corresponding PSSM results reported in Section 5.1. This shows the effectiveness of the proposed segmenta-tion-based method to explore discriminatory information from the SPINE-M (similar to the PSSM). ForKS= 4, the feature vector has 78 features (3 + 3 + 5 ×KS(= 4) × 3 + 12 = 78). Furthermore, we have studied the SPINE-S fea-tures for distribution factor (FS) having values 5, 10, and 25. We have found that all the three values ofFS gave similar results. Therefore, we have reported the results for
FS= 25.
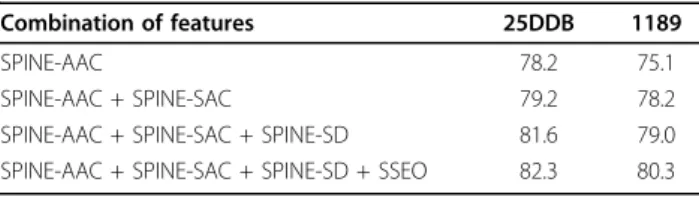
In Table 3, we show the prediction accuracy achieved by adding proposed feature groups (in whichKS = 4 and FS = 25) in this study one by one to SPINE-SSEC to
Table 2 The impact of the proposed feature extraction groups (using PSSM for feature extraction) proposed in this study to enhance protein structural class prediction accuracy (in %).
Combination of features 25DDB 1189
PSSM-AAC 64.3 61.2
PSSM-AAC + PSSM-SAC 69.4 68.0
PSSM-AAC + PSSM-SAC + PSSM-SD 88.6 77.9 PSSM-AAC + PSSM-SAC + PSSM-SD + AAO 89.6 79.7
Figure 4The overall accuracies of SPINE-S with respect to
different values ofKSfor 25PDB and 1189 benchmarks (where
build SPINE-S (for both of the 25PDB and 1189 bench-marks). In this manner, we can investigate the effective-ness of each feature group individually on the reported prediction accuracy. We can observe from Table 3 that addition of SPINE-SAC and SPINE-SD has enhanced the protein structural class prediction accuracy, similar to PSSM.
Exploring the impact of our proposed method using both PSSM and SPINE-X for feature extraction
In continuation we investigate the effectiveness of our proposed feature extraction methods to extract struc-tural information from the SPINE-X and add these fea-tures to evolutionary information extracted from the PSSM. We extract SSEO (3 features), SPINE-SSEC (3 features), SPINE-SAC (whereKS adjusted from 1 to 10 in 10 different experiments (KP ×5 × 3 features)), and SPINE-SD (whereFS = 25 for the SPINE-M). The gen-eral architecture of our proposed feature extraction model is shown in Figure 5. The combination of the extracted features from the PSSM and the SPINE-M is referred to as PSSM-SPINE-S for the rest of this study (AAO + PSSM-AAC + PSSM-SAC + PSSM-SD + SSEO + SPINE-AAC + SPINE-SAC + SPINE-SD = PSSM-SPINE-S).
In the first step, we set the segmentation factor (FS) to 25 and adjust distance factor (KS) between 1 and 10 and add these features to the extracted features from the PSSM (while for the PSSM, distance factor is set toKP= 4 and segmentation factor is set to 25 which is investigated earlier in Section 5.1). We conduct 10 experiments by adjustingKS from 1 to 10 in this step (using jackknife cross validation). The results achieved for both of the 25PDB and 1189 are shown in Figure 6. In this part, for the first time we enhance the protein structural class pre-diction accuracy to over 90% for 25PDB benchmark and 85% for 1189 benchmark. By adjustingKS= 4 (similar to the distance factor adopted to extract segmented auto cov-ariance feature group from the PSSM) and segmentation factorFS= 25 (similar toFP) we achieve up to 92.2% and 86.3% prediction accuracies for both of the 25PDB and 1189 benchmarks (20 + 20 + 5 ×KP(= 4) × 20 + 80 + 3 + 3 + 5 ×KS(= 4) × 3 + 12 = 598 features in total), up to 7.9% and 2.8% better than previously reported results for these two benchmarks using evolutionary and structural features simultaneously [6,27,5].
These enhancements achieved by increasing the predic-tion accuracy for all of the structural classes monotoni-cally. We achieve to over 90% prediction accuracies (sensitivity) for three structural classes for the 25PDB benchmark (96.8%, 93.7%, and 90.1% prediction accuracies for all-a, all-b, anda/bstructural classes, respectively). We also report 87.0% prediction accuracy fora+b struc-tural class, which is considered as a difficult strucstruc-tural class to predict which is 9.4% over the highest results reported for this structural class [48]. Despite the results achieved for the 1189 benchmark have not been as high as the results achieved for the 25PDB benchmark, they still have been significantly better than the reported results for this benchmark (especially by considering that it has not Table 3 The impact of the proposed feature extraction
groups (using SPINE-M for feature extraction)proposed in this study to enhance protein structural class prediction accuracy (in %).
Combination of features 25DDB 1189
SPINE-AAC 78.2 75.1
SPINE-AAC + SPINE-SAC 79.2 78.2
SPINE-AAC + SPINE-SAC + SPINE-SD 81.6 79.0 SPINE-AAC + SPINE-SAC + SPINE-SD + SSEO 82.3 80.3
Figure 5The general architecture of our proposed feature extraction model. The number of features extracted in each feature group is shown in the brackets below the feature groups’names.
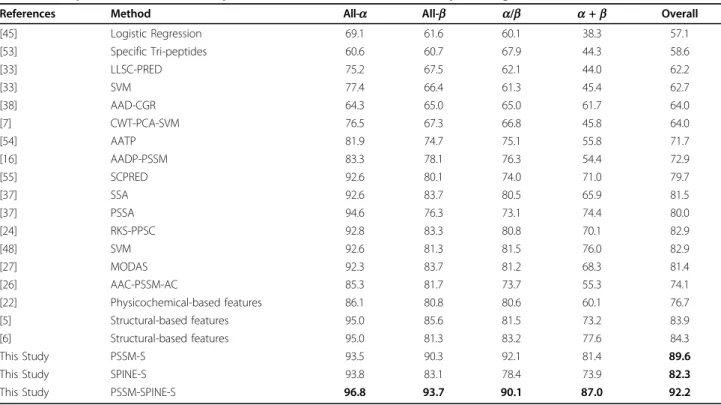
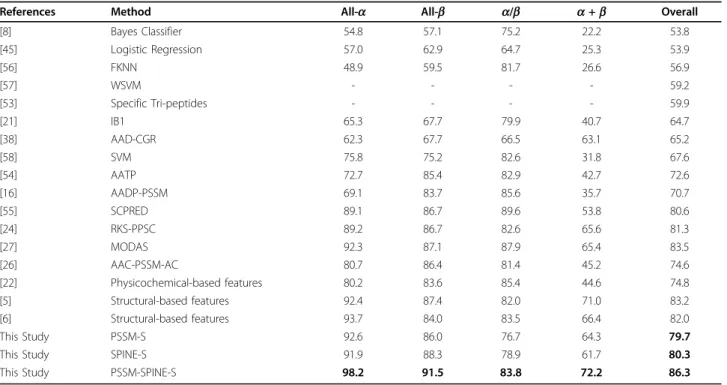
been improved since the study of Mizianty and Kurgan in 2009). We also report 98.2%, 91.5%, and 72.2% prediction accuracies for all-a, all-b, anda +bstructural classes which are respectively 4.5%, 4.1% and 1.2% over the best results reported for these structural classes in the literature [6,5]). The results achieved (overall prediction accuracy as well as sensitivity for each structural class) in this study compared to previously reported results for the 25PDB and 1189 benchmarks are shown in Table 4 and Table 5, respectively.
Adding structural features to evolutionary features extracted in our experiments enhances the results for
up to 2.4% and 6.6% better than relying solely on evolu-tionary features for the 25PDB and 1189 benchmarks respectively. This emphasis on the impact of structural information extracted from the SPINE-X in general for the protein structural class prediction problem.
We also provide the specificity and MCC for the best results reported in this study (results achieved for the PSSM-S, SPINE-S, and PSSM-SPINE-S) for the 25PDB and 1189 benchmarks in Table 6. As we can see, high values for specificity (near 100%) similar to the high sensitivity values in Table 4 and Table 5 (near 100%) as well as MCC values (which are all higher than 0.5) for our achieved results support the statistical significant of our reported results in this study.
Conclusion
In this study we proposed novel segmented distribution and segmented auto covariance feature extraction methods to capture more local and global discriminatory information from evolutionary profile and predicted secondary structure of proteins. We first extract the corresponding features from the PSSM in addition to the occurrence of the amino acids extracted from evolutionary consensus sequence and semi-composition extracted from the PSSM. Then by applying SVM to the extracted features, we enhanced the protein structural class prediction accuracy for low-homol-ogy protein sequences (twilight zone) up to 15.5% for the 25PDB benchmark and 5.1% for the 1189 benchmark better than similar studies that relied solely on the PSSM for Figure 6The overall accuracies of PSSM-SPINE-S with respect
to different values ofKSfor 25PDB and 1189 benchmarks
(whereKP= 4 andFP= 25%).
Table 4 Comparison of the results reported for the 25PDB benchmark (in percentage %)
References Method All-a All-b a/b a+b Overall
[45] Logistic Regression 69.1 61.6 60.1 38.3 57.1 [53] Specific Tri-peptides 60.6 60.7 67.9 44.3 58.6 [33] LLSC-PRED 75.2 67.5 62.1 44.0 62.2 [33] SVM 77.4 66.4 61.3 45.4 62.7 [38] AAD-CGR 64.3 65.0 65.0 61.7 64.0 [7] CWT-PCA-SVM 76.5 67.3 66.8 45.8 64.0 [54] AATP 81.9 74.7 75.1 55.8 71.7 [16] AADP-PSSM 83.3 78.1 76.3 54.4 72.9 [55] SCPRED 92.6 80.1 74.0 71.0 79.7 [37] SSA 92.6 83.7 80.5 65.9 81.5 [37] PSSA 94.6 76.3 73.1 74.4 80.0 [24] RKS-PPSC 92.8 83.3 80.8 70.1 82.9 [48] SVM 92.6 81.3 81.5 76.0 82.9 [27] MODAS 92.3 83.7 81.2 68.3 81.4 [26] AAC-PSSM-AC 85.3 81.7 73.7 55.3 74.1 [22] Physicochemical-based features 86.1 80.8 80.6 60.1 76.7 [5] Structural-based features 95.0 85.6 81.5 73.2 83.9 [6] Structural-based features 95.0 81.3 83.2 77.6 84.3 This Study PSSM-S 93.5 90.3 92.1 81.4 89.6
This Study SPINE-S 93.8 83.1 78.4 73.9 82.3
feature extraction [26]. Our results supported the idea that potential sequence order information embedded in the PSSM has not been adequately explored in the literature.
In continuation, we added similar features extracted from the predicted secondary structure using the SPINE-X (segmented distribution, segmented auto covariance of the normalized probability of secondary structure elements, occurrence of secondary structure elements extracted from the structural consensus sequence, and semi-composition of the secondary structure elements extracted from the SPINE-M) to previously extracted features from the PSSM. By incorporating structural information, we achieved up to 92.2% and 86.3% for the 25PDB and the 1189 benchmarks which were respectively up to 7.9% and 2.8% better than previously reported results found in the literature for these
two benchmarks that have been widely used for the protein structural class prediction problem [5,6,27].
Future works
We are currently investigating the effectiveness of our pro-posed techniques in this study to tackle protein fold recog-nition. We are aiming to develop our protein structural class, and fold prediction server which will be publicly available in the near future. We also aim at exploring the-state-of-the-art feature reduction techniques on our extracted features to investigate the possibility of further feature reduction for these tasks.
Additional material
Additional file 1: Results as a function of k in k-fold cross validation The results achieved using SVM to the SPINE-S, S, and PSSM-SPINE-S feature vectors using 2 to 10 fold cross validation for
25PDB and 1189 benchmarks.
Competing interests
The authors declare that they have no competing interests.
Acknowledgements
NICTA is funded by the Australian Government through the Department of Communications and the Australian Research Council through the ICT Centre of Excellence Program.
This article has been published as part ofBMC GenomicsVolume 15 Supplement 1, 2014: Selected articles from the Twelfth Asia Pacific Bioinformatics Conference (APBC 2014): Genomics. The full contents of the supplement are available online at http://www.biomedcentral.com/ bmcgenomics/supplements/15/S1.
Table 5 Comparison of the results reported for the 1189 benchmark (in percentage %)
References Method All-a All-b a/b a+b Overall
[8] Bayes Classifier 54.8 57.1 75.2 22.2 53.8 [45] Logistic Regression 57.0 62.9 64.7 25.3 53.9 [56] FKNN 48.9 59.5 81.7 26.6 56.9 [57] WSVM - - - - 59.2 [53] Specific Tri-peptides - - - - 59.9 [21] IB1 65.3 67.7 79.9 40.7 64.7 [38] AAD-CGR 62.3 67.7 66.5 63.1 65.2 [58] SVM 75.8 75.2 82.6 31.8 67.6 [54] AATP 72.7 85.4 82.9 42.7 72.6 [16] AADP-PSSM 69.1 83.7 85.6 35.7 70.7 [55] SCPRED 89.1 86.7 89.6 53.8 80.6 [24] RKS-PPSC 89.2 86.7 82.6 65.6 81.3 [27] MODAS 92.3 87.1 87.9 65.4 83.5 [26] AAC-PSSM-AC 80.7 86.4 81.4 45.2 74.6 [22] Physicochemical-based features 80.2 83.6 85.4 44.6 74.8 [5] Structural-based features 92.4 87.4 82.0 71.0 83.2 [6] Structural-based features 93.7 84.0 83.5 66.4 82.0 This Study PSSM-S 92.6 86.0 76.7 64.3 79.7
This Study SPINE-S 91.9 88.3 78.9 61.7 80.3
This Study PSSM-SPINE-S 98.2 91.5 83.8 72.2 86.3
Table 6 The specificity (in percentage) and MCC measurements for the best results: (a) for the 25PDB benchmark; (b) for the 1189 benchmark
Feature Vector Specificity (%) MCC
All-a All-b a/b a+b All-a All-b a/b a+b
(a) PSSM-S 97.7 96.3 95.2 91.9 0.93 0.80 0.78 0.91 SPINE-S 97.8 94.0 94.4 90.5 0.89 0.80 0.75 0.61 PSSM-SPINE-S 98.9 97.7 96.7 96.4 0.94 0.89 0.86 0.87 (b) PSSM-S 98.2 94.8 89.8 90.0 0.91 0.78 0.67 0.56 SPINE-S 97.9 95.8 90.7 89.2 0.86 0.85 0.70 0.51 PSSM-SPINE-S 99.5 96.8 92.9 92.2 0.95 0.88 0.77 0.66
Declarations
Publication of this article funded by Griffith University and National ICT Australia (NICTA).
Authors’details
1Institute for Integrated and Intelligent Systems (IIIS), Griffith University,
Kessels Road, Brisbane, Australia.2National ICT Australia (NICTA), Kessels Road,
Brisbane, Australia.3School of Engineering, Griffith University, Kessels Road, Brisbane, Australia.4School of Engineering, The University of the South
Pacific, Suva, Fiji, Fiji. Published: 24 January 2014
References
1. Chothia C:The nature of the accessible and buried surfaces in proteins. Journal of Molecular Biology1976,105(1):1-12.
2. Chou KC:Using amphiphilic pseudo amino acid composition to predict enzyme subfamily classes.Bioinformatics2005,21(1):10-19.
3. Chou KC, Zhang CT:Prediction of protein structural classes.Critical Reviews in Biochemistry and Molecular Biology1995,30:275-349. 4. Chou KC:Some remarks on protein attribute prediction and pseudo
amino acid composition.Journal of Theoretical Biology2011, 273(1):236-247.
5. Zhang S, Ding S, Wang T:High-accuracy prediction of protein structural class for low-similarity sequences based on predicted secondary structure.Biochimie2011,93(4):710-714.
6. Ding S, Zhang S, Li Y, Wang T:A novel protein structural classes prediction method based on predicted secondary structure.Biochimie 2012,94(5):1166-1171.
7. Li ZC, Zhou XB, Dai Z, Zou XY:Prediction of protein structural classes by chou’s pseudo amino acid composition: approached using continuous wavelet transform and principal component analysis.Amino Acids2009, 37:415-425.
8. Wang ZX, Yuan Z:How good is prediction of protein structural class by the component-coupled method?Proteins: Structure, Function, and Bioinformatics2000,38(2):165-175.
9. Cai YD, Feng K, Lu W, Chou K:Using logitboost classifier to predict protein structural classes.Theoretical Biollogy2006,238:172-176. 10. Feng KY, Cai YD, Chou KC:Boosting classifier for predicting protein
domain structural class.Biochemical and Biophysical Research Communications2005,334(1):213-217.
11. Niu B, Cai YD, Lu WC, Li GZ, Chou KC:Predicting protein structural class with adaboost learner.Protein and Peptide Letters2006,13(5):489-492. 12. Dehzangi A, Karamizadeh S:Solving protein fold prediction problem
using fusion of heterogeneous classifiers.INFORMATION, An International Interdisciplinary Journal2011,14(11):3611-3622.
13. Dehzangi A, Phon-Amnuaisuk S, Manafi M, Safa S:Using rotation forest for protein fold prediction problem: An empirical study.Evolutionary Computation, Machine Learning and Data Mining in Bioinformatics2010, 217-227.
14. Anand A, Pugalenthi G, Suganthan PN:Predicting protein structural class by svm with class-wise optimized features and decision probabilities. Journal of Theoretical Biology2008,253(2):375-380.
15. Li ZC, Zhou XB, Lin YR, Zou XY:Prediction of protein structure class by coupling improved genetic algorithm and support vector machine. Amino Acids2008,35(3):581-590.
16. Liu T, Zheng X, Wang J:Prediction of protein structural class for low-similarity sequences using support vector machine and psi-blast profile. Biochimie2010,92(10):1330-1334.
17. Dehzangi A, Sattar A:Protein fold recognition using segmentation-based feature extraction model.Proceedings of the 5th Asian Conference on Intelligent Information and Database SystemsACIIDS05 Springer ???; 2013, 345-354.
18. Cai YD, Zhou GP:Prediction of protein structural classes by neural network.Biochimie2000,82(8):783-785.
19. Jahandideh S, Abdolmaleki P, Jahandideh M, Asadabadi EB:Novel two-stage hybrid neural discriminant model for predicting proteins structural classes.Biophysical Chemistry2007,128(1):87-93.
20. Jahandideh S, Abdolmaleki P, Jahandideh M, Hayatshahi SHS:Novel hybrid method for the evaluation of parameters contributing in determination
of protein structural classes.Journal of Theoretical Biology2007, 244(2):275-281.
21. Chen K, Kurgan LA, Ruan J:Prediction of protein structural class using novel evolutionary collocation-based sequence representation.Journal of Computational Chemistry2008,29(10):1596-1604.
22. Dehzangi A, Paliwal KK, Sharma A, Dehzangi O, Sattar A:A combination of feature extraction methods with an ensemble of different classifiers for protein structural class prediction problem.IEEE Transaction on Computational Biology and Bioinformatics (TCBB)2013.
23. Kedarisetti KD, Kurgan LA, Dick S:Classifier ensembles for protein structural class prediction with varying homology.Biochemical and Biophysical Research Communications2006,348(3):981-988.
24. Yang JY, Peng ZL, Chen X:Prediction of protein structural classes for low-homology sequences based on predicted secondary structure.BMC Bioinformatics2010,11(Suppl 1):9.
25. Dehzangi A, Phon-Amnuaisuk S, Dehzangi O:Enhancing protein fold prediction accuracy by using ensemble of different classifiers.Australian Journal of Intelligent Information Processing Systems2010,26(4):32-40. 26. Liu T, Geng X, Zheng X, Li R, Wang J:Accurate prediction of protein
structural class using auto covariance transformation of psi-blast profiles.Amino Acids2012,42:2243-2249.
27. Mizianty M, Kurgan LA:Modular prediction of protein structural classes from sequences of twilight-zone identity with predicting sequences. BMC Bioinformatics2009,10(1):414.
28. Cai YD, Liu XJ, Xu XB, Zhou GP:Support vector machines for predicting protein structural class.BMC Bioinformatics2001,2(1):3.
29. Deschavanne P, Tuffery P:Exploring an alignment free approach for protein classification and structural class prediction.Biochimie2008, 90(4):615-625.
30. Zhou GP:An intriguing controversy over protein structural class prediction.Journal of Protein Chemistry1998,17:729-738. 31. Chou KC:Prediction of protein structural classes and subcellular
locations.Current Protein and Peptide Science2000,1:171-208.
32. Ding YS, Zhang TL, Chou KC:Prediction of protein structure classes with pseudo amino acid composition and fuzzy support vector machine network.Protein and Peptide Letters2007,14(8):811-815.
33. Kurgan LA, Chen K:Prediction of protein structural class for the twilight zone sequences.Biochemical and Biophysical Research Communications 2007,357(2):453-460.
34. Cao YF, Liu S, Zhang L, Qin J, Wang J, Tang K:Prediction of protein structural class with rough sets.BMC Bioinformatics2006,7(1):20. 35. Sharma A, Paliwal KK, Dehzangi A, Lyons J, Imoto S, Miyano S:A strategy
to select suitable physicochemical attributes of amino acids for protein fold recognition.BMC Bioinformatics2013,14(233):11.
36. Dehzangi A, Phon-Amnuaisuk S:Fold prediction problem: The application of new physical and physicochemical-based features.Protein and Peptide Letters2011,18(2):174-185.
37. Kurgan LA, Zhang T, Zhang H, Shen S, Ruan J:Secondary structure-based assignment of the protein structural classes.Amino Acids2008, 35:551-564.
38. Yang JY, Peng ZL, Yu ZG, Zhang RJ, Anh V, Wang D:Prediction of protein structural classes by recurrence quantification analysis based on chaos game representation.Journal of Theoretical Biology2009,257(4):618-626. 39. Dehzangi A, Paliwal KK, Lyons J, Sharma A, Sattar A:Enhancing protein
fold prediction accuracy using evolutionary and structural features. Proceeding of the Eighth IAPR International Conference on Pattern Recognition in Bioinformatics. PRIB2013, 196-207.
40. Dehzangi A, Paliwal KK, Lyons J, Sharma A, Sattar A:Exploring potential discriminatory information embedded in pssm to enhance protein structural class prediction accuracy.Proceeding of the Eighth IAPR International Conference on Pattern Recognition in Bioinformatics. PRIB2013, 208-219.
41. Altschul SF, Madden TL, Schaffer AA, Zhang JH, Zhang Z, Miller W, Lipman DJ:Gapped blast and psi-blast: a new generation of protein database search programs.Nucleic Acids Research1997,17:3389-3402. 42. Jones DT:Protein secondary structure prediction based on
position-specific scoring matrices.Journal of Molecular Biology1999,292(2):195-202. 43. Shen HB, Song JN, Chou KC:Prediction of protein folding rates from
primary sequence by fusing multiple sequential features.Biomedical Science and Engineering2009,2:136-143.
44. Faraggi E, Zhang T, Yang Y, Kurgan L, Zhou Y:Spine x: Improving protein secondary structure prediction by multistep learning coupled with prediction of solvent accessible surface area and backbone torsion angles.Journal of Computational Chemistry2012,33(3):259-267. 45. Kurgan LA, Homaeian L:Prediction of structural classes for protein
sequences and domains - impact of prediction algorithms, sequence representation and homology, and test procedures on accuracy.Pattern Recognition2006,39:2323-2343.
46. Berman HM, Westbrook J, Feng Z, Gilliland G, Bhat TN, Weissig H, Shindyalov IN, Bourne PE:The protein data bank.Nucleic Acids Research 2000,28(1):235-242.
47. Murzin AG, Brenner SE, Hubbard T, Chothia C:Scop: A structural classification of proteins database for the investigation of sequences and structures.Journal of Molecular Biology1995,247(4):536-540. 48. Liu T, Jia C:A high-accuracy protein structural class prediction algorithm
using predicted secondary structural information.Journal of Theoretical Biology2010,267(3):272-275.
49. Sharma A, Lyons J, Dehzangi A, Paliwal KK:A feature extraction technique using bi-gram probabilities of position specific scoring matrix for protein fold recognition.Journal of Theoretical Biology2013,320(0):41-46. 50. Chou KC:Progress in protein structural class prediction and its impact to
bioinformatics and proteomics.Current Protein and Peptide Science2005, 6:423-436.
51. Vapnik VN:The Nature of Statistical Learning Theory.Springer, ???; 1995. 52. Chang CC, Lin CJ:Libsvm: a library for support vector machines2001. 53. Costantini S, Facchiano AM:Prediction of the protein structural class by
specific peptide frequencies.Biochimie2009,91(2):226-229.
54. Zhang S, Ye F, Yuan X:Using principal component analysis and support vector machine to predict protein structural class for low-similarity sequences via pssm.Journal of Biomolecular Structure and Dynamics2012, 29(6):1138-1146.
55. Kurgan LA, Cios KJ, Chen K:Scpred: Accurate prediction of protein structural class for sequences of twilight-zone similarity with predicting sequences.BMC Bioinformatics2008,9:226.
56. Zhang TL, Ding YS, Chou KC:Prediction protein structural classes with pseudo amino acid composition: approximate entropy and hydrophobicity pattern.Theoretical Biology2008,250:186-193. 57. Qiu JD, Luo SH, Huang JH, Liang RP:Using support vector machines for
prediction of protein structural classes based on discrete wavelet transform.Journal of Computational Chemistry2009,30(8):1344-1350. 58. Chen C, Zhou X, Tian Y, Zou X, Cai P:Predicting protein structural class
with pseudo-amino acid composition and support vector machine fusion network.Analytical Biochemistry2006,357(1):116-121. doi:10.1186/1471-2164-15-S1-S2
Cite this article as:Dehzangiet al.:Proposing a highly accurate protein
structural class predictor using segmentation-based features.BMC
Genomics201415(Suppl 1):S2.
Submit your next manuscript to BioMed Central and take full advantage of:
• Convenient online submission • Thorough peer review
• No space constraints or color figure charges • Immediate publication on acceptance
• Inclusion in PubMed, CAS, Scopus and Google Scholar • Research which is freely available for redistribution
Submit your manuscript at www.biomedcentral.com/submit