Singing speaker clustering based on subspace learning
in the GMM mean supervector space
Mahnoosh Mehrabani, John H.L. Hansen
⇑Center for Robust Speech Systems (CRSS), Erik Jonsson School of Engineering & Computer Science, University of Texas at Dallas, USA
Received 20 May 2012; received in revised form 3 October 2012; accepted 8 November 2012 Available online 11 February 2013
Abstract
In this study, we propose algorithms based on subspace learning in the GMM mean supervector space to improve performance of speaker clustering with speech from both reading and singing. As a speaking style, singing introduces changes in the time-frequency structure of a speaker’s voice. The purpose of this study is to introduce advancements for speech systems such as speech indexing and retrieval which improve robustness to intrinsic variations in speech production. Speaker clustering techniques such as k-means and hierarchical are explored for analysis of acoustic space differences of a corpus consisting of reading and singing of lyrics for each speaker. Furthermore, a distance based on fuzzy c-means membership degrees is proposed to more accurately measure clustering diffi-culty or speaker confusability. Two categories of subspace learning methods are studied: unsupervised based on LPP, and supervised based on PLDA. Our proposed clustering method based on PLDA is a two stage algorithm: where first, initial clusters are obtained using full dimension supervectors, and next, each cluster is refined in a PLDA subspace resulting in a more speaker dependent representation that is less sensitive to speaking style. It is shown that LPP improves average clustering accuracy by 5.1% absolute versus a hierarchical baseline for a mixture of reading and singing, and PLDA based clustering increases accuracy by 9.6% absolute versus a k-means baseline. The advancements offer novel techniques to improve model formulation for speech applications including speaker ID, audio search, and audio content analysis.
Ó2012 Elsevier B.V.
Keywords: Speaker clustering; Singing; Speaking styles; Subspace learning
1. Introduction
Speaker clustering is the task of identifying all segments from the same speaker in a set of speech segments, and can be considered to be a special form of unsupervised speaker recognition (Makhoul et al., 2000). The goal of this study is to introduce advancements into speech systems which improve robustness to intrinsic variations in speech pro-duction. As a first attempt to advance speaker clustering with alternative speaking styles for each speaker, this study has scientific value by distinguishing speaker dependent subspaces that are less sensitive to changes in speaking
style, as well as contributing to audio indexing and retrieval applications.
Most studies regarding robustness for speaker recogni-tion systems have focused on the impact of extrinsic varia-tions such as noise and channel, while only a few have explored the effects of intrinsic variations in spoken data for speaker recognition systems (Hansen et al., 2000;
Shri-berg et al., 2008; Hansen and Varadarajan, 2009). As
men-tioned, speaker clustering is a type of unsupervised speaker recognition, which does not require training data. Speaker clustering systems can be viewed as a preprocessing stage, in order to provide training data for new speech systems such as speech and speaker recognition by grouping unla-beled speech data. Furthermore, with an increasing number of sources to obtain speech data such as the internet, tele-vision, radio, meetings, voice mails, etc., as well as virtually 0167-6393Ó2012 Elsevier B.V.
http://dx.doi.org/10.1016/j.specom.2012.11.001
⇑ Corresponding author.
E-mail addresses:[email protected](M. Mehrabani),john. [email protected](J.H.L. Hansen).
www.elsevier.com/locate/specom
Speech Communication 55 (2013) 653–666
Open access under CC BY-NC-ND license.
unlimited data storage capabilities, audio indexing and retrieval is attracting more attention with increased demands on effective speech and audio search applications. Speech segments obtained from any of these sources are more likely to be unlabeled, and carry unknown informa-tion including: who is speaking?, what is the topic?, what is the environment?
Speaker diarization (Tranter and Reynolds, 2006;
Wooters and Huijbregts, 2008; Reynolds et al., 2009) which
basically addresses the question of”who spoke when?”is a combination of speaker segmentation and clustering. Although it is possible to perform these two tasks jointly, most speaker diarization systems perform speaker segmen-tation and clustering separately (Tranter and Reynolds, 2006). While the present study focuses on speaker cluster-ing, the techniques developed here can be applied to speaker diarization. For speaker diarization systems, it is important to group all speech segments from the same speaker, even though the speaker may not speak in the same manner. In other words, in a public presentation or person to person conversation, the speaker may change her/his speaking style, such as getting excited (Wu et al., 2006), whispering (Fan and Hansen, 2008), increased stress
(Hansen, 1996), etc. All these speaking styles are due to
intrinsic changes in speech production, and will affect speaker clustering systems. Multi-style training was devel-oped byLippmann et al. (1987)to improve speech recogni-tion when subjects vary producrecogni-tion. Bou-Ghazale and
Hansen (1998)explored ways to model training data under
specific speaking styles (loud, angry, Lombard effect) to improve speech recognition for new speakers with only neutral training data.
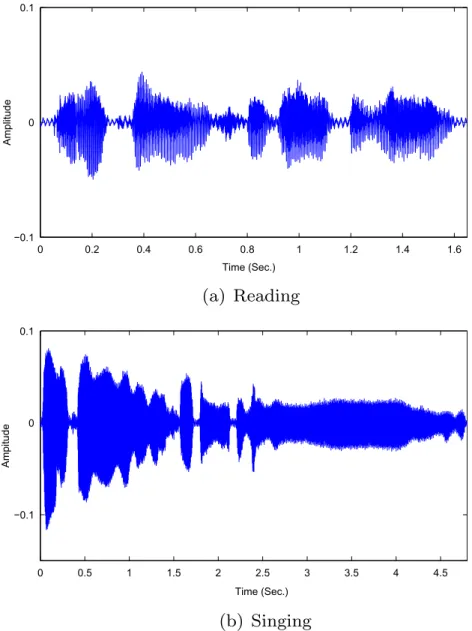
Singing is a good example of speaking style which has not been considered in order to address robustness of speaker clustering systems. Due to the inherent deviation of singing speech production versus spoken text, time-fre-quency structure of a speaker’s voice changes while singing.
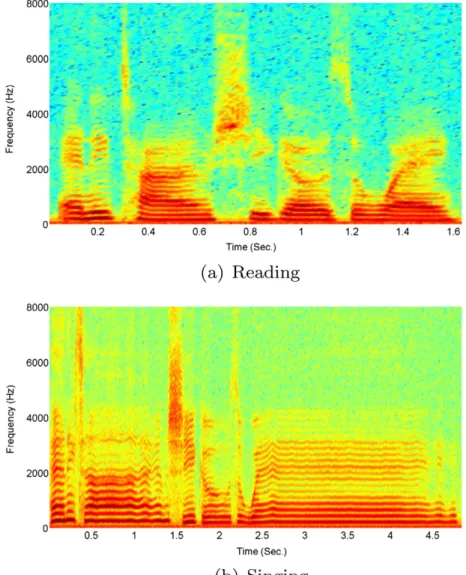
Fig. 1 and Fig. 2 depict examples of speech signals and
spectrograms, respectively, in order to compare reading and singing, where the same speaker reads and sings the same text. As will be shown in the next section, from speak-ing to sspeak-ingspeak-ing, there is a shift towards higher vocal efforts which is similar to loud and excited speech. In addition, as a speaking style, singing data is easier to collect in a Karaoke style, while for collecting other speaking styles, speakers will have to spontaneously produce excitement or anger, which takes on perhaps non natural traits (i.e., exaggerated).
For the above reasons, the results from studying and improving robustness of speaker clustering for singing, can be applied to a variety of speaking styles. Furthermore, speaker clustering for singing has applications in music information retrieval. Popular music is becoming one of the most dominant data types on the internet, and there-fore singer based clustering of unlabeled music recordings has attracted more attention. Tsai et al. (2004) proposed a system to cluster recordings on the basis of a singer’s
voice. In this study, we consider a more challenging task by mixing reading and singing samples of the same speak-ers. In other words, we assume that we do not have infor-mation regarding speaking style (reading or singing) while performing speaker clustering. This can be applied to speaker diarization systems for audio where both speaking and singing samples are present from one or more speak-ers. Many instances of such audio streams are available on the internet, radio, or TV, from interviews or talk shows with popular singers. There is also an increasing interest in singing competitions which include auditions with speaking and singing speech samples of the participants.
Our speaker clustering system is based on modeling each speech segment in the GMM mean supervector space. Tra-ditional speaker clustering techniques are based on statisti-cal modeling of low level acoustic features such as Mel Frequency Cepstral Coefficients (MFCC) (Rabiner and
Juang, 1993) for each speech segment. The statistical
mod-els typically used in speaker clustering are Gaussian Mix-ture Models (GMM) (Reynolds, 1995). The GMMs are usually obtained by Maximum A Posterior (MAP) adapta-tion (Reynolds et al., 2000) of a Universal Background Model (UBM), previously trained on a considerable amount of speech data, to each utterance or speech seg-ment. Next, a similarity measure is used to compare the obtained statistical models for the purpose of clustering
(Solomonoff et al., 1998; Ben et al., 2004). Recent studies
in speaker recognition and verification have illustrated the benefit of a speaker representation known as the GMM mean supervector which is formed by stacking the means of the GMM model (Campbell et al., 2006). Speaker GMM mean supervectors have also proven to be successful in modeling speakers for speaker clustering (Faltlhauser and Ruske, 2001; Tsai et al., 2005; Chu et al., 2009a; Chu et al., 2009b).
This study is focused on unsupervised and supervised subspace learning methods to improve speaker clustering performance for singing and a mixture of reading and
sing-ing.Fig. 3represents the flow diagram of speaker clustering
approaches in this study. Our investigation is based on a singing corpus we collected, in which each speaker reads and sings the lyrics of selected songs. In order to concen-trate on vocal changes, and to eliminate effects of back-ground music, only the singing voice of the speakers are recorded while singers are listening to the music. Section2
describes the singing database. In Section3 and 4, unsuper-vised dimensionality reduction techniques, namely Princi-pal Component Analysis (PCA) and Locality Preserving Projections (LPP) are explored and compared to baselines for speaker clustering for reading, singing, and a mixture of reading and singing. It is shown that LPP significantly improves performance for a mixture of reading and sing-ing. In addition, a novel similarity measure based on fuzzy c-means membership scores is proposed in Section4which estimates the degree of clustering difficulty or confusability between a pair of speakers. Section5explains our proposed clustering method based on supervised subspace learning,
namely Probabilistic Linear Discriminant Analysis (PLDA). The proposed method consists of two stages. First, initial speaker clusters are built without considering the effects of speaking styles. Next, each cluster is refined in a sub-space of the supervectors based on PLDA. Results of the proposed clustering technique is compared to baselines and shown to improve the average clustering accuracy by approximately 69%. A probe experiment is also pre-sented to show the effect of adding background music to the singing on speaker clustering. Finally, conclusions are drawn in Section6.
2. Database
Our experiments are based on a new database (UT-Sing) which includes singing and reading speech samples for each speaker. We collected UT-Sing for the purpose of compar-ing scompar-ingcompar-ing to readcompar-ing speech, as well as analyzcompar-ing the effects of singing on various speech systems. UT-Sing was
collected in four languages: American English, Farsi, Hindi, and Mandarin. In the present study, the focus is on the English portion of the database based on the increased number of speakers for this language. We have recorded 33 subjects including 18 females and 15 males whose native language was English.
UT-Sing consists of two components: singing and read-ing. Each speaker selected 5 popular songs in their native language. Each song was approximately 3-5 minutes. We tried to have a variety of song styles, including pop, rock, and country. Though we had a list of suggested songs, we also let each subject select their songs even if it was not on the list, so they would be familiar with the songs they were singing, and could follow the melody.
Next, the speaker’s voice was recorded in a soundbooth with a close-talk microphone while singing as well as read-ing the lyrics of the same songs. The sread-ingread-ing was collected using Karaoke system prompts. While subjects were listen-ing to the music through headphones, the lyrics were
dis-0 0.2 0.4 0.6 0.8 1 1.2 1.4 1.6 −0.1 0 0.1 Time (Sec.) Amplitude 0 0.5 1 1.5 2 2.5 3 3.5 4 4.5 −0.1 0 Time (Sec.) Ampitude 0.1
played, and only the subject’s singing voice was recorded. Recording the singing voice without the background music, lets us concentrate only on the vocal changes in singing compared to reading. Another unique advantage of this database is that singing and reading voices of the same speakers have been collected with the same text for each speaker. Therefore, the only factor that changes is the speaking style which is singing.
In order to illustrate the vocal effort variation from reading to singing, we used another corpus (UT-VocalEf-fort I) (Zhang and Hansen, 2007; Zhang and Hansen, 2011) , consisting of independent subjects. Vocal effort is a variation in a speaker’s voice due to either speaker-lis-tener distance, or due to relative background noise levels, or sensitivity of text content. UT-VocalEffort includes 12 native English speaking males, each reading 20 TIMIT sen-tences with five vocal efforts: whispered, soft, neutral, loud, and shouted. Each vocal effort was modeled using 19 dimensional MFCCs and 64 mixture GMMs. Utterances in UT-Sing corpus were first silence removed using an energy threshold, and then each reading or singing speech
Fig. 2. Spectrograms of reading and singing speech for“Any time she goes away”.
Map Feature UBM Map Adaptation Feature Extraction Speech Segment GMM Supervector (Si) S1 … DimensionalityUnsupervised Reduction … ^ S1 u stering Speaker 1 Segments SN Reduction PCA / LPP S^ N Cl u Speaker 2 Segments S1 Supervised Dimensionality ^ S1 e ring Speaker 1 Segments SN … Dimensionality Reduction PLDA … ^ SN Clust e Speaker 2 Segments PLDA Model
Fig. 3. Flow diagram of clustering approaches based on subspace learning in the GMM mean suprevector space.
frame with the duration of 20 msec., and skip rate of 10 msec., was classified as one of the 5 vocal efforts using max-imum likelihood classification. Since the vocal effort corpus was collected for male speakers, the vocal effort classifica-tion here is based on reading and singing data from English male speakers. Fig. 4 presents the results of vocal effort classification for reading and singing.
Comparing the two histograms shows the speech pro-duction differences between reading and singing. For sing-ing speech frames there is a shift towards higher vocal efforts with 31.3% of frames classified as loud and shouted (i.e., some subjects were enthusiastic when singing their selected songs). This confirms a fundamental shift in the manner of speech production between reading and singing, which is more than a simple overall gain term.
3. Speaker clustering using unsupervised subspace learning in GMM mean supervector space
3.1. Baseline: no dimensionality reduction
Our baseline system is based on modeling each utterance or speech segment in the GMM mean supervector space, fol-lowed by clustering the obtained high dimensional supervec-tors in which each cluster represents a speaker. GMM mean supervectors have proven to be effective speaker representa-tions in speaker verification (Campbell et al., 2006; Kuhn et al., 2000as well as speaker clustering (Tang et al., 2009; Tang et al., 2012; Chu et al., 2009a; Chu et al., 2009b).
Our speaker clustering approach includes: preprocessing, feature extraction, model adaptation, and finally clustering of supervectors. In preprocessing, silence removal is per-formed for each utterance based on an energy threshold. Next, acoustic features, namely Mel Frequency Cepstral Coefficients (MFCC) are extracted from each utterance. A speaker-independent UBM is trained over all utterances and all speakers of a separate data set. In model adaptation stage, the pretrained UBM is MAP adapted to each speech segment to obtain a GMM on a per speech segment basis.
Next, mean vectors for the obtained GMMs are stacked to build a supervector per each speech segment. Assuming that d-dimensional MFCCs are extracted from each speech seg-ment and modeled by a GMM with M mixtures:
p xð jkÞ ¼X M i¼1 wigðxjli;RiÞ ð1Þ wherek¼ wi;li; P i
;i¼1;. . .;M is the Gassian Mixture Model, and g xð jli;RiÞ represents a d-variate Gaussian
probability density function, with mean vector li and covariance matrixPi, andwi’s are the mixture weights that
satisfy the constraint:PMi¼1wi¼1, the GMM mean
super-vector representing the speech segment is a super-vector with dimension:Md: lT 1;. . .;l T M T ð2Þ
Finally, the GMM mean supervectors are clustered using two traditional techniques: k-means and hierarchical. K-means clustering partitions the data into a predefined number of clusters, defining k centroids: one for each clus-ter, and each data point is associated to the nearest cen-troid. The following objective function is minimized in order to calculate the centroids:
Xk i¼1 Xn j¼1 xjci 2 ð3Þ where xjci 2
is a chosen distance measure between a data pointxjand the cluster centroidci. In this study Euclidean
distance is used for k-means clustering. Hierarchical cluster-ing is a clustercluster-ing method that builds a hierarchy of the data partitions. Hierarchical clustering algorithms are either top-down or bottom-up. Bottom-up hierarchical clustering or hierarchical agglomerative clustering starts with each data point being a cluster and subsequently links the closest clus-ters together based on a similarity measure until a stopping criterion is satisfied. Various objective functions can be ap-plied as linkage criteria to merge the clusters. In this study, we used Ward’s linkage method (Ward Jr, 1963). Ward’s minimum variance criterion minimizes the total within-clus-ter variance. The initial cluswithin-clus-ter distances in Ward’s minimum variance method are defined to be the squared Euclidean dis-tance between points.
Despite the fact that GMM mean supervectors effectively model speakers, in cluster analysis and pattern recognition tasks, they are burdened with ”curse of dimensionality”. Next, we employ unsupervised dimensionality reduction algorithms to perform the clustering in a subspace of the data set with lower dimensionality.
3.2. Locality Preserving Projections
Locality Preserving Projections (LPP) (He and Niyogi, 2003) is a linear unsupervised dimensionality reduction technique that optimally preserves the local neighborhood structure of the data. LPP is an alternative to Principal
60 Reading Singing 46.4 50 34.7 40 29.2 29.3 30 18.9 12 4 20 8.8 11 4.6 4.7 12.4 10 Classification Percentage (%) 0
Whispered Soft Neutral Loud Shouted
Fig. 4. Vocal effort classification for reading (left bars) and singing (right bars) speech frames.
Component Analysis (PCA), a classical linear unsupervised dimensionality reduction that projects the data along the directions with maximal variances. The observations in a high dimensional space, usually lie on a low dimensional manifold, and LPP and PCA seek the linearly embedded manifold in the data set. While PCA aims to preserve the global structure of the data set, LPP preserves the local structure. LPP has proven to perform better than PCA in face recognition applications (He et al., 2005). It has also been shown to be successful in speaker clustering (Chu et al., 2009b).
Given a set of n-dimensional data points:x1;. . .;xm, a
lin-ear dimensionality reduction algorithm finds a transforma-tion matrixAwhich maps these m data points to a set of vectors in an l-dimensional subspace: y1;. . .;ym such that
ln and yi¼ATxi;i¼1;. . .;m. LPP is in fact a linear
approximation of nonlinear manifold learning technique: Laplacian Eigenmap (Belkin and Niyogi, 2002). The LPP subspace learning algorithm first constructs an adjacency graphGwithmnodes, where each node represents a data point. Two nodesiandjare connected if the corresponding data pointsxiandxjare”close”. The concept of”closeness”
of two data points is defined either in the sense of k nearest neighbor (i.e.,iandjare connected ifxiis among k nearest
neighbors ofxjand vice versa), or in the sense ofe
-neighbor-hood (i.e.,iand jare connected if xixj
2
<e). Next, a weight is associated with each edge or each two connected nodes. The common weight function is the Heat Kernel:
Wij¼e
xixj
k k2
t ð4Þ
whereWis the weight matrix. Finally, the following objec-tive function is minimized:
X
ij
ðyiyjÞ2Wij ð5Þ
Simple algebraic formulation (He and Niyogi, 2003) reduces the objective function to:
XLXTa¼kXDXTa ð6Þ
whereX¼ ½x1. . .xmis annmmatrix of data vectors,Dis
a diagonal matrix such that:Dii¼
P
jWij, andL¼DW
is the Laplacian matrix. Eq.(6)is a generalized eigenvalue problem, and the solutionsa1;. . .;al which are the
eigen-vectors ordered based on their corresponding eigenvalues are columns of annlmatrix A such that:
yi¼ATx
i;A¼ ½a1;. . .;al: ð7Þ
We have applied both PCA and LPP to reduce the dimensionality in the supervector space. First, the dimen-sionality of supervectors which present test speech seg-ments is reduced using PCA or LPP. Next, clustering is performed in the obtained subspace. The results are pre-sented in the next section, and compared to the baseline with no dimensionality reduction. As it will be shown PCA renders approximately the same results as the
baseline, while LPP improves the results. This suggests that local manifold structure is more important than global Euclidean structure.
4. Results and analysis
4.1. Experimental results
The results of speaker clustering for two types of speak-ing styles are presented here: readspeak-ing and sspeak-ingspeak-ing. In addi-tion, we present results for a mixture of these speaking styles, seeking a subspace in the mean supervector space that is speaker dependent but is not sensitive to the changes in speaking style. Speaker clustering is performed on 10 sec. speech segments. The UT-Sing corpus includes 5 read-ing and 5 sread-ingread-ing utterances for each speaker in which each reading utterance is approximately 1 min., and each singing utterance 2 min. after silence removal. Therefore, on the average there are 30 reading segments and 60 singing seg-ments per speaker. We divided our data set into two sets: train and test. As will be explained later, the train set will be used to train our PLDA model. All clustering experi-ments are performed on the same test set, in order to have a reliable comparison between the results. The train set includes 15 speakers: 8 females and 7 males, and the test set includes 18 separate speakers: 10 females and 8 males. 19-dimensional MFCCs were extracted from each utter-ance using a 20 msec. window at 10 msec. intervals. We trained our UBM on all the TIMIT data with 64 mixtures, and MAP adapted the UBM to each reading or singing 10 sec. segment. MAP adaptation was performed only on the UBM means. Next, the mean vectors for each adapted UBM were concatenated to obtain a mean supervector of the dimension 6419¼1216 to represent each speech seg-ment. In this study, we assume no prior knowledge about speaking style which makes the clustering very challenging. Therefore, to focus on the speaking style and make the interpretation of the results less complicated, the number of speaker clusters is considered to be known. In addition, in order to analyze and compare the confusion between any two speakers with a change in the speaking style, all the reported accuracies are for two-speaker clustering. How-ever, the proposed speaker clustering algorithms can be expanded for more speakers, and even to the point of unknown number of speakers. For each two speaker set in the test space, all speech segments are mixed and then clustered. We present three clustering accuracies: first, when only the reading segments of the speakers are clus-tered; second, when the singing segments are clusclus-tered; and third, when all speech segments including reading and singing are mixed and then clustered. The clustering accuracy for each two speakers is the number of correctly clustered segments divided by the total number of seg-ments. The clustering is performed for all unique pairs of speakers in the test set, which represents 18
2
in our experiments and the reported clustering accuracy is the mean of all accuracies. (Chu et al., 2009a; Chu et al.,
2009b) have also used average clustering accuracies to
eval-uate clustering techniques.
First row ofTable 1shows the speaker clustering results with the baseline system for reading, singing, and a mixture of reading and singing with two traditional clustering tech-niques: k-means and hierarchical. The baseline clustering system renders almost perfect results for reading, and more than 90% clustering accuracy for singing. However, speaker clustering for a mixture of reading and singing seg-ments represents the most challenging task with an approx-imate 20% loss in clustering accuracy compared to a reading baseline.
Second and third rows inTable 1present the clustering results with PCA and LPP, respectively, when the dimen-sion is reduced to only 2 dimendimen-sions for clustering. As shown in the tables PCA subspace learning prior to speaker clustering renders approximately similar performance to the baseline system, while LPP subspace learning improves the clustering accuracies up to 2.1% for singing versus the k-means baseline, and 5.1% for a mixture of reading and singing versus the hierarchical baseline. As previously noted, LPP preserves the local manifold structure of the data, while PCA preserves the global structure. Therefore, LPP especially works better with nearest neighbor like clas-sifiers, and has discriminating power even though it is unsupervised (He et al., 2005). Since clustering algorithms such as k-means and hierarchical are based on a distance measure between data points and clustering the closest vec-tors, LPP is a suitable subspace learning technique for speaker clustering. The results show that LPP increases clustering accuracy more when there are both reading and singing speech samples for each speaker. In our exper-iments, the best results were achieved when using 3 nearest neighbors to build the adjacency graph for LPP, with a cosine distance as the distance measure. Increasing the reduced dimension from 2, would change the accuracies less than 1%. Next, we will analyze speaker clustering results in more detail.
4.2. Speaker similarity measure for clustering tasks based on fuzzy c-means
Speaker clustering accuracy is a viable measure to show clustering performance. However, it does not exactly show
the difficulty of a clustering task for a pair of speakers. In addition, perfect clustering scores for reading for a major-ity of speaker pairs, makes it difficult to compare reading and singing speaker clustering for two speakers. Therefore, we propose a similarity measure based on fuzzy c-means membership degrees, which estimates the clustering diffi-culty for a pair of speakers. Fuzzy c-means (Dunn, 1973;
Bezdek, 1981) is a clustering technique which allows a data
point to belong to more than one cluster. Its objective func-tion is similar to k-means with the difference that it also includes a membership degree:
Xk i¼1 Xn j¼1 um ij xjci 2 ð8Þ
where uij is the degree of membership, and 16m.
xjci
2
is a chosen distance measure between a data point xj and the cluster centroid ci, and k is the number
of clusters. Fuzzy c-means clustering assigns k numbers in the interval [0 1] to each data point which is the member-ship degree of that data point to each cluster. The points closer to the edge of a cluster will have lesser membership degrees than the points closer to the center. Based on this feature of fuzzy clustering, we will define a similarity mea-sure which shows the degree of confusion between speech segments from a pair of speakers, but first, we will compare the statistics of these membership degrees between reading and singing.
Previously we showed that the average speaker cluster-ing accuracy decreases when speakers were scluster-ingcluster-ing, and decreases even more when speakers were reading and sing-ing. In order to show the difficulty of the clustering task for singing, and mixture of reading and singing, compared to reading we performed a fuzzy c-means clustering on the same data. Our experiments show that fuzzy c-means two-speaker clustering in the GMM mean supervector space renders similar results to the k-means clustering. Data points with membership degrees more than 0.5 are considered to belong to the cluster. For the remainder of this section, all supervector dimensions are reduced to 2 using PCA to reduce the processing time. The fuzzy cluster-ing accuracies were 99.9%, 91.5%, 81.1% for readcluster-ing, scluster-ing- sing-ing, and mixture of reading and singsing-ing, respectively. Next, the membership degrees were compared for correctly clus-tered samples. Note that for each data point, there are two membership degrees for each of the two clusters which add
Table 1
Average clustering accuracies (%) for reading, singing, and a mixture of reading and singing with baseline system: no dimensionality reduction, PCA, and LPP subspace learning methods.
Subspace learning Clustering method Reading Singing Mixture
Baseline(Full dimension) K-means 99.7 91.3 80.6
Hierarchical 99.9 92.8 82.9
PCA K-means 99.6 91.3 80.5
Hierarchical 99.9 91.9 82.4
LPP K-means 99.5 93.4 84.7
up to 1. Since the clustering decision is made based on the membership degree that is greater than 0.5, in our analysis only membership degrees in the interval [0.5 1] are considered.
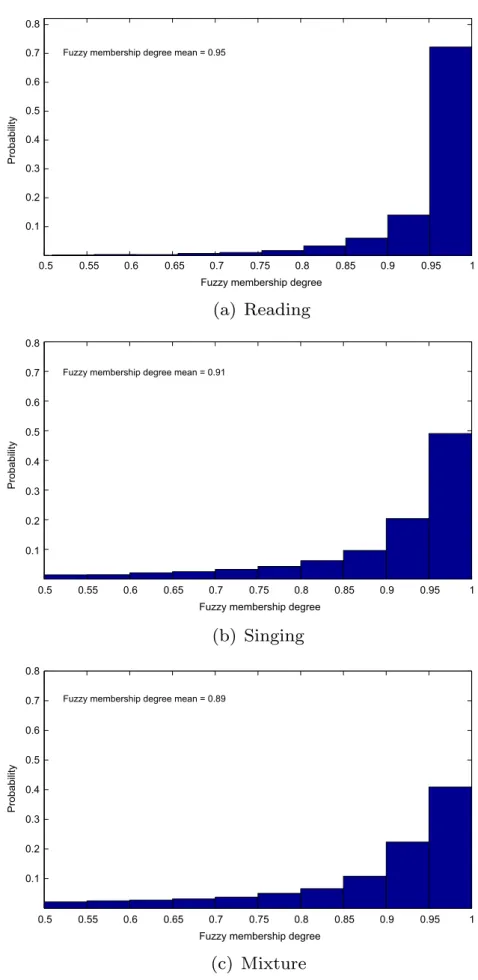
Fig. 5depicts the normalized histograms of the
member-ship degrees for correctly clustered segments for reading, singing, and a mixture of reading and singing. Data points closer to the edge of the cluster which are more likely to be confused with data points in the other cluster, have mem-bership degrees closer to 0.5. Data points closer to the cen-ter of the cluscen-ter which are classified with more confidence have membership degrees closer to 1. For reading, only 2.5% of data points which are accurately clustered have membership degrees less than 0.75. However, for singing, 10.6% of the data points which contribute to clustering accuracy, have membership degrees less than 0.75. This suggests that even though singing clustering accuracy decreases only by 99.9-91.5=8.4% compared to reading, 10.6% of the 91.5% accurately clustered segments are closer to the edge of the cluster than the center. For mixture of reading and singing, the percentage of membership degrees less than 0.75 increases to 14.3%. This analysis shows that in addition to a loss in clustering accuracies, the correctly clustered samples are more confusable and clustered with less confidence for singing and mixture of reading and sing-ing, compared to reading.
Next, for analysis purposes, a similarity measure is pro-posed based on fuzzy c-means membership degrees which shows the degree of clustering difficulty for a pair of speak-ers. Given two speakers, with a set of utterances or speech samples for each speaker, first, all the speech segments from both speakers are modeled by GMM mean supervec-tors as explained in Section 3. For the obtained set of supervectors, two cluster centroids are calculated based on fuzzy c-means objective function, and a degree of mem-bership to each cluster center is computed for each data point or supervector. The dimension of supervectors can be reduced previous to clustering using PCA. Next, data points are partitioned into two clusters such that a data point with cluster membership degree of more than 0.5 is considered to belong to that cluster. Since the ground truth for the clusters is known, correctly clustered and incor-rectly clustered supervectors are distinguished. The pro-posed fuzzy cluster distance is defined as:
XNc j¼1 uj XNi k¼1 uk ! =ðNcþNiÞ ð9Þ
whereNcandNirepresent the number of correctly and
incor-rectly clustered samples, respectively.uj;j¼1;. . .;Nc and
uk;k¼1;. . .;Ni are the fuzzy membership degrees of
cor-rectly and incorcor-rectly clustered samples, respectively. Note that only the membership degrees which are more than 0.5 are used in this equation, whereNcþNiis the total number
of data points. The proposed fuzzy cluster distance measure is in the interval [0 1]. The more the fuzzy cluster distance is, the less is the confusion between speech segments from the
corresponding speaker pair. The distance is 1 when all the data points are correctly clustered with confidence or mem-bership degree of 1. It should be noted that if the sum of the membership degrees for incorrectly clustered data points is more than the correctly clustered data points, simply switch-ing the clusters will result in a higher overall clusterswitch-ing accu-racy and higher fuzzy cluster distance. Therefore, the defined distance is greater than zero and the minimum distance is 0 instead of -1.Table 2shows the statistics of the fuzzy cluster distances between pairs of speakers for reading, singing, and a mixture of reading and singing. Fuzzy cluster distance gives us a more accurate estimation of clustering difficulty than average clustering accuracy. Compared to reading, average fuzzy clustering accuracy reduces by 8.4% absolute for singing and 18.8% for mixture, while average fuzzy clus-ter distance reduces by 18% absolute for singing and 36% for mixture.
Next, fuzzy cluster distances are compared between reading and singing for all speaker pairs. As mentioned, with 18 test speakers we have 153 unique speaker pairs. For each two speakers, fuzzy cluster distance is calculated using their reading speech segments. Fuzzy cluster distance is also calculated for the same speakers with their singing speech segments. This results in two 153-dimensional vec-tors of distances. The obtained correlation coefficient between the two vectors is 0.4. This correlation coefficient indicates how much the confusion between two speaker’s reading voices contributes to their confusion of singing voices.
5. Speaker clustering for a mixture of reading and singing based on supervised subspace learning
As was shown in Section4the most challenging speaker clustering task occurs when reading and singing speech samples of a speaker are mixed. In this case, the purpose is to cluster speech segments based on unique characteris-tics of a speaker’s voice regardless of their speaking style. In this section, a speaker clustering algorithm is proposed using the scores from a Probabilistic Linear Discriminant Analysis (PLDA) model which improves the speaker clus-tering performance for a mixture of reading and singing. PLDA is a supervised subspace learning method in that it assumes there exist some reading and singing data available for training. However, the training speaker set is indepen-dent from test set. In other words, PLDA model is trained on reading and singing samples of training speakers, and the model is used to cluster test speakers which were not present in training.
5.1. Probabilistic Linear Discriminant Analysis
Linear Discriminant Analysis (LDA) is a common method in pattern recognition using a linear combination of the features which best separate two or more classes. Fisher linear discriminant criterion, maximizes the between-class data separation while minimizing the within-between-class
0.5 0.55 0.6 0.65 0.7 0.75 0.8 0.85 0.9 0.95 1 0.1 0.2 0.3 0.4 0.5 0.6 0.7 0.8
Fuzzy membership degree
Probability
Fuzzy membership degree mean = 0.95
0.5 0.55 0.6 0.65 0.7 0.75 0.8 0.85 0.9 0.95 1 0.1 0.2 0.3 0.4 0.5 0.6 0.7 0.8
Fuzzy membership degree
Probability
Fuzzy membership degree mean = 0.91
0.5 0.55 0.6 0.65 0.7 0.75 0.8 0.85 0.9 0.95 1 0.1 0.2 0.3 0.4 0.5 0.6 0.7 0.8
Fuzzy membership degree
Probability
Fuzzy membership degree mean = 0.89
scatter (Bishop, 1995). Probabilistic LDA is a generative model in which probability models are derived as a result of training, in addition to the usual LDA features (Ioffe, 2006). This suggests that PLDA is more suitable for the tasks where recognition is performed on previously unseen classes. PLDA has proven to be successful in face recognition with uncontrolled conditions including variabilities in pose, lighting, and facial expressions (Prince and Elder, 2007). Speaker clustering with variations in speaking style defines a similar problem, replacing image vectors with GMM mean supervectors for our task.
Assuming that the training data set consists ofI speak-ers withJspeech samples for each speaker, thej0thGMM mean supervector from the i0thspeaker is denoted by x
ij,
with i¼1; ::;I and j¼1;. . .;J. The data generation is
modeled as:
xij¼lþFhiþGwijþeij ð10Þ
where the signal component: lþFhi depends only on the
speaker, while the noise component : Gwijþeij depends
on both the speaker and speaking style. The terml is the overall mean of the training data, andFandGare matrices which contain bases for between-speaker and within-speak-er subspaces, respectively. hi and wij are latent variables
and finally eij is the residual noise term which is defined
to be Gaussian with a diagonal covariance matrixR(Prince
and Elder, 2007). The output of PLDA training is the
mod-elh¼fl;F;G;Rgwhich is trained using Expectation Max-imization (EM) algorithm.
In the testing phase, the likelihood thatNsupervectors:
x1;. . .;xN belong to the same speaker, is the likelihood that
these supervectors share the same speaker variable or h
regardless of the noise variablesw1;. . .;wN. The following
equation combinesNgenerative models for these supervec-tors (Prince and Elder, 2007):
x1 x2 .. . xN 2 6 6 6 6 4 3 7 7 7 7 5¼ l l .. . l 2 6 6 6 6 4 3 7 7 7 7 5þ F G 0 0 F 0 G 0 .. . .. . .. . . . . .. . F 0 0 G 2 6 6 6 6 4 3 7 7 7 7 5 h w1 w2 .. . wN 2 6 6 6 6 6 6 6 4 3 7 7 7 7 7 7 7 5 þ e1 e2 .. . eN 2 6 6 6 6 4 3 7 7 7 7 5 ð11Þ
which can be rewritten as:
x0¼l0þAyþe0: ð12Þ
The likelihood of N supervectors being from the same speaker can now be determined as:
Prðx0Þ ¼Nðx0l0;AATþR0Þ: ð13Þ R0¼ R 0 0 0 R 0 .. . .. . . . . .. . 0 0 R 2 6 6 6 6 4 3 7 7 7 7 5 ð14Þ
5.2. Proposed speaker clustering algorithm based on PLDA
Our proposed clustering algorithm includes two stages: 1. baseline clustering with full dimensional supervectors; 2. refining the clusters obtained in the first stage in a PLDA dimensionality reduced subspace (Mehrabani and Hansen, 2012). A PLDA model is trained on the training data set which includes 15 speakers with reading and singing sam-ples for each speaker. The trained model can then be used to refine the speaker clusters on the test set with speakers which were not present in training.
After the initial clustering, each supervector is compared to other supervectors in its cluster, as well as supervectors in the other clusters based on a likelihood ratio. For each two supervectorsxandy, this likelihood ratio is calculated using the trained PLDA model:
LLRðx;yÞ ¼LogðLikelihoodðsameÞ=LikelihoodðdiffÞÞ
¼LogðLikelihoodðsameÞÞ LogðLikelihoodðdiffÞÞ
ð15Þ
whereLikelihoodðsameÞ is the likelihood that xand y be-long to the same speaker, andLikelihoodðdiffÞis the like-lihood thatxandybelong to different speakers. Based on Eq.(10),xandy can be written as:
x¼lþFh1þGw1þe
y¼lþFh2þGw2þe
ð16Þ
Table 2
Mean and standard deviation of fuzzy cluster distances between pairs of speakers for reading, singing, and a mixture of reading and singing.
Reading Singing Mixture
Mean 0.95 0.77 0.59 Standard deviation 0.03 0.24 0.28 90 88 86 84 82
Average Clustering Accuracy (%)
80 80
0 1 2 3 4 5
PLDA Refining Iterations
Fig. 6. Average clustering accuracy for a mixture of reading and singing with c-means baseline when the number of iterations for PLDA refining algorithm varies from 0 to 5.
where there are two hypotheses:H1is the hypothesis thatx andybelong to the same speaker, andH2is the hypothesis thatxandy belong to different speakers. If two supervec-torsx andybelong to the same speaker:h1¼h2¼h. The likelihood for each hypothesis can be calculated as condi-tional probabilities based on PLDA model (Prince and El-der, 2007): Prðx;y Hj 1Þ ¼ Z Z Prðx hj ;w1ÞPrðw1Þdw1: Z Prðy hj ;w2ÞPrðw2Þdw2 Prð Þh dh ð17Þ Prðx;y Hj 2Þ ¼ Z Z Prðx hj 1;w1ÞPrð Þh1 Prðw1Þdh1dw1: Z Z Prðy hj 2;w2ÞPrð Þh2 Prðw2Þdh2dw2 ð18Þ IfLLRðx;y1Þ>LLRðx;y2Þ;xandy1are more likely to be from the same speaker thanxandy2. Therefore, LLRcan directly be applied in clustering as a distance measure. However, our experiments show that usingLLRfor refin-ing the obtained clustered from the baseline, renders better clustering results. The refining algorithm is as follows:
Step 1: For each supervectorxc
i in clusterc, calculate the
LLR with all the supervectors in cluster
c:LLRðxc
i;x c
jÞ;i¼1; ::;Nc;j¼1; ::;Nc.
Step 2: For each supervectorxc
i in clusterc, calculate the
LLR with all the supervectors in other clusters
c0¼1;. . .;C;c0–c:LLRðxc i;x
c0
jÞ;i¼1; ::;Nc;j¼1; ::;Nc0. Step 3: If cm¼arg max
c0¼1;...;C medianðLLRðxc i;x c0 1Þ;. . .;LLR ðxc i;x c0 Nc0ÞÞ–c, movex c i to clustercm.
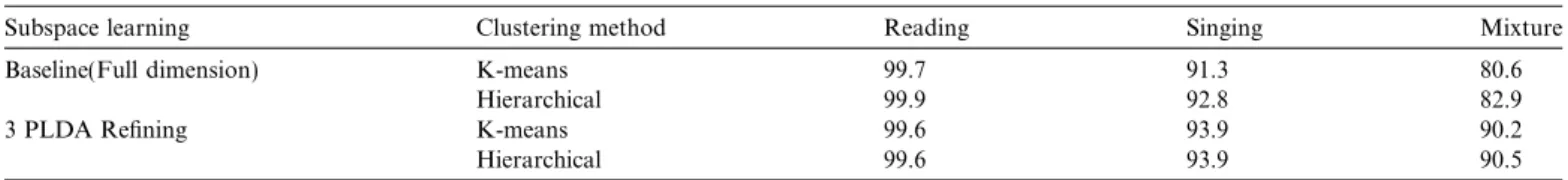
Table 3shows results of the proposed clustering method
for reading, singing, and a mixture of reading and singing. Our experiments show that repeating the refining stage improves the clustering accuracy. The first row represents baseline results with no dimensionality reduction, and the second row represents clustering accuracies with 3 itera-tions of the proposed refining algorithm in the PLDA sub-space when the first stage clustering method is k-means, and hierarchical. Since the PLDA subspace learning is based on reading and singing data for 15 training speakers, the reduced dimension for PLDA is chosen to be 14. Com-pared to the baseline clustering accuracies, the clustering accuracy for a mixture of reading and singing increases by 9.6% with k-means as the baseline, and 7.6% with hier-archical clustering as baseline. The clustering accuracies increase for singing, and are similar to baseline for reading.
The best clustering performance for the mixture after 3 refining iterations is 90.5%.
In Section 4.2we noted that the fuzzy c-means cluster-ing baseline has similar clustercluster-ing accuracies to k-means. It was also explained that c-means clustering is based on fuzzy membership degrees and for two-speaker cluster-ing, data points with membership degrees more than 0.5 are considered to belong to a cluster. Here, we use c-means clustering as baseline and its membership degrees in PLDA refining to reduce the processing time. An anal-ysis of the fuzzy membership degrees for all the reading and singing supervectors from all 153 speaker pairs in the test set shows that 68.5% of the incorrectly clustered supervectors have membership degrees less than 0.9, while 63:2%of the correctly clustered samples have membership degrees more than 0:9. This suggests that performing the refining algorithm on data points with membership degrees in the interval ½0:5 0:9 should render similar results. Note that our membership degree decision thresh-old for clustering is set to 0:5. The average clustering accuracy for a mixture of reading and singing with c-means baseline and no PLDA refining is 81:1%. This accuracy increases to 86:6% with one iteration of PLDA refining algorithm. Performing the refining algorithm only on data points with membership degrees less than 0:9 results in the same accuracy, while processing time reduces to half the processing time for all the data points.
Fig. 6shows the average clustering accuracy for a mixture
of reading and singing, when the number of PLDA refin-ing iterations increase from 0 (baseline with no refinrefin-ing) to 5. The baseline clustering in this experiment is fuzzy c-means. As shown in the figure, with the first refining iteration, the clustering accuracy increases the most. The second and third iterations also show an increase in accu-racy, but after that it does not change significantly.
5.3. Frontend supervised subspace learning based on LDA
In this section, various frontend configurations are eval-uated and compared to 19-dimensional MFCCs. Next, we show that LDA based supervised subspace learning in fea-ture space improves the clustering performance. Finally, the frontend LDA transformed features are combined with the proposed backend PLDA based cluster refining algo-rithm to achieve higher clustering accuracies, especially for the mixture of reading and singing.
Table 4 represents speaker clustering accuracies for
reading, singing, and a mixture of reading and singing with
Table 3
Average clustering accuracies (%) for reading, singing, and a mixture of reading and singing with proposed algorithm based on PLDA.
Subspace learning Clustering method Reading Singing Mixture
Baseline(Full dimension) K-means 99.7 91.3 80.6
Hierarchical 99.9 92.8 82.9
3 PLDA Refining K-means 99.6 93.9 90.2
5 frontend configurations using the baseline clustering sys-tem. First row shows the results with 19-dimensional MFCCs, and second row shows the results when 19-dimen-sional MFCC features are concatenated with delta coeffi-cients. The third row represents clustering accuracies with Perceptual Linear Predictive (PLP) features (Hermansky, 1990), and fourth row shows the results of concatenating PLP features with delta PLPs, with a 5 frame window. The last row of Table 4 represents the clustering results with the features proposed in (Tang et al., 2012) which replace delta coefficients with LDA transformed features to account for temporal dynamics of the speech signal. Since we were using TIMIT to train our UBM, we also used TIMIT for LDA training. 19-dimensional PLP fea-tures extracted from every five consecutive frames (two frames before, and two after the current frame) were con-catenated to create long 95-dimensional vectors (five frame window was chosen to be comparable to the window size used to calculate delta PLPs). An LDA model was trained with TIMIT data based on known speaker labels. The fea-ture dimension was reduced to 32 using the LDA mapping which was applied to UBM data as well as test data. As shown in Table 4, PLP and LDA transformed PLP fea-tures, increased the clustering accuracies for reading, but had worse performance for singing and mixture compared
to the baseline. None of the other features showed improvement for singing, and only delta PLPs improved speaker clustering performance for a mixture of reading and singing.
Next, LDA transformed features (Tang et al., 2012) were evaluated including some singing data to train the LDA model. Two LDA models were trained: one with TIMIT for the feature transformation of UBM data, and one with 15 train speakers from UT-Sing corpus with read-ing and sread-ingread-ing data for each speaker. Since there were only 15 speakers to train the second LDA model, dimension of all features were reduced to 14. Feature transformation from the second LDA was used for dimensionality reduc-tion of test data which included both reading and singing. Note that there was no overlap between train and test. Sec-ond row ofTable 5 shows clustering accuracies using the explained LDA PLP features. As shown, clustering accura-cies increase, especially for the mixture.
Finally, the LDA PLP features were combined with PLDA clustering algorithm, and the results are summa-rized in the third row ofTable 5. The clustering accuracy for a mixture of reading and singing increased to 94:5%. Compared to the second row, proposed PLDA cluster refining improves the speaker clustering for mixture by 5% with k-means, and 2:6% with hierarchical clustering.
Table 4
Average clustering accuracies (%) for reading, singing, and a mixture of reading and singing with various frontend configurations and baseline clustering.
Features Clustering method Reading Singing Mixture
Baseline (19d MFCC) K-means 99.7 91.3 80.6 Hierarchical 99.9 92.8 82.9 Delta MFCC (38d) K-means 99.7 90.9 77.9 Hierarchical 99.6 91.8 78.8 PLP (19d) K-means 99.9 90.6 79.7 Hierarchical 100.0 92.4 80.7 Delta PLP (38d) K-means 99.7 90.9 82.5 Hierarchical 99.9 92.4 83.7 LDA PLP (32d) K-means 100.0 86.7 76.0 Hierarchical 100.0 88.1 77.0 Table 5
Average clustering accuracies (%) for reading, singing, and a mixture of reading and singing with frontend LDA supervised subspace learning, and combination with backend PLDA cluster refining.
Subspace learning Clustering method Reading Singing Mixture
Baseline (Full dimension) K-means 99.7 91.3 80.6
Hierarchical 99.9 92.8 82.9
Frontend LDA K-means 100.0 96.7 89.5
Hierarchical 100.0 97.5 91.9
Frontend LDA&Backend PLDA K-means 99.8 96.8 94.5
Hierarchical 99.8 96.9 94.5
Table 6
Clustering accuracies (%) for a mixture of reading and singing with background music.
SNR (dB) 1 15 10 5 0
PLDA Clustering (accuracy in %) 68.9 67.6 56.8 56.8 55.4
This shows that PLDA cluster refining algorithm in the GMM supervector space adds complimentary information to the supervised LDA transformation in the feature space, both using reading and singing samples to train models. Next, we will show the effects of adding background music to the singing for speaker clustering.
5.4. Speaker clustering for singing with background music
So far, we have proposed a speaker clustering algorithm based on PLDA which considerably improves the perfor-mance when clustering both reading and singing speech samples of the speakers. This has real applications in infor-mation retrieval, and speaker diarization for audio streams available on the internet, radio, or TV that include speak-ing and sspeak-ingspeak-ing of one or more of the speakers. A good example of such audio is interview with famous singers or when they appear on a talk show. In addition, there is an increasing number of singing competitions on TV, and auditions which include both speaking and singing voice of the participants. In some of these examples, the singing voice might be accompanied by background music.
In the literature, several studies have focused on singing voice separation from music accompaniment in single channel and monaural recordings (Li and Wang, 2007;
Ozerov et al., 2007). For stereo recordings this task is less
challenging and there are many tools available to make acapellas. Though singing voice separation is out of the scope of this paper, here we perform a probe experiments to show the performance of our speaker clustering system with background music. It should be noted that singing voice separation techniques do not completely remove the background music, therefore, we conduct an experiment in which the performance of the system is evaluated by increasing the background music. In addition, our goal is to perform unsupervised speaker clustering on speech seg-ments which may or may not be singing and may or may not have background music. Therefore, it is important to have an acceptable performance when music is also present.
In this probe experiment, two female speakers are selected who sing the same song. Next, the correct matched music is added to the singing with varying Signal to Noise Ratio (SNR), considering the music as noise. The resulting audio streams are then segmented. In order to make the task more challenging and closer to real applications which include shorter segments, the clustering is performed on 5 sec. segments instead of 10 sec. For each SNR, the read lyr-ics from the same speakers are also segmented and mixed with the singing segments.Table 6shows the speaker clus-tering accuracies with the proposed clusclus-tering algorithm with 5 refining iterations, compared to the hierarchical baseline when SNR varies from 0 to1(when there is no background music). Note that in a two-speaker clustering task, 50%represents the lowest accuracy, since for accura-cies lower than that, the clusters can simply be switched. As shown, this is a very challenging task with low clustering
accuracy even with no music. The proposed system increases the performance by 17:6%when there is no back-ground music. Adding the music does not reduce perfor-mance considerably up to SNR = 10. For 0, 5, and 10 dB SNR, the performance is similar with a 13:5%decrease in accuracy for SNR = 0, compared to no music. However the clustering accuracy for 0 dB SNR is still 5:4% better than the baseline.
6. Discussion and conclusions
Speaker clustering systems were explored for singing and a mixture of reading and singing. It was shown that introducing various speaking styles decreases speaker clus-tering accuracies by up to 20%. Unsupervised subspace learning for singing speaker clustering was studied. It was shown that dimensionality reduction techniques such as PCA which are based on global structure of the data set do not improve the clustering accuracy, while LPP which preserves local structure of the data improves results for singing and a mixture of reading and singing. Supervised subspace learning for singing speaker clustering was also studied. An algorithm was proposed for refining speaker clusters based on the log likelihood ratio which decides if two speech samples belong to the same speaker or not. This ratio is calculated based on probabilistic discriminant anal-ysis which attenuates the effect of speaking style on speaker clustering.
While this study was focused on the model domain and speaker dependent subspaces, robustness in the feature domain including features that are less dependent on speaking style, or feature compensation techniques can also be studied which is our plan for future work. In addi-tion, the results from this study can be evaluated for a wider variety of speaking styles. These advancements offer an important step towards improving the acoustic model-ing of speech and speakers for speech applications includ-ing speaker ID, spoken document retrieval, and audio search applications.
References
Belkin, M., Niyogi, P., 2002. Laplacian eigenmaps and spectral techniques for embedding and clustering. Adv. Neural Inf. Process. Systems 14, 585–591.
Ben, M., Betser, M., Bimbot, F., Gravier, G., 2004. Speaker diarization using bottom-up clustering based on a parameter-derived distance between adapted gmms. Proc. ICSLP, In.
Bezdek, J., 1981. Pattern Recognition with Fuzzy Objective Function Algorithms. Kluwer Academic Publishers.
Bishop, C., 1995. Neural Networks for Pattern Recognition. Oxford University Press.
Bou-Ghazale, S., Hansen, J.H.L., 1998. Stress perturbation of neutral speech for synthesis based on hidden markov models. IEEE Trans. Speech Audio Process. 6 (3), 201–216.
Campbell, W., Sturim, D., Reynolds, D., 2006. Support vector machines using GMM supervectors for speaker verification. IEEE Signal Process. Lett. 13 (5), 308–311.
Chu, S., Tang, H., Huang, T., 2009a. Fishervoice and semi-supervised speaker clustering. In: Proc. IEEE ICASSP, pp. 4089–4092.
Chu, S., Tang, H., Huang, T., 2009b. Locality preserving speaker clustering. In: IEEE Internat. Conf. on Multimedia and Expo, ICME 2009. pp. 494–497.
Dunn, J., 1973. A Fuzzy Relative of the ISODATA Process and its Use in Detecting Compact Well-Separated Clusters. Taylor & Francis. Faltlhauser, R., Ruske, G., 2001. Robust speaker clustering in eigenspace.
In: IEEE Workshop on Automatic Speech Recognition and Under-standing, ASRU’01, pp. 57–60.
Fan, X., Hansen, J.H.L., 2008. Speaker identification for whispered speech based on frequency warping and score competition. In: Proc. Interspeech, pp. 1313–1316.
Hansen, J.H.L., 1996. Analysis and compensation of speech under stress and noise for environmental robustness in speech recognition. Speech comm. 20 (1), 151–173.
Hansen, J.H.L., Swail, C., South, A., Moore, R., Steeneken, H., Cupples, E., Anderson, T., Vloeberghs, C., Trancoso, I., Verlinde, P., 2000. The impact of speech under stress on military speech technology. NATO Project Report.
Hansen, J.H.L., Varadarajan, V., 2009. Analysis and compensation of lombard speech across noise type and levels with application to in-set/ out-of-set speaker recognition. IEEE Trans. Audio Speech Lang. Process. 17 (2), 366–378.
He, X., Niyogi, X., 2003. Locality preserving projections. In: Proc. Adv. Neural Inf. Process. Systems. vol. 16, pp. 153.
He, X., Yan, S., Hu, Y., Niyogi, P., Zhang, H., 2005. Face recognition using laplacianfaces. IEEE Trans. Pattern Anal. Machine Intell. 27 (3), 328–340.
Hermansky, H., 1990. Perceptual linear predictive (plp) analysis of speech. J. Acoust. Soc. Amer. 87, 1738.
Ioffe, S., 2006. Probabilistic linear discriminant analysis. Computer Vision – ECCV, pp. 531–542.
Kuhn, R., Junqua, J., Nguyen, P., Niedzielski, N., 2000. Rapid speaker adaptation in eigenvoice space. IEEE Trans. Speech Audio Process. 8 (6), 695–707.
Li, Y., Wang, D., 2007. Separation of singing voice from music accompaniment for monaural recordings. IEEE Trans. Speech Audio Process. 15 (4), 1475–1487.
Lippmann, R., Martin, E., Paul, D., 1987. Multi-style training for robust isolated-word speech recognition. In: Proc. IEEE ICASSP, vol. 12, pp. 705–708.
Makhoul, J., Kubala, F., Leek, T., Liu, D., Nguyen, L., Schwartz, R., Srivastava, A., 2000. Speech and language technologies for audio indexing and retrieval. Proc. IEEE 88 (8), 1338–1353.
Mehrabani, M., Hansen, J.H.L., 2012. Speaker clustering for a mixture of singing and reading. In: Proc. Interspeech.
Ozerov, A., Philippe, P., Bimbot, F., Gribonval, R., 2007. Adaptation of bayesian models for single-channel source separation and its applica-tion to voice/music separaapplica-tion in popular songs. IEEE Trans. Audio Speech Lang. Process. 15 (5), 1564–1578.
Prince, S., Elder, J., 2007. Probabilistic linear discriminant analysis for inferences about identity. In: IEEE Internat. Conf. Computer Vision, pp. 1–8.
Rabiner, L., Juang, B., 1993. In: Fundam. Speech Recognition, vol. 103. Prentice hall.
Reynolds, D., 1995. Speaker identification and verification using Gaussian mixture speaker models. Speech comm. 17 (1), 91–108.
Reynolds, D., Kenny, P., Castaldo, F., 2009. A study of new approaches to speaker diarization. In: Proc. Interspeech, pp. 6–10.
Reynolds, D., Quatieri, T., Dunn, R., 2000. Speaker verification using adapted Gaussian mixture models. Digital Signal Process. 10 (1–3), 19–41.
Shriberg, E., Graciarena, M., Bratt, H., Kathol, A., Kajarekar, S., Jameel, H., Richey, C., Goodman, F., 2008. Effects of vocal effort and speaking style on text-independent speaker verification. In: Proc. Interspeech.
Solomonoff, A., Mielke, A., Schmidt, M., Gish, H., 1998. Clustering speakers by their voices. In: Proc. IEEE Internat. Conf. Acoustics, Speech and Signal Processing, vol. 2, pp. 757–760.
Tang, H., Chu, S., Hasegawa-Johnson, M., Huang, T., 2012. Partially supervised speaker clustering. IEEE Trans. Pattern Anal. Machine Intell. 34 (5), 959–971.
Tang, H., Chu, S., Huang, T., 2009. Generative model-based speaker clustering via mixture of von mises-fisher distributions. In: Proc. IEEE ICASSP, pp. 4101–4104.
Tranter, S., Reynolds, D., 2006. An overview of automatic speaker diarization systems. IEEE Trans. Audio Speech Lang. Process. 14 (5), 1557–1565.
Tsai, W., Cheng, S., Chao, Y., Wang, H., 2005. Clustering speech utterances by speaker using eigenvoice-motivated vector space models. In: Proc. IEEE ICASSP, pp. 725–728.
Tsai, W., Rodgers, D., Wang, H., 2004. Blind clustering of popular music recordings based on singer voice characteristics. Comput. Music J. 28 (3), 68–78.
Ward Jr., J., 1963. Hierarchical grouping to optimize an objective function. J. Amer. Stat. Assoc., 236–244.
Wooters, C., Huijbregts, M., 2008. The ICSI RT07s speaker diarization system. Multimodal Technologies for Perception of Humans, pp. 509– 519.
Wu, W., Zheng, T., Xu, M., Bao, H., 2006. Study on speaker verification on emotional speech. In: Proc. Interspeech, pp. 2102–2105.
Zhang, C., Hansen, J.H.L., 2007. Analysis and classification of speech mode: whispered through shouted. In: Proc. Interspeech. pp. 2289– 2292.
Zhang, C., Hansen, J.H.L., 2011. Whisper-island detection based on unsupervised segmentation with entropy-based speech feature process-ing. IEEE Trans. Audio Speech Lang. Process. 19 (4), 883–894.