Big Data Analytics: Feature Selection and Machine
Learning for Intrusion Detection On Microsoft
Azure Platform
Nachirat Rachburee and Wattana Punlumjeak
Department of Computer Engineering, Faculty of Engineering, Rajamangala University of Technology Thanyaburi, Pathumthani, Thailand.
Abstract—In recent years, the overwhelming networking data has been growing at an exponential rate. Not only storage but also computing needs a system to process an intrusion detection system with a massive dataset. This research used cloud analytics to store big dataset, preprocess data, classify and evaluate results by using Microsoft azure, which can provide the appropriate environment. Because of the growth of data volume, intrusion detection model that adopts data mining technique has been used to detect intrusion pattern. Our research used mutual information and chi-square as a feature selection technique to reduce a feature set for computation time. Then, decision forest and neural network were used to classify the attack type of intrusion by 100% KDD CUP 1999 dataset. The performance of intrusion detection was measured by the accuracy of detection rate of attack type from the evaluation process in Microsoft azure.
Index Terms—Big Data; Feature Selection; Intrusion Detection.
I. INTRODUCTION
Nowadays, data from networking log is significantly increasing. Enormous log data from network has high complexity, and they are time consuming for computation scenarios. Cloud computing offers following resources:
Infrastructure as a service (IaaS) that provides Networking, computing and data storage.
Platform as a service (PaaS) that offers an important infrastructure for software development and application.
Software as a service (SaaS) that provides software on-demand via networking and reduces the cost of surrounding software.
Figure 1: Cloud computing framework
Many machine learning are applying to a large volume of
data. Cloud computing can be a new solution applied for machine learning over a big volume of data. A framework of cloud computing uses parallel process to compute a result. Another good point of cloud computing is its compatibility of popular language and library, such as python, and R. Machine learning, HDinsight, and virtual machine are also supported by cloud platform.
The emergence of new technology in many devices connects internet and generates tremendous data every day. The big volume of data is analyzed by machine learning. The quick flow of data from the networking results in varieties of structured and unstructured data. Many data mining techniques have been applied to analyze the intrusion detection system. In 2012, there were more than 2.72 zettabytes for the world’s digital content and it could reach 8 zettabytes by 2015 [1]. The significant growth of data volume has changed the strategies to deal with the enormous data such as store, link and process data. This data has a variety of structures and they come from many sources.
Data analytic has been applied extensively in many business and research problems. Microsoft azure offers a tool to analyze data on cloud platform. Machine learning is one of services from Microsoft azure that provides valuable tools for data analysis. Moreover, Microsoft azure yields infrastructure to process a big data. The cost of computation will be charged only from the options those you selected.
In [2], Microsoft azure platform was used as a platform for high performance computing application. Application source code was imported to azure platform. They compared the performance among real machine, amazon EC2 and Microsoft Azure. The results presented that Microsoft azure was nearly closed to the performance of real machine.
II. BACKGROUND AND RELATED WORK A. Intrusion Detection System
Intrusion Detection System is a security management system that looks for an abnormal behavior in the network. Intrusion Detection System refers to the hardware or software, which monitor traffic sent over the network by analyzing behavior patterns in data packets. To find out what goes wrong, prediction process will be used to determine the real intrusion events.
Intrusion Detection can use data mining techniques to detect an abnormal event. There are four categories of
attacks type: Denial of Service, Probing, User to Root, and Remote to Local, as shown in Table 1 [3].
Table 1 Type of Attack
Type Attack
DoS back, teardrop, land, pod, neptune, smurf PROBE ipsweep, nap, satan, portsweep
R2L phf, guess_passwd, imap, ftp_write, multihop, spy, warezmaster, warez_client U2R rootkit, loadmodule, buffer_overflow, perl
A Correlation-based Feature Selection, Information Gain and Gain Ratio were used to reduce the input feature set. Then, naive bayes were used to classify the intrusion detection. The result showed that FVBRM could yield more classification performance [4].
B. Feature Selection
Feature selection is a technique used to reduce a feature set before going to the classifier process. This research used mutual information and chi – square to select a feature subset.
a. Chi – Square
Chi-square is used for assessing two kinds of comparison: tests of goodness of fit and tests of independence. In the feature selection, Chi-square assesses the tests of independence and estimates whether the label feature is independent on a feature. Weight with o class and f values from Chi-square method are defined as:
x2 = − ∑ ∑(nij-μij) μij o j=1 f i=1 (1)
nij is the amount of samples value with the ith value of the feature.
μij =
(n*jni*)
n (2)
where: ni* = the amount of samples with the ith the feature value.
n*j = the amount of samples in class j. n = the number for samples
In [5], to protect ICS, both the feature selection and multi-agent intrusion detection were implemented onto ICS. The main purpose of intrusion detection approach is to improve detection reliability. In the experiment, NSL-KDD data set was used to compare performance of common feature selection techniques. 41 features were applied by the Information Gain and Chi-square methods to reduce a feature subset.
In [6], detection mechanism used bayesian network to find appropriate attributes for fast detection. The results showed that the most important nine attributes gained better accuracy rate than the 41 features.
b. Mutual Information
Mutual information is used to measure important information of one feature against the class feature. High value of mutual information means that the tested feature has high relevance to the output class, and presents an
informative feature to class feature. On the other hand, small number of mutual information presents low informative feature and gets low reduce dimension. The result from mutual information was a positive value.
I(I;J) = ∑ Pij(i,j)
i,j
log Pij(i,j)
Pi(i)Pj(j) (3)
Pi (i) and P j (j) are the marginals. Pi(i) = ∑ Pij(i,j)
j
(4)
Mutual information was used in unsupervised feature transformation and integrated with PCA that transformed symbolic feature into numerical feature without any loss of information. The research used NSL-KDD dataset for testing a model. The results showed that this method reduced the feature subset and has better performance of classification [7].
In [8], Feature ranking and least square support vector machine was used for Hybrid feature selection. They removed the redundant and irrelevant feature by mutual information method. Then, LS-SVM was used to find the best one subset from many feature subsets by comparing the accuracy of classification. This experiment used 10% KDD Cup 1999 that showed good result in accuracy rate.
C. Classification method a. Decision forest
Decision forest creates multiple decision trees and then votes the highest output class. This classification technique has an internal node that has edges equal to possible values of feature. The leaf node shows the result of each path.
The highest information gain Feature is used to be a root node. Then, we searched for the relevant feature and repeat spit into the subset feature [9].
Entropy(r1) = -p(r1) log p(r1) (5)
IG(parent,child) = Entropy(parent)-[p(r1)x
Entropy(r1) + p(r2)x Entropy(r2) +...] (6)
Random tree forest algorithm was used to training model for learning intrusion patterns, before detecting the network intrusion from a pattern. k-means clustering was used to detect the intrusion network by clustering the collected data. 10% of KDD’99 dataset were tested in the experiment [10].
In [11], Classification and Regression Trees (CART and Bayesian network (BN) algorithm were used to classify the types of intrusion attack. The research showed a comparison of the performance from different feature sets. The ensemble classifier presented the performance with 100% accuracy of Normal, Probe and DOS, 84% accuracy of U2R and R2L respectively.
In [12], C 4.5 Decision tree and C 4.5 Decision tree with Pruning were used to compare the accuracy of detection rates in intrusion detection system. The experiment used KDD Cup’ 99 and NSL_KDD dataset to train and test the classification model with the reduced feature set. The results
indicated that pruning algorithm in C 4.5 decision tree had better performance with 98% accuracy.
b. Neural Network
Multiclass Neural Network or multilayer perceptrons is a network of simple computing unit called neuron managed in layers. The output is computed from the weight of a hidden layer node connected with the weight edge to the next layer.
The value of each node is calculated by the weighted sum of values from the previous layer and repeatedly calculated to the next layer until the final output.
According to [13], NN has been used to classify attack types in many intrusion detection systems. The experiment applied NN and fuzzy clustering (FC-ANN) to train dataset. The result of detecting the low frequency attack achieved higher accuracy rate. FC-ANN approach achieved a higher detection rate for R2L and U2R attacks, respectively at 83.33% and 93.18%
In [14], the research used information gain to calculate the weight of attribute that reduces a feature set. KDD CUP 1999 data set was used for training and testing phases. The work tested and recorded F-score, Recall, Precision and Accuracy values. It compared the reduced feature subset with the full feature set. The comparison showed that reduced dataset in back propagation neural network had better performance.
In [15], Attribute ranking and Greedy forward selection were used as Feature selection in the research. Then, a reduce feature set was used to classify by classifier algorithm. k-nearest neighborhood, support vector machine, naive bayes, neural network and decision tree were used to detect an intrusion pattern.
The result showed that enormous dataset are important to reduce an attribute for efficiently and timely classification.
D. Proposed Model
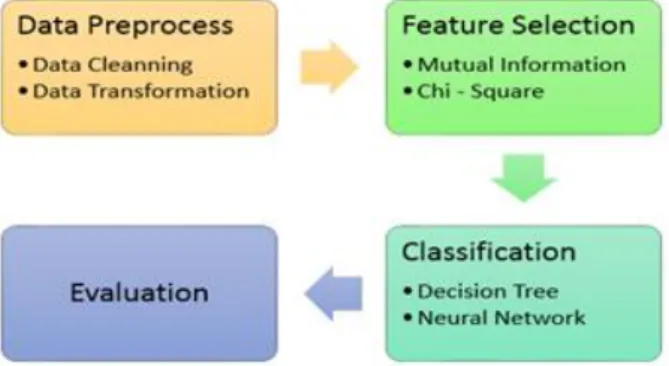
We proposed an intrusion detection model as shown in Figure 2. The full dataset from KDD Cup 1999 was used in this model. We cleaned and transformed the data to a training format of classification method. In the feature selection step, we used mutual information and chi-square to select feature subset to train in the classification process. Neural network and decision forest were used in classification model to classify 22 intrusion attack type. The last process was the evaluation process that used to evaluate the result and compare the accuracy of classification model.
Figure 2: Block diagram of Intrusion detection Model III. EXPERIMENTAL AND RESULTS
In our experiment, we used real world 100% dataset from KDD CUP 1999 UCI data repository [16]. The 100% network data about 800 MB was uploaded to Microsoft azure dataset in machine learning part. The dataset has 4,898,431 records, 41 features and 22 attack types as shown in Table 2.
Table 2
Feature set of KDD CUP 1999
No. Feature Name Description No. Feature Name Description
1 Duration Length (number of seconds) of the
connection 22 Is_guest_login 1 if the login is a “guest” login; 0 otherwise
2 Protocol type Type of the protocol, e.g., tcp, udp, etc. 23 Count Number of connections to the same host as the current connection in the past two seconds
3 Service Network service on the destination, e.g., http, telnet,
etc. 24 Srv_count
Number of connections to the same service as the current connection in the past two seconds
4 Flag Normal or error status of the connection 25 Serror_rate % of connections that have “SYN” errors 5 Src_bytes Number of data bytes from source to
destination 26 Srv_serror_rate % of connections that have “SYN” errors 6 Dst_bytes Number of data bytes from destination to source 27 Rerror_rate % of connections that have “REJ” errors 7 Land 1 1 if connection is from/to the same
host/port; 0 otherwise 28 Srv_rerror_rate % of connections that have “REJ” errors 8 Wrong_fragment Number of “wrong” fragments 29 Same_srv_rate % of connections to the same service 9 Urgent Number of urgent packets 30 Diff_srv_rate % of connections to different services 10 Hot Number of “hot” indicators 31 Srv_diff_host_rate % of connections to different hosts 11 Num_failed_logins Number of failed login attempts 32 Dst_host_count Count for destination host 12 Logged_in 1 if successfully logged in; 0 otherwise 33 Dst_host_srv_count Srv_count for destination host 13 Num_compromised Number of “compromised” conditions 34 Dst_host_same_srv_rate Same_srv_rate for destination host 14 Root_shell 1 if root shell is obtained; 0 otherwise 35 Dst_host_diff_srv_rate Dif_srv_rate for destination host 15 Su_attempted 1 if “su root” command attempted; 0
otherwise 36
Dst_host_same_srv_port
_rate Same_src_port_rate for destination host 16 Num_root Number of “root” accesses 37 Dst_host_srv_diff_host_
rate Diff_host_rate for destination host 17 Num_file_creations Number of file creation operations 38 Dst_host_serror_rate Serror_rate for destination host 18 Num_shells Number of shell prompts 39 Dst_host_srv_serror_rate Srv_serror_rate for destination host 19 Num_access_files Number of operations on access control files 40 Dst_host_rerror_rate Rerror_rate for destination host 20 Num_otbound_cmds Number of outbound commands in an ftp
session 41 Dst_host_srv_rerror_rate Srv_serror_rate for destination host 21 Is_host_login 1 if the login belongs to the “hot” list; 0 otherwise
The dataset from 100% KDD CUP 1999 was cleaned and transformed data into numeric feature for classification method. Microsoft azure has feature selection methods including chi-square and mutual information. The Machine learning Experiment in Microsoft azure was used to select feature subset by defining a label feature and amount of the highest value from the selection method. The selected feature from the mutual information is shown in Table 3, and selected feature resulting from chi-square is shown in Table 4.
From the previous step, the amount of feature were 5, 10, 15, 20, 30 and all feature sets. Then, the outputs from the feature selection in each feature subset were separated into two parts. One part is sending to classification training model. The other one is a testing data. Multiclass classification models in windows azure are decision forest and neural network classified into 22 attack types.
The results from classification were evaluated in the evaluation process. Overall, the accuracy, average accuracy, precision and recall of each combined feature selection and classification method were calculated in this process.
Finally, when considering each feature reduction as shown in Table 5, in general, Decision forest provided a high accuracy in 5, 10, 15,20, 30 feature set. Neural network method yielded lower accuracy rate than the decision forest classifier method.
The 100% KDD CUP 1999 dataset was uploaded to Microsoft azure into a dataset item, which was promptly connected with other machine learning items.
The results of experiment in Table 5 can be depicted into graphic bars in Figure 3, which show the accuracy rates of the comparison between the combination of feature selection and classification method in intrusion detection.
Table 3
Selected feature from mutual information
Amount Mutual Information
5 5, 23,36,3,2 10 5,23,36,3,2,24,33,34,4,29 15 5,23,36,3,2,24,33,34,4,29,30,35,38,39,25 20 5,23,36,3,2,24,33,34,4,29,30,35,38,39,25,6,26,12,32,37 30 5,23,36,3,2,24,33,34,4,29,30,35,38,39,25,6,26,12,32,37,31,40, 41,27,28,1,10,13,8,18 Table 4
Selected feature from chi-square
Amount Chi-square 5 5,23,4,3,36 10 5,23,4,3,36,25,24,2,34,33 15 5,23,4,3,36,25,24,2,34,33,8,30,29,38,35 20 5,23,4,3,36,25,24,2,34,33,8,30,29,38,35,6,39,26,13,12 30 5,23,4,3,36,25,24,2,34,33,8,30,29,38,35,6,39,26,13,12,32,37,1 1,31,10,27,40,28,41,1 Table 5
Accuracy of classification with selected feature No. of Features 5 10 15 20 30 All DtreeMI 99.924 99.963 99.976 99.9961 99.9965 99.995 DtreeChi 99.953 99.975 99.977 99.9771 99.9962 99.995 NN MI 99.565 99.800 99.811 99.9261 99.9838 99.984 NN Chi 99.610 99.816 99.837 99.8032 99.985 99.984
Figure 3: Accuracy of classification with selected feature IV. CONCLUSION
Our research produced the result from the intrusion detection model which used Microsoft azure platform as part of the classification model. The big dataset of more than 800 Megabyte of KDD CUP 1999 was reduced into smaller data subset by filter method techniques, which are the mutual information and chi – square. 100% of dataset was used as training data in machine learning process using neural network and decision forest.
The result from evaluation process in Microsoft azure showed that combining the feature selection method and decision forest resulted in higher overall accuracy than the neural network in the research model. The combination of 30 features from the mutual information technique and decision forest classification generated the highest overall accuracy rate of 99.9965 %.
In our future work, the overwhelming network data will play more roles in many researches under intrusion detection. Streaming analytics in network data is a necessary process which should be in a real-time system protection environment. Additionally, we will compare the results and environment with other platform.
REFERENCES
[1] Intel IT Center, “Planning Guide: Getting Started with Hadoop, Steps IT Managers Can Take to Move Forward with Big Data Analytics”, retrieved November, 10, 2015 from http://www.intel.com/content/dam/www/public/us/en/documents/guid es/getting-started-with-hadoop-planning-guide.pdf
[2] Sagiroglu, S., and Sinanc, D., “Big data: A review”, 2013 International Conference on Collaboration Technologies and Systems (CTS), 2013, pp.42-47.
[3] Sharma, S. and Gupta, R. K., “Intrusion Detection System: A Review”, International Journal of Security and Its Applications, vol.9, no.5,2015, pp.69-76.
[4] Mukherjee, S. and Sharma, N., “Intrusion detection using naive Bayes classifier with feature reduction”, Procedia Technology, vol.4, 2012, pp.119-128.
[5] Gong, Y., Fang, Y., Liu, L. and Li, J., “Multi-agent Intrusion Detection System Using Feature Selection Approach”, 2014 Tenth International Conference on Intelligent Information Hiding and Multimedia Signal Processing, 2014, pp.528-531.
[6] Wang, W. and Gombault, S., “Efficient detection of DDoS attacks with important attributes”, Third International Conference on Risks and Security of Internet and Systems: CRiSIS’2008, 2008, pp.61-67. [7] Wei, M. and Chan, R. H., “Dimensionality reduction of hybrid data
using mutual information-based unsupervised feature transformation: With application on intrusion detection”, 2015 IEEE 13th International Conference on Industrial Informatics (INDIN), 2015, pp. 1108-1111.
[8] Ambusaidi, M., He, X., Tan, Z., Nanda, P., Lu, L. F., and Nagar, U. T., “A novel feature selection approach for intrusion detection data classification”, 2014 IEEE 13th International Conference on Trust, 99.3 99.4 99.5 99.6 99.7 99.8 99.9 100 5 10 15 20 30 All
Security and Privacy in Computing and Communications, 2014, pp. 82-89.
[9] Wu, X., Kumar, V., Quinlan, J. R., Ghosh, J., Yang, Q., Motoda, H., and Steinberg, D., “Top 10 algorithms in data mining”, Knowledge and Information Systems, vol.14, no.1, 2008, pp.1-37.
[10] Elbasiony, R. M., Sallam, E. A., Eltobely, T. E. and Fahmy, M. M., “A hybrid network intrusion detection framework based on random forests and weighted k-means”, Ain Shams Engineering Journal, vol.4, no.4, 2005, pp.753-762.
[11] Chebrolu, S., Abraham, A. and Thomas, J. P., “Feature deduction and ensemble design of intrusion detection systems”, Computers & Security, vol.24, no.4, 2005, pp. 295-307.
[12] Relan, N. G. and Patil, D. R., “Implementation of network intrusion detection system using variant of decision tree algorithm”, 2015 International Conference on Nascent Technologies in the Engineering Field (ICNTE-2015), 2015, pp.1-5.
[13] Wang, G., Hao, J., Ma, J. and Huang, L. 2010. A new approach to intrusion detection using Artificial Neural Networks and fuzzy clustering. Expert Systems with Applications, 37(9):6225-6232. [14] Shah, B. and Trivedi, B. H., “Reducing Features of KDD CUP 1999
Dataset for Anomaly Detection Using Back Propagation Neural Network”, 2015 Fifth International Conference on Advanced Computing & Communication Technologies, 2015, pp.247-251. [15] Harbola, A., Harbola, J. and Vaisla, K. S., “Improved Intrusion
Detection in DDoS Applying Feature Selection Using Rank & Score of Attributes in KDD-99 Data Set”, 2014 Sixth International Conference on Computational Intelligence and Communication Networks, 2014, pp.840-845.
[16] “KDD CUP 1999 : UCI data repository”, The Fifth International Conference on Knowledge Discovery and Data Mining retrieved
November, 10, 2015 from