IJSRR, 7(4) Oct. – Dec., 2018 Page 2325
Research article
Available online www.ijsrr.org
ISSN: 2279–0543
International Journal of Scientific Research and Reviews
Forensic Odontological Study On Rugae Morphology African Racial
Groups With Special Reference To The Dental Soft Tissue:
Dimensional Variations In Rugae Patterns
Vaid Vasu
1*and Babu Rajesh
21*
MSc. Forensic Odontology- Institute of Forensic Sciences, Gujarat Forensic Sciences University, Gandhi Nagar, Gujarat.
2
International Centre for Humanitarian Forensics, Faculty member, Institute of Forensic Sciences, Gujarat Forensic Sciences University, Gandhinagar, Gujarat,
ABSTRACT
Forensic odontology is one of the fast growing subjects in both the forensic sciences and dentistry. It has a number of applications for the purpose of administration of the justice and also for the societal welfare. Though there are a number of studies available on age estimation and sex determination, there are a very few studies on the race determination. In case of major disasters the race could be easily identified with the least destructible palate of the intra oral cavity. The palatal rugae could be easily analysed for the determination of racial groups. This has been studied with the African population. It has been further compared with that of an Indian population (Gujarati in particular). On the basis of morphology and morphometry of the patterns of the palatal rugae it is easily identified about the individuality, a total number of 70 people have been considered for the study. 2 racial groups: Africans (male= 20, females= 15) and Indians population (Gujarat in particular- males= 17, females =18) between the age group of 18years to 28 years have been considered. 70 maxillary impressions were taken with alginate impression material andthe casts are produced, 35 for African and 35 for Indian population. It was found that the Palatal rugae patterns in number, lengths and width showed significant differences between both the racial groups which serve as an important indicator for forensic identification especially in mass fatality incidents.
KEYWORDS:
Rugae patterns, width, lengths, human identification.*Corresponding author
Dr, Vasu Vaid
MSc. Forensic Odontology
Institute of Forensic Sciences,
Gujarat Forensic Sciences University,
Gandhi Nagar, Gujarat. India
Vaid Vasu et al., IJSRR 2018, 7(4), 2325-2337
IJSRR, 7(4) Oct. – Dec., 2018 Page 2326
INTRODUCTION:
Postmortem human identification of the deceased in cases of mass disasters achieved by
dental or any other means is one of the most challenging task. Forensic odontology is entirely a
unique entity dealing with evidence related to dental and oral structures. Although various studies
have been by the use of teeth in forensic investigations, use of other methods such as palatal rugae
patterns, lip prints, and bite marks were also reported. Palatal rugae are considered to be equipotent
with fingerprints and bite marks and a powerful tool for an individual identification in medico-legal
investigations. Palatal rugae are anatomically transverse, asymmetrical, irregular, soft-tissue ridges
present on the anterior part of the palatal mucosa, located posterior to the incisive papilla on each
side of the mid palatine raphae.1 They are also called 'plica palatine.' They are formed in the early
intrauterine life during the period from 12th to 14th week and remain stable throughout the person’s
life, not undergoing any changes, except for increase in the length as a process of normal
growth2.These palatal rugae patterns are unique to each individual. They remain well protected by
the lips, buccal pad of fat, mucosa, teeth and lips, and hence, survive postmortem insults. Palatal
rugae were found to be stable in shape and structure during the life of an individual and remain
unchanged by any disease, trauma, and chemicals or heat3.Once formed, they remain in the same
position and if destroyed, they are reproduced exactly on their original site3.
Studies done by Hauser et al. in 1989 have suggested that the mean recommended count
changes fairly in adolescence, but the count increases markedly from the third to fourth decade
onwards.4 But, Lysell in 1955 concluded that the number of rugae decrease from the second decade
onwards.5 Peavy and Kendrick in their study identified that the palatal rugae do not change as a
result of growth, but remain stable throughout life.6
A wide range of forensic science techniques help in positive identification of the deceased
victims, some of these are visual identification, use of fingerprints, lip print, denture coding, DNA
profiling and odontology. Just like fingerprints, palatal rugae are highly specific to each individual.
Identification of the badly mutilated body has been done using rugae patterns on patient’s denture in
the past.7 Also, rugae pattern are specific to different racial groups making it convenient for their
identification in a mass disaster situation.7 Several studies reported a significant association between
rugae forms and ethnicity which may represent a valuable finding in forensic investigations
especially in disasters.3 Therefore this study is an attempt to differentiate between the various rugae
patterns on the basis of their shapes, lengths and widths amongst the African and Indian population
to see which rugae pattern is predominant in Africans and Indians population thereby highlighting
IJSRR, 7(4) Oct. – Dec., 2018 Page 2327
the antemortem record of the same in the form of photographs or digitalised casts which can be
stored in the form of a secured database which later can be used for comparison purposes.
MATERIALS AND METHODS:
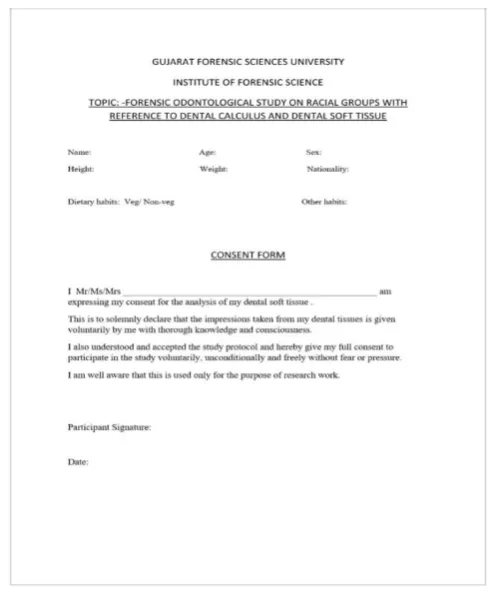
The study was conducted under Gujarat Forensic Sciences University. Informed consent was
obtained was each individual before taking impressions [Figure 1]. 70 maxillary impressions were
taken 35 each for Africans as well as Indians with the help alginate impression material and stainless
steel impression trays and the casts were then obtained using dental stone. The age range was
between 18-30 years. The casts obtained were free of any voids or bubbles. Patients with any
congenital abnormality, pathology and orthodontic treatments were excluded from the study. The
rugae were delineated using a sharp graphite pencil under adequate light and magnification shown in
fig. 2, 3.
Vaid Vasu et al., IJSRR 2018, 7(4), 2325-2337
IJSRR, 7(4) Oct. – Dec., 2018 Page 2328
Figure- 2 Indian Cast Figure- 3 African cast
The pattern of rugae was determined using Thomas and Kotze classification (Figure-4).11
Parameters included in the study were: number, shape, and unification patterns of rugae.
Also, lengths and widths of the rugae patterns were also measured.
The shapes of palatine rugae were classified into four major types:
Straight type: The rugae patterns which ran directly from their origin to termination.
Curved type: The rugae pattern which has a simple crescent shape, slightest bend at the termination origin of rugae.
Wavy type: The basic shape of wavy was serpentine, however, if there was a slight curve at the origin or termination of the curved rugae, it was classified as wavy.
IJSRR, 7(4) Oct. – Dec., 2018 Page 2329
Figure- 4 Pictorial Representation of the Analysis of Various Shapes of Palatal Rugae (according to Thomas and Kotze) 11
Length of Rugae. The length of rugae is classified as follows: Primary (>5 mm).
Secondary (3–5 mm), Tertiary (<3 mm),
Measurement of the lengths and widths of the rugae was done manually with the help of a
divider and the distance between the two end points between the rugae were measured with the help
of a scale.
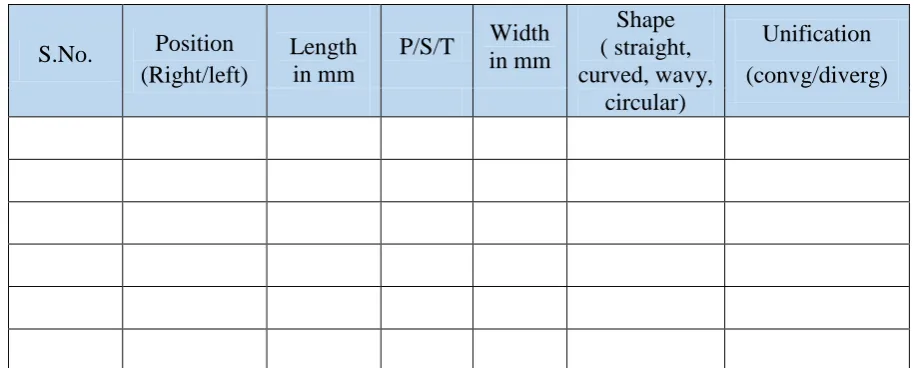
A simplified manner of a chart was prepared through this study to record all the findings for
all the samples. This is easier for recording the findings shown in fig. 5.
Vaid Vasu et al., IJSRR 2018, 7(4), 2325-2337
IJSRR, 7(4) Oct. – Dec., 2018 Page 2330
S.No. Position (Right/left)
Length in mm
P/S/T Width in mm
Shape ( straight, curved, wavy,
circular)
Unification
(convg/diverg)
Figure 5: Pictorial Representation of the Simplified Chart prepared for the Analysis of the Rugae Patterns (P:
Primary, S: Secondary, T: Tertiary)
Exclusion Criteria:
The subjects with congenital anomalies/malformations Subjects with any history of previous orthognathic surgery Bony and soft tissue protuberances in the palatal aspect Active lesions, and trauma of the palate were not selected
Subjects who were wearing partial dentures and braces were excluded.
Inclusion Criteria:
Normal subjects within the age limit of 18-28 years.
RESULTS:
The data was then evaluated onto the SPSS software with independent t- test which showed
high significance. Gender wise comparison of the patterns lengths as well as width for amongst
African and Indians were evaluated for which width showed high significance for male straight
patterns, female straight patterns, female curved patterns, male wavy patterns, female wavy patterns,
male circular patterns for both the racial groups showed high significance with p value < 0.05, [table
1-2]
Width differences in both the population groups were found to be highly significant (Indians
n=1.72, p=0.00 and Africans n= 2.67, p=0.00). The length measurements of primary rugae showed
significance with p value=0.07ie. <0.05, secondary pattern did not show any significance with the
independentt-test[table1&2
Differences in the number as well as measurements of length of rugae patterns classified on
the basis of lengths were also seen according to which primary rugae were more in number in
IJSRR, 7(4) Oct. – Dec., 2018 Page 2331
Africans and tertiary patterns are very rarely seen or were found to be almost same for both the
population groups and henceforth were not considered in statistical analysis shown in Table1 &2
Table-1: Gender wise analysis of mean of lengths of various patterns, including lengths of primary and secondary rugae along with the total width of the patterns. Group Statistics
Country N Mean Std. Deviation Std. Error Mean
Male straight Indian 95 1.53 .687 .071
African 78 2.44 1.567 .177
Female straight Indian 113 1.45 1.057 .099
African 49 1.99 1.056 .151
Female wavy Indian 39 1.62 .823 .132
African 44 2.07 .720 .109
Male circular Indian 11 2.32 1.601 .483
African 35 4.23 2.889 .488
Female circular Indian 6 2.08 1.530 .625
African 9 2.28 .833 .278
Width Indian 375 1.72 1.076 .056
African 388 2.67 1.866 .095
Length Primary Indian 341 10.18 2.953 .160
African 343 10.61 5.873 .317
Length Secondary Indian 32 4.41 .499 .088
Vaid Vasu et al., IJSRR 2018, 7(4), 2325-2337
IJSRR, 7(4) Oct. – Dec., 2018 Page 2332
Shinde Vikash, IJSRR 2018, 7(4), 01-15
Table-2: Analysis of lengths of various patterns, including lengths of primary and secondary rugae along with the total width of the patterns with significance.
Independent Samples Test Levene's Test
for Equality of Variances
t-test for Equality of Means
F Sig. t df Sig.
(2-tailed) Mean Difference Std. Error Difference 95% Confidence Interval of the
Difference
Lower Upper
Male straight
Equal variances
assumed
23.827 .000 -5.116 171 .000 -.913 .179 -1.266 -.561
Equal variances not assumed
-4.784 101.181 .000 -.913 .191 -1.292 -.535
Female straight
Equal variances
assumed
.952 .331 -3.026 160 .003 -.547 .181 -.904 -.190
Equal variances not assumed
-3.028 91.422 .003 -.547 .181 -.906 -.188
Male curved
Equal variances
assumed .059 .809
-1.841 94 .069 -.620 .337 -1.290 .049
Equal variances not assumed
-1.744 56.073 .087 -.620 .356 -1.333 .092
Female curve
Equal variances
assumed 20.740 .000
-3.040 102 .003 -.735 .242 -1.214 -.255
Equal variances not assumed
-2.826 65.465 .006 -.735 .260 -1.254 -.216
Male wavy
Equal variances
assumed
11.128 .001
-4.330 102 .000 -1.013 .234 -1.477 -.549
Equal variances not assumed
-5.818 82.991 .000 -1.013 .174 -1.359 -.667
Equal variances
assumed
1.506 .223 -2.674 81 .009 -.453 .169 -.790 -.116
Female wavy
Equal variances not assumed
-2.652 76.106 .010 -.453 .171 -.793 -.113
Male circular
Equal variances
assumed
7.906 .007
-2.087 44 .043 -1.913 .917 -3.761 -.066
Equal variances not assumed
-2.786 31.300 .009 -1.913 .687 -3.313 -.513
Female circular
Equal variances
assumed
IJSRR, 7(4) Oct. – Dec., 2018 Page 2333
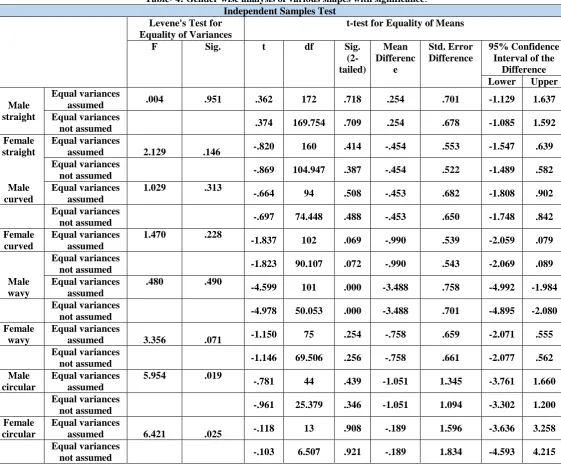
Lengths of the patterns showed the least significance with p values > 0.05 except the male
wavy pattern length which showed high significance (p value = 0.00). [Table 3 and 4]
Table- 3 Gender wise mean of lengths of various shapes. Group Statistics
Country Male Straight
N Mean Std. Deviation Std. Error Mean
Male Straight Indian 96 9.51 5.186 .529
African 78 9.26 3.742 .424
Female Straight Indian 113 8.58 3.368 .317
African 49 9.03 2.905 .415
Male Curved Indian 33 7.85 2.852 .496
African 63 8.30 3.331 .420
Female Curved Indian 60 8.44 2.657 .343
African 44 9.43 2.792 .421
Male Wavy Indian 26 8.87 2.953 .579
African 77 12.35 3.462 .395
Female Wavy Indian 39 11.29 2.499 .400
African 38 12.05 3.246 .527
Male Circular Indian 11 6.26 2.778 .837
African 35 7.31 4.162 .704
Female Circular Indian 6 6.83 4.191 1.711
African 9 7.02 1.979 .660
Equal variances not assumed
-.284 7.001 .784 -.194 .684 -1.811 1.422
widths
Equal variances
assumed
77.085 .000
-8.512 761 .000 -.943 .111 Lower Upper
77.085 .000
-8.512 761 .000 -.943 .111 -1.160 -.726
Length Primary
Equal variances
assumed
7.213 .007
-1.233 682 .218 -.439 .356 -1.137 .260
Equal variances not assumed
-1.235 505.207 .217 -.439 .355 -1.136 .259
Length second
Equal variances
assumed
1.007 .318
.112 86 .911 .013 .120 -.224 .251
Equal variances not assumed
Vaid Vasu et al., IJSRR 2018, 7(4), 2325-2337
IJSRR, 7(4) Oct. – Dec., 2018 Page 2334
Table- 4: Gender wise analysis of various shapes with significance.
Independent Samples Test Levene's Test for
Equality of Variances
t-test for Equality of Means
F Sig. t df Sig.
(2-tailed) Mean Differenc e Std. Error Difference 95% Confidence Interval of the
Difference
Lower Upper
Male straight
Equal variances
assumed .004 .951 .362 172 .718 .254 .701 -1.129 1.637
Equal variances
not assumed .374 169.754 .709 .254 .678 -1.085 1.592
Female straight
Equal variances
assumed 2.129 .146 -.820 160 .414 -.454 .553 -1.547 .639
Equal variances
not assumed -.869 104.947 .387 -.454 .522 -1.489 .582
Male curved
Equal variances assumed
1.029 .313
-.664 94 .508 -.453 .682 -1.808 .902
Equal variances
not assumed -.697 74.448 .488 -.453 .650 -1.748 .842
Female curved
Equal variances assumed
1.470 .228
-1.837 102 .069 -.990 .539 -2.059 .079
Equal variances
not assumed -1.823 90.107 .072 -.990 .543 -2.069 .089
Male wavy
Equal variances assumed
.480 .490
-4.599 101 .000 -3.488 .758 -4.992 -1.984
Equal variances
not assumed -4.978 50.053 .000 -3.488 .701 -4.895 -2.080
Female wavy
Equal variances
assumed 3.356 .071 -1.150 75 .254 -.758 .659 -2.071 .555
Equal variances
not assumed -1.146 69.506 .256 -.758 .661 -2.077 .562
Male circular
Equal variances assumed
5.954 .019
-.781 44 .439 -1.051 1.345 -3.761 1.660
Equal variances
not assumed -.961 25.379 .346 -1.051 1.094 -3.302 1.200
Female circular
Equal variances
assumed 6.421 .025 -.118 13 .908 -.189 1.596 -3.636 3.258
Equal variances
not assumed -.103 6.507 .921 -.189 1.834 -4.593 4.215
Table 5 & 6 of statistical analysis shows that Africans have higher no. of curved, wavy and circular patterns which showed high significance (p >0.05) Among the Indians straight patterns are higher than the Africans in number (P=0.00, high significance with t-test).
IJSRR, 7(4) Oct. – Dec., 2018 Page 2335
Table- 5: Mean of number of different types of patterns Group Statistics
Country N Mean Std. Deviation Std. Error Mean
Straight Indian 35 5.89 2.285 .386
African 35 3.74 2.105 .356
Curve Indian 35 2.26 1.738 .294
African 35 3.11 1.711 .289
Wavy Indian 35 1.74 1.358 .230
African 35 2.69 1.388 .235
Circular Indian 35 .46 .701 .118
African 35 1.34 1.571 .266
Converg Indian 35 .14 .355 .060
African 35 .20 .406 .069
Diverg Indian 35 .74 .886 .150
African 35 .37 .598 .101
Table- 6: Analysis of number of different types of patterns with significance.
DISCUSSION:
Based on these results it can be concluded that there was a huge differences in the width of
the patterns in African and Indian population which infers that Africans have very broad and thick
patterns which was statistically too found out to be highly significant. African rugae patterns are
quite elevated which was very well appreciated visually in fig -3. As far as the lengths are concerned Independent Samples Test
Levene's Test for Equality of
Variances
t-test for Equality of Means
F Sig. t df Sig.
(2-tailed)
Mean Difference
Std. Error Difference
95% Confidence Interval of the
Difference
Lower Upper
straight
Equal variances assumed .137 .712 4.080 68 .000 2.143 .525 1.095 3.191
Equal variances not
assumed 4.080 67.548 .000 2.143 .525 1.095 3.191
curve
Equal variances assumed .023 .880 -2.079 68 .041 -.857 .412 -1.680 -.035
Equal variances not
assumed -2.079 67.984 .041 -.857 .412 -1.680 -.035
wavy
Equal variances assumed 1.023 .315 -2.872 68 .005 -.943 .328 -1.598 -.288
Equal variances not
assumed -2.872 67.966 .005 -.943 .328 -1.598 -.288
circular
Equal variances assumed 7.152 .009 -3.047 68 .003 -.886 .291 -1.466 -.306
Equal variances not
assumed -3.047 47.011 .004 -.886 .291 -1.471 -.301
converg
Equal variances assumed 1.597 .211 -.627 68 .533 -.057 .091 -.239 .125
Equal variances not
assumed -.627 66.819 .533 -.057 .091 -.239 .125
diverg
Equal variances assumed 8.263 .005 2.055 68 .044 .371 .181 .011 .732
Equal variances not
Vaid Vasu et al., IJSRR 2018, 7(4), 2325-2337
IJSRR, 7(4) Oct. – Dec., 2018 Page 2336
Africans have higher length measurements in wavy, straight and curved patterns. Number of Straight
patterns are found to be more prevalent in Indian population as compared to Africans whereas
curved, wavy and circular were found to be predominant in Africans as compared to Indians. For the
number of patterns, this study shows that Africans have higher no. of curved, wavy and circular
which are highly distinguishable and showed high significance Among the Indians straight patterns
are higher than the Africans in number.
Rugae patterns are a convenient tool for human identification in a mass disaster situations
because of their high specificity to different racial groups.7 Several studies have been reported which
infers that rugae patterns are significantly associated with the ethnicity thereby indicating a valuable
finding in forensic investigations especially in disasters.3
Hauser et al., in 1989 performed a study to compare the rugae patterns of Swazi and Greek
population and they found definite differences in the patterns between the two populations. This
could be because of development of rugae and growth of the palate.4 Several studies reported
inter-racial differences in palatal rugae even in relatively similar population groups which may help to
identify the population especially in disasters.1, 9 But no study has been done to distinguish amongst
the African and Indian on the basis of their rugae pattern. This study was aimed to analyse the
differences in the number of patterns, their lengths and widths among the Indian and African
population and highly significant results were obtained. Comparison was even seen amongst genders
of both the population groups ie. Africans males and females compared with Indian males and
females respectively and significant results were obtain in some of the patterns specially their widths
which showed highly significant results whereas lengths were insignificant. Apart from these
findings found by previous studies on the Indian population, they also found unification rugae
pattern to be very rare.10 Same was found in this study too for both the population groups as per
sample size taken. This study has a limitation of less sample size gender wise. Further studies can be
done with a larger sample size to establish much more significant differences amongst the sexes on a
vast level.
CONCLUSION:
Palatal rugae patterns are unique to each individual as well as for the races too and so they
can be used as population identification tool at the time of adversity. As per this study it can be
concluded that rugae patterns are significantly different for Indian and African population based on
the numbers, shapes, lengths and width and amongst the sexes too. Also, African patterns are
remarkably unique on visual appraisal for they are very thick, elevated and broader in width which
IJSRR, 7(4) Oct. – Dec., 2018 Page 2337
whereas Indian rugae pattern are very thin and slender mostly having the straight and wavy patterns
more. Further studies can definitely be done with larger samples to obtain much more significant
differences among various other aspects too. Finally we conclude that rugae can be used as
consistent tool in forensic identification and even serve as a dental biometric tool too.
REFERENCES:
1. Kapali S, Townsend G, Richards L, Parish,T. Palatal rugae patterns in Australian Aborigines
and Caucasians, Australian Dental Journal.1997; 42(2):129-133.
2. Byatnal A, Byatnal A, Kiran A R, Samata Y, Guruprasad Y, & Telagi N. Palatoscopy: An
adjunct to forensic odontology: A comparative study among five different populations of
India, Journal of natural science, biology, and medicine. 2014; 5(1): 52-5.
3. Janardhanam D, Nalliappan G, Thukanaykanpalayam RY, Vadivel I, Arumugasamy N,
Akbarsait, R. Palatal rugae patterens in individuals identification: A forensic study',
International Journal of Current Advanced Research. 2017; 6(1): 1723-1725.
4. Hauser G, Daponte A, & Roberts MJ. Palatal rugae, Journal of anatomy.1989; 165:237-49.
5. Lysel L. and Brayton V. ‘Plicae palatinae transversae and papilla incisiva in man: A
morphologic and genetic study’, Acta Odontologica Scandinavica. 1955; 13(18):135-137.
6. Peavy DC Jr, Kendrick GS. ‘The effects of tooth movement on the palatine rugae’, Journal of
Prosthetic Dentistry.1967; 18(5): 36-42.
7. Deeksha, KS, Sheetal M, Hegde DD, Patil A, Edake D, Unadkat H. ‘Palatal Rugae Patterns
as a Bioindicator for Forensic Identification in Kodava and Tibetan Populations of India’,
Journal of International Oral Health and International Society of Preventive and Community
Dentistry, 2015; 7(2): 57–59.
8. Ghanta SB, T. Sreenivasa B, N Govindraj, K. 'Characteristics of Palatal Rugae Patterns in
West Godavari Population of India', Journal of Clinical Diagnosis and Research, 2013; 7(10):
2356–2359.
9. Muthusubramanian M, Limson K S, Julian R. ‘Analysis of rugae in burn victims and
cadavers to simulate rugae identification in cases of incineration and decomposition’,
Journal of Forensic Odonto-Stomatology, 2005; 23(1):26-29
10. Byatnal, A., Byatnal, A., Kiran, A. R., Samata, Y, Guruprasad, Y, Telagi, N. ‘Palatoscopy:
An adjunct to forensic odontology: A comparative study among five different populations of
India’, Journal of natural science, biology, and medicine, 2014; 5(1): 52-5.
11. Thomas, C.J and Kotze, T.J. ‘Palatal rugae pattern: A new classification’, Journal of Dental