R E S E A R C H
Open Access
Context matters: measuring implementation
climate among individuals and groups
Sara R Jacobs
1*, Bryan J Weiner
2and Alicia C Bunger
3Abstract
Background:It has been noted that implementation climate is positively associated with implementation effectiveness. However, issues surrounding the measurement of implementation climate, or the extent to which organizational members perceive that innovation use is expected, supported and rewarded by their organization remain. Specifically, it is unclear whether implementation climate can be measured as a global construct, whether individual or group-referenced items should be used, and whether implementation climate can be assessed at the group or organizational level.
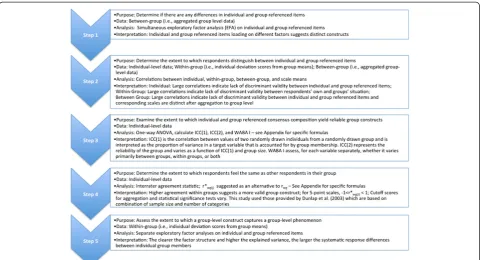
Methods:This research includes two cross-sectional studies with data collected via surveys at the individual level. The first study assessed the implementation climate perceptions of physicians participating in the National Cancer Institute’s (NCI) Community Clinical Oncology Program (CCOP), and the second study assessed the perceptions of children’s behavioral health clinicians implementing a treatment innovation. To address if implementation climate is a global construct, we used confirmatory factor analysis. To address how implementation climate should be measured and at what level, we followed a five-step framework outlined by van Mierlo and colleagues. This framework includes exploratory factor analysis and correlations to assess differences between individual and group-referenced items and intraclass correlations, interrater agreements, and exploratory factor analysis to determine if implementation climate can be assessed at the organizational level.
Results:The confirmatory factor analysis demonstrated that implementation climate is a global construct
consisting of items related to expectations, support and rewards. There are mixed results, however, as to whether implementation climate should be measured using individual or group-referenced items. In our first study, where physicians were geographically dispersed and practice independently, there were no differences based on the type of items used, and implementation climate was an individual level construct. However, in the second study, in which clinicians practice in a central location and interact more frequently, group-referenced items may be appropriate. In addition, implementation climate could be considered an organizational level construct.
Conclusions:The results are context-specific. Researchers should carefully consider the study setting when measuring implementation climate. In addition, more opportunities are needed to validate this measure and understand how well it predicts and explains implementation effectiveness.
Keywords:Implementation climate, Organizational context, Measurement of global constructs, Measurement of group level phenomenon
* Correspondence:[email protected]
1Department of Health Policy and Management, Gillings School of Global Public Health, 1101 McGavran-Greenberg Hall, CB #7411, University of North Carolina at Chapel Hill, Chapel Hill, NC 27599-7411, USA
Full list of author information is available at the end of the article
Background
Implementation climate has emerged as an important con-struct in implementation science. It first appeared in 1996 in Klein and Sorra’s theory of innovation implementation, where the authors defined it as organizational members’
‘shared summary perceptions of the extent to which their use of a specific innovation is rewarded, supported, and expected within their organization’ [1]. According to the theory, implementation climate, along with fit between the innovation and the organizational members’ values, are key predictors regarding the consistency and quality of organizational members’ use of a specific innovation [1]. Sustained and systematic use of an innovation can deter-mine the ultimate benefits an organization receives by implementing a given innovation (e.g., increased profitabil-ity, employee morale, productivity) [1]. Implementation climate has subsequently been discussed in a landmark systematic review of the diffusion of innovations in health services research [2] and has also been incorporated into the Consolidated Framework for Implementation Research [3]. Although empirical research has lagged behind theor-etical discussion, the construct has been considered in several studies of implementation in health and human service agencies, schools, and manufacturing organizations [4-11]. Evidence from this mix of qualitative and quantita-tive studies finds that implementation climate is linked to consistent, high-quality innovation use, as Klein and Sorra predicted. In a recent commentary, we noted that the con-struct has the potential to bring theoretical and empirical coherence to a growing body of research on organizational barriers and facilitators of effective implementation [12].
Although implementation climate has garnered theoret-ical attention and empirtheoret-ical support, no standard approach for measuring the construct exists. In prior work, we iden-tified three measurement issues that hinder efforts to es-tablish construct validity, compare results across studies, and accumulate scientific knowledge [12]. First, can imple-mentation climate be measured as a global construct? Klein and Sorra postulate that implementation climate re-flects organizational members’gestalt perceptions of the expectations, support and rewards for innovation use [1]. Although some studies have used factor analysis to deter-mine whether the three dimensions of implementation cli-mate together form a global construct [4,6], these studies have used very specific items related to information sys-tems implementation (e.g.,‘help desk’availability) that have questionable relevance for implementation research in health and human services. Other studies have examined implementation climate dimensions separately [5] rather than as a global construct or have measured implementa-tion climate with items that do not reflect the three di-mensions [13].
Second, should implementation climate be measured with individually referenced items or group-referenced
items? Climate researchers disagree about whether climate constructs are better measured as the aggregation of indi-viduals’perceptions of their own experience (e.g.,‘I am ex-pected to use the innovation’) or individuals’perceptions of collective experience (e.g.,‘We are expected to use the innovation’) [12]. Some scholars contend that individually referenced items encourage respondents to look within and ignore collective experience [4,5] while others argue that respondents are more accurate judges of their own experience than the experience of the group [12,14]. To date, studies of implementation climate have used group-referenced items [4-6,13]; however, studies involving other climate constructs in implementation research —such as Glisson’s Organizational and Social Context— have used individually referenced items [15-19]. Some evidence suggests that individually referenced items and group-referenced items measure distinct constructs [20,21]; however, it is unknown whether this distinction makes a difference in the measurement of implementation climate.
Lastly, can implementation climate be reliably and val-idly measured as an organization-level construct? Klein and Sorra regard implementation climate as a‘shared team property’, meaning that organizational members share suf-ficiently similar perceptions of implementation climate and that those perceptions can be characterized as a whole [1]. Their theory is pitched at an organizational level, whereby organizational members’ shared perceptions of the expectations, support and rewards for innovation use determines the overall, pooled or aggregate consistency and quality of innovation use. However, prior studies offer limited evidence that implementation climate can be reli-ably and validly measured as an organization-level con-struct using aggregated data collected from individuals. Some studies have not aggregated implementation climate perceptions to the organizational level [5,6] and, in some cases, group-referenced items were used to explain individual-level behavior [5,6]. Since implementation cli-mate is conceived as an organization-level construct, it is important to verify that sufficient within-group agreement exists to justify aggregating individuals’ climate percep-tions to the organizational level of analysis.
Methods
We developed a brief instrument consisting of items that were specific enough to capture the three dimensions of implementation climate, yet generic enough to apply broadly to implementation of health and human service innovations. We then fielded the instrument in two dif-ferent study settings because theory and research suggest that the measurement of implementation climate might be sensitive to features of the organizational and social context of implementation [1,12,20]. These two settings provided a distinct set of organizational and environ-mental factors to examine implementation climate. Our results indicate that implementation climate can be mea-sured as a global construct; however, the importance of reference-group wording of survey items and the reli-ability and validity of the implementation climate as an organization-level construct are somewhat dependent on context.
Measures
Using Klein and Sorra’s [1] original definition of imple-mentation climate, we created an instrument consisting of six items, two items per climate dimension (i.e., expected, supported and rewarded). We generated the items by reviewing the literature for existing items, consulting pro-gram officials, and drawing on prior studies of CCOP and learning collaboratives for substantive content, and follow-ing published guidelines for measurfollow-ing organizational con-structs generally and implementation climate specifically. A survey methodologist provided an expert review of item wording, item ordering, response options, survey length, cognitive burden, social desirability, and survey format-ting. Table 1 lists the items used in the two studies. We kept item wording as consistent as possible across the studies, but permitted some tailoring to account for differ-ences in study participants, interventions, and implemen-tation context. In both studies, the items were phrased
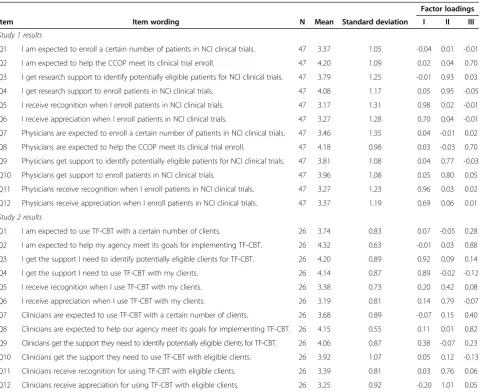
Table 1 Exploratory factor analysis results
Factor loadings
Item Item wording N Mean Standard deviation I II III
Study 1 results
Q1 I am expected to enroll a certain number of patients in NCI clinical trials. 47 3.37 1.05 -0.04 0.01 -0.01
Q2 I am expected to help the CCOP meet its clinical trial enroll. 47 4.20 1.09 0.02 0.04 0.70
Q3 I get research support to identify potentially eligible patients for NCI clinical trials. 47 3.79 1.25 -0.01 0.93 0.03
Q4 I get research support to enroll patients in NCI clinical trials. 47 4.08 1.17 0.05 0.95 -0.05
Q5 I receive recognition when I enroll patients in NCI clinical trials. 47 3.17 1.31 0.98 0.02 -0.01
Q6 I receive appreciation when I enroll patients in NCI clinical trials. 47 3.27 1.28 0.70 0.04 -0.01
Q7 Physicians are expected to enroll a certain number of patients in NCI clinical trials. 47 3.46 1.35 0.04 -0.01 0.02
Q8 Physicians are expected to help the CCOP meet its clinical trial enroll. 47 4.18 0.98 0.03 -0.03 0.70
Q9 Physicians get support to identify potentially eligible patients for NCI clinical trials. 47 3.81 1.08 0.04 0.77 -0.03
Q10 Physicians get support to enroll patients in NCI clinical trials. 47 3.96 1.08 0.05 0.80 0.05
Q11 Physicians receive recognition when I enroll patients in NCI clinical trials. 47 3.27 1.23 0.96 0.03 0.02
Q12 Physicians receive appreciation when I enroll patients in NCI clinical trials. 47 3.37 1.19 0.69 0.06 0.01
Study 2 results
Q1 I am expected to use TF-CBT with a certain number of clients. 26 3.74 0.83 0.07 -0.05 0.28
Q2 I am expected to help my agency meet its goals for implementing TF-CBT. 26 4.32 0.63 -0.01 0.03 0.88
Q3 I get the support I need to identify potentially eligible clients for TF-CBT. 26 4.20 0.89 0.92 0.09 0.14
Q4 I get the support I need to use TF-CBT with my clients. 26 4.14 0.87 0.89 -0.02 -0.12
Q5 I receive recognition when I use TF-CBT with my clients. 26 3.38 0.73 0.20 0.42 0.08
Q6 I receive appreciation when I use TF-CBT with my clients. 26 3.19 0.81 0.14 0.79 -0.07
Q7 Clinicians are expected to use TF-CBT with a certain number of clients. 26 3.68 0.89 -0.07 0.15 0.40
Q8 Clinicians are expected to help our agency meet its goals for implementing TF-CBT. 26 4.15 0.55 0.11 0.01 0.82
Q9 Clinicians get the support they need to identify potentially eligible clients for TF-CBT. 26 4.06 0.87 0.38 -0.07 0.23
Q10 Clinicians get the support they need to use TF-CBT with eligible clients. 26 3.92 1.07 0.05 0.12 -0.13
Q11 Clinicians receive recognition for using TF-CBT with eligible clients. 26 3.39 0.81 0.03 0.76 0.06
first as individually referenced items, and then repeated as group-referenced.
Study setting and sample
Study 1. The National Cancer Institute’s (NCI) Commu-nity Clinical Oncology Program (CCOP) is a provider-based research network that conducts clinical trials in community-based practice settings and translates re-search results into clinical practice. The NCI’s CCOP network is a three-way partnership involving the NCI’s Division of Cancer Prevention (NCI/DCP), selected can-cer centers and clinical cooperative groups (CCOP Re-search Bases), and community-based network hospitals and physician practices (CCOP Organizations) [22-26]. NCI/DCP provides overall direction and funding for community hospitals and physician practices to partici-pants in clinical trials in cancer treatment, prevention and control; CCOP Research Bases design the clinical trials and analyze the results; and CCOP Organizations enroll patients, collect data, and disseminate study find-ings [22]. As of April 2013, there are 47 CCOP Organi-zations across 28 states, the District of Columbia, and Puerto Rico. The CCOP network includes over 450 hos-pitals and more than 2,700 physicians. On average, CCOP organizations have 10 participating community hospitals and physician practices, and 48 participating oncologists, surgeons, and other physicians.
We obtained data on CCOP physicians’ perceptions of implementation climate for conducting clinical trials in community practice settings (an innovation for community-based physicians) through a survey admin-istered in the fall of 2011. The sampling frame included all CCOP-affiliated physicians eligible to enroll patients in clinical trials. Responses were collected between October 2011 and January 2012. One week after sending potential respondents a postcard announcing the survey and highlighting its importance to NCI, physicians were sent a cover letter explaining the goals of the survey, the survey itself, a self-addressed and stamped return enve-lope, and a $50 Visa gift card as an incentive to complete the survey. Physicians were also able to complete the sur-vey online via a unique access code provided in the mail-ings. A thank you or reminder postcard was then sent the following week. Approximately three weeks after the first mailing, non-respondents received a second copy of the survey, cover letter, and return envelope. Lastly, we con-tacted CCOP PIs and CCOP Administrators to email the non-responding physicians affiliated with their CCOP requesting them to complete the survey. This study was approved by the Institutional Review Board at the Univer-sity of North Carolina at Chapel Hill.
Study 2. In 2011, youth-serving agencies in a medium-sized Midwestern city were invited to participate in an initiative led by the county government to implement
trauma-focused cognitive behavioral therapy (TF-CBT). TF-CBT is a widely disseminated manualized treatment with strong evidence supporting its effectiveness for re-ducing post-traumatic stress disorder symptoms among children and youth [27-29]. The invited agencies sent im-plementation teams (3 to 10 employees) to a year-long TF-CBT Learning Collaborative, an adaptation of the In-stitute for Healthcare Improvement’s Breakthrough Series Collaborative [30,31]. To accommodate agency interest, four Learning Collaboratives were conducted.
The Learning Collaboratives brought participants to-gether for three face-to-face learning sessions. We obtained data on implementation team members’ perceptions of implementation climate through a paper-based survey ad-ministered in person during the third and final learning session of each of the four Collaboratives. At the beginning of the third learning session, a member of the research team gave an overview of the study, obtained consent, and distributed the survey to the team members present, and subsequently collected completed surveys. Responses were collected from January through September 2012. This study was approved by the Institutional Review Boards at the Ohio State University and the University of North Carolina at Chapel Hill.
Data analysis
To determine whether implementation climate can be measured as a global construct, we used confirmatory fac-tor analysis (CFA) to ascertain whether implementation climate is comprised of three factors (expected, supported and rewarded). To assess whether implementation climate should be measured by individually referenced items or group-referenced items and as an organization-level con-struct, we employed van Mierlo and colleagues’five-step procedure for composing group-level constructs from individual-level survey data [32] (Figure 1). Analysis details are discussed in detail within the results section. All ana-lyses were conducted in Stata 12 [33].
Results
Response rates and participant characteristics
Study 2. Of the 155 team members from 26 behavioral health agencies that participated in the final learning ses-sion, 137 responded (88% response rate). Most respon-dents were direct service clinicians (63%), followed by supervisors (21%) and senior leaders (14%). Nearly all (94%) held a master’s degree or higher in social work (51%), counseling (15%), psychology (12%), or other helping profession. Respondents had extensive experi-ence serving families and children, with 64% reporting five years’ or more experience. However, many partici-pants were new to their agencies; 42% were employed at their agency for a year or less at the time they began participating in the Collaborative.
Implementation climate as a global construct
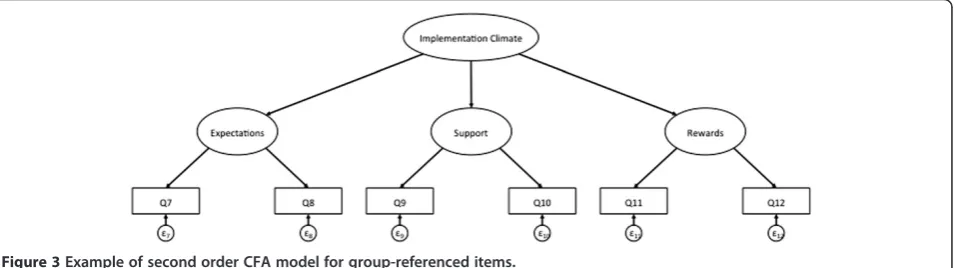
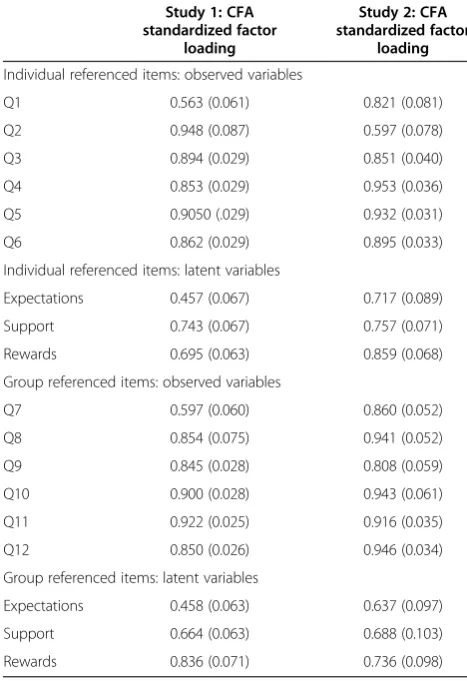
To determine if implementation climate can be mea-sured as global construct consisting of expectations, re-wards and support, we ran a series of CFAs to fit a second-order factor structure to the data in each study, with separate analyses for the individually and group-referenced items (Figures 2 and 3). In both studies, the second-order CFA model for the individually referenced items converged and demonstrated strong fit (Table 2). Based on model fit and the resulting modifications indi-ces (i.e., the minimum that the chi-square statistic is ex-pected to decrease if the corresponding parameter is no longer assumed to be fixed at zero), we did not need to make any post-hoc modifications to the model in either study [34-36].
For the group-referenced items in both studies, the model fit and modifications indices indicated that we needed to make post-hoc modifications. CFA is an itera-tive process in which model fit is improved by using the-ory and modifications indices either to add additional pathways between variables or to allow items to co-vary [34-36]. For example, items included may share common variation that is not explained by any of the proposed re-lationships in the model. Therefore, post-hoc modifica-tions were only added if they could be theoretically justified and improved model fit.
CBT with eligible clients.’ We hypothesized that these items might co-vary because agency goals for implementa-tion were closely tied to individual clinicians’ability to use TF-CBT with at least five clients in order to be eligible for inclusion on a local roster of trained TF-CBT clinicians.
In both studies, CFA results indicate that implementation climate can be measured as a global construct using either individually referenced items or group-referenced items. We generated global implementation climate scales using the standardized factor loading from the second-order CFA models. For example, in constructing each scale, we weighted each item based on its standardized factor load-ing before takload-ing the average across all items. These global scales are used in Steps 2 to 4 in the analysis below.
Measurement of implementation climate
Step 1. Similarity of constructs through factor analysis between groups
The goal of Steps 1 and 2 was to determine whether indi-vidual and group referenced items measure the same con-struct. The extent to which the individually referenced and group-referenced items yield distinct group-level con-structs was examined with exploratory factor analysis (EFA) of group-level data (47 CCOPs in Study 1; 26 teams in Study 2). It is important to conduct the factor analysis on the group level data because a structure in which the individually and group-referenced items sys-tematically load on different components indicates that
they represent distinct group constructs [32]. In Study 1, group-level EFA yielded three factors explaining 94% of the variance. Individually referenced items that load in a block on a different factor from group-referenced items indicate that the items measure different con-structs. However, following oblique rotation, the indi-vidually referenced and group-referenced items loaded in pairs on the same factor (Table 1). For example, the two individually referenced items measuring the ‘rewarded’ dimension of implementation climate loaded highly on the first factor, as did the two group-referenced items measuring the same dimension. Only one individually ref-erenced item measuring the‘expected’dimension of imple-mentation climate and its corresponding group-referenced item loaded highly on the third factor. The other individu-ally referenced item measuring the ‘expected’ dimension and its corresponding group-referenced item did not load highly on any of the first three factors in the EFA solution. The factor loadings for the pair of ‘expected’ items may have diverged because most CCOPs did not set minimum enrollment requirements for individual physicians. Overall, the group-level EFA results in Study 1 do not indicate that individually referenced and group-referenced items are measuring different constructs.
In Study 2, group-level EFA also yielded three factors explaining 89% of the variance (Table 1). Individually referenced and group-referenced items did not load in a block on different factors. Instead, items exhibited a Figure 2Example of second order CFA model for individually referenced items.
mixed pattern of factor loadings even after oblique rota-tion. For example, both individually referenced items measuring the‘supported’ dimension of implementation climate loaded highly onto the first factor, yet neither of the corresponding group-referenced items loaded onto any factor. Like Study 1, Study 2 results do not indicate that individually referenced and group-referenced items are measuring different constructs.
Step 2. Similarity of constructs through correlations
We further explored differences between individually ref-erenced and group-refref-erenced items with correlations, where small correlation coefficients indicate that individu-ally referenced and group-referenced items measure dis-tinct constructs. Vice versa, larger correlations indicate that individual and group-referenced items are measuring the same construct. The correlations between individually
referenced and group-referenced items among individuals indicate the extent to which individuals differentiate their own situation from that of the other individuals within their CCOP or team. Correlations at the individual-level can be distorted, however, because they do not account for the clustering in the data structure. The correlations between individually referenced and group-referenced items within groups (i.e., individual deviations from group means) correct for clustering and indicate the extent to which individuals distinguish their individual perception of their own situation from that of their group situation as a whole, rather than other physicians or clinicians within the group. Lastly, the correlation of individually referenced and group-referenced items between groups indicates the extent to which these items are distinct after aggregating the individual responses to the group level.
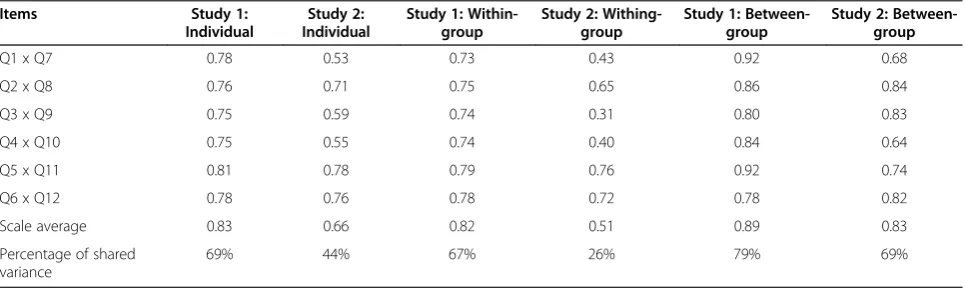
For Study 1, the correlations for each item pair and for the scale means at the individual, within-group, and between-group levels are moderately high, indicating a relatively high degree of shared variance between the in-dividually referenced and group-referenced measures (Table 3). Focusing on the scale means, the percentage of shared variance between individually referenced and group-referenced measures of implementation climate was 69% at the individual level (r = 0.82, p <0.01), 67% at the within-group level (r = 0.81, p <0.01), and 79% at the between-group level (r = 0.90, p <0.01). These results corroborate the results of Step 1: individually referenced and group-referenced items do not appear to be measur-ing different constructs for physicians in the CCOP.
For Study 2, the correlations for each pair and the scale means are much lower than in Study 1, especially for indi-vidual and within-group correlations. Focusing on the scale means, the percentage of shared variance between indi-vidually referenced and group-referenced measures of im-plementation climate was only 44% at the individual level (r = 0.66, p <0.01), 26% at the within-group level (r = 0.51, p <0.01), and 69% at the between-group level (r = 0.83, p <0.01). In contrast to Study 1, Study 2 results suggest in-dividually referenced items and group-referenced items may measure different constructs.
Implementation climate at the organizational level
Step 3. Construct validity through variance within and between groups analysis
The goal of the remaining three steps was to assess whether implementation climate can be aggregated to the organizational level to measure implementation climate of the entire organization. Ideally, a reliable organization-level measure should differentiate between organizations. The extent to which individually referenced and group-referenced items produce reliable organization-level constructs was examined by computing two intraclass cor-relation coefficients—ICC(1) and ICC(2)—from a
one-Table 2 Confirmatory factor analysis results
Study 1: CFA standardized factor
loading
Study 2: CFA standardized factor
loading
Individual referenced items: observed variables
Q1 0.563 (0.061) 0.821 (0.081)
Q2 0.948 (0.087) 0.597 (0.078)
Q3 0.894 (0.029) 0.851 (0.040)
Q4 0.853 (0.029) 0.953 (0.036)
Q5 0.9050 (.029) 0.932 (0.031)
Q6 0.862 (0.029) 0.895 (0.033)
Individual referenced items: latent variables
Expectations 0.457 (0.067) 0.717 (0.089)
Support 0.743 (0.067) 0.757 (0.071)
Rewards 0.695 (0.063) 0.859 (0.068)
Group referenced items: observed variables
Q7 0.597 (0.060) 0.860 (0.052)
Q8 0.854 (0.075) 0.941 (0.052)
Q9 0.845 (0.028) 0.808 (0.059)
Q10 0.900 (0.028) 0.943 (0.061)
Q11 0.922 (0.025) 0.916 (0.035)
Q12 0.850 (0.026) 0.946 (0.034)
Group referenced items: latent variables
Expectations 0.458 (0.063) 0.637 (0.097)
Support 0.664 (0.063) 0.688 (0.103)
Rewards 0.836 (0.071) 0.736 (0.098)
Standard Error in parenthesis.
Study 1 Individual Referenced:X2 = 0.2391 CFI = 0.998; TLI = 0.996; SRMR = 0.015; RMSEA = 0.027.
Study 1 Group Referenced:X2 = 0.1146 CFI = 0.997; TLI = 0.990; SRMR = 0.013 RMSEA = 0.040.
Study 2 Individual Referenced:X2 = 0.6650 CFI = 1.00; TLI = 1.01; SRMR = 0.012; RMSEA = 0.00.
way random-effects analysis of variance. The higher ICC (1) and ICC(2), the greater the extent to which climate perceptions are shared by organizational members and the more reliable the organization-level construct.
In Study 1, the ICCs for the group-referenced imple-mentation climate scale are slightly larger than those for the individually referenced scale: 0.08 versus 0.07 for ICC(1), and 0.48 versus 0.44 for ICC(2) (Table 4). Al-though there is some clustering in the data, it seems that much of the variance in implementation climate percep-tions resides at the individual level. The absolute values for the ICC(2) are also modest in size and fall below the commonly applied 0.80 cutoff [37].
In Study 2, the ICC(1) and ICC(2) values are larger than those in Study 1 (Table 4). Like Study 1, the ICCs for the group-referenced implementation climate scale are slightly larger than those for the individually refer-enced scale: 0.33 versus 0.29 for ICC(1), and 0.70 versus 0.66 for ICC(2). Although the values for the ICC(2) fall below the 0.80 cutoff, implementation climate is a more reliable organization-level construct among clinicians in children’s behavioral health organizations than for physi-cians in CCOPs.
Step 4. Construct validity assessment of agreement among group members
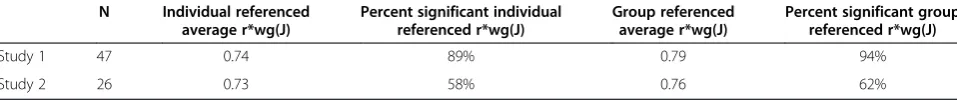
The validity of organization-level constructs was exam-ined by calculating interrater agreement, or the extent to which group members provide identical ratings of imple-mentation climate. Organization-level constructs created from individual-level data have greater validity when group members provide similar ratings in an absolute sense, or at least more similar than random responses [20,38,39]. A common measure of interrater agreement is the r*wg(J)index for multiple items.
In Study 1, the average r*wg(J)values for all 47 CCOPs
were 0.74 for the individually referenced implementation
climate scale and 0.79 for the group-referenced imple-mentation climate scale (Table 5). A total of 66% of the CCOPs showed a higher r*wg(J)for group-referenced
im-plementation climate scale than for the individually ref-erenced implementation climate scale; however, for most CCOPs, the absolute difference was small, ranging from 0.00 to 0.24 (mean difference = 0.07). Based on Dunlap and colleagues’ [40] suggested significance levels for various combinations of sample size and number of response categories, 89% of CCOPs showed significant
r*wg(J) values for individually referenced implementation
climate scale, and 94% showed significant r*wg(J) values
for the group-referenced implementation climate scale. Study 1 results suggest slightly higher within-group agreement for the group-referenced implementation cli-mate scale compared to the individually referenced im-plementation climate scale.
In Study 2, the average r*wg(J)values for the 26
imple-mentation teams in the children’s behavioral health agencies were similar to those obtained in Study 1. The average r*wg(J) value was 0.73 for the individually
refer-enced implementation climate scale and 0.76 for the group-referenced implementation climate scale. Unlike Study 1, a slight majority of teams (54%) showed a higher r*wg(J)for the individually referenced
implementa-tion climate scale than for the group-referenced imple-mentation climate scale, although the absolute difference was also small (mean difference = 0.16). The teams with the greatest absolute difference tended to have greater
r*wg(J) for the group items than the individual items,
in-dicating that members of these teams reported wide vari-ation in their perceptions about their individual experiences, but rated the general experience of clinicians in their agencies similarly. The large discrepancy in r*wg(J)
values tended to occur in generalist agencies or those in non-traditional settings. In these settings, it may be more difficult for clinicians to implement TF-CBT. Based on
Table 3 Correlations between items and scales within and between groups
Items Study 1:
Individual
Study 2: Individual
Study 1: Within-group
Study 2: Withing-group
Study 1: Between-group
Study 2: Between-group
Q1 x Q7 0.78 0.53 0.73 0.43 0.92 0.68
Q2 x Q8 0.76 0.71 0.75 0.65 0.86 0.84
Q3 x Q9 0.75 0.59 0.74 0.31 0.80 0.83
Q4 x Q10 0.75 0.55 0.74 0.40 0.84 0.64
Q5 x Q11 0.81 0.78 0.79 0.76 0.92 0.74
Q6 x Q12 0.78 0.76 0.78 0.72 0.78 0.82
Scale average 0.83 0.66 0.82 0.51 0.89 0.83
Percentage of shared variance
69% 44% 67% 26% 79% 69%
Study 1:NindividualandNwithin= 470;Nbetween= 47.
Study 2:NindividualandNwithin= 135;Nbetween= 26.
Dunlap and colleagues’[40] suggested significance levels, only 40% of teams showed significant r*wg(J)values for the
individually referenced implementation climate scale, and 60% of teams showed significant r*wg(J) values for the
group-referenced implementation climate scale. These percentages are smaller than those obtained in Study 1, perhaps because significance levels vary based on team size. The average team in Study 2 is smaller (mean = 7) than the average CCOP in Study 1. As in Study 1, Study 2 results suggest a slightly higher within-group agreement for the group-referenced implementation climate scale compared to the individually referenced implementa-tion climate scale.
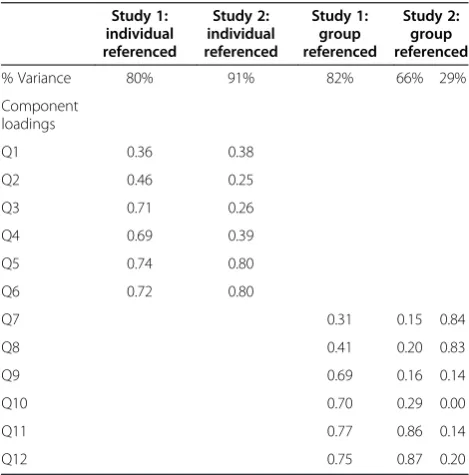
Step 5. Construct validity through factor analysis within groups
The extent to which organization-level measures capture a group-level phenomenon [41] was examined through a factor analysis of within-group data (i.e., individual devi-ations from the group mean). Although individuals within groups are often more similar to each other than individuals across groups, individuals within groups are not identical to one another, and individually referenced items should still be sensitive to individual differences within a group. A within-group factor analysis should yield a clear one-factor structure if ‘true’ differences in individual perceptions persist after ‘subtracting’ shared perceptions within the group. To the extent that group members make reliable judgments about group-level phenomena (e.g., implementation climate of the group), the differences in individual group members’ responses represent measurement error. If that measurement error is non-systematic, a within-group factor analysis of group-referenced items should yield no meaningful structure.
In Study 1, within-group factor analysis yielded a clear one-factor structure for both the individually referenced and group-referenced items (Table 6). These results indi-cate that within-group component structures for the group-referenced items do not merely represent independ-ent measuremindepend-ent error, as expected. Instead, they reflect systematic individual differences, much like the individu-ally referenced items. In Study 2, however, within-group factor analysis yielded a clear one-factor structure for the individually referenced items, but not for the group-referenced items. Instead, the group-group-referenced items loaded on a two-factor structure. For Study 2, there may be a meaningful two-factor structure, although what con-stitutes a‘meaningful structure’is unclear in the literature. While van Mierlo and colleagues suggest that a meaning-ful structure in the group-referenced items may suggest systematic measurement error, we have no reason to be-lieve that our items were assessed with any systematic measurement error. Perhaps the two-factor structure sug-gests similar variances within the group.
Discussion
We sought answers to three measurement questions about an important construct in implementation theory and re-search: can implementation climate be measured as a glo-bal construct; should implementation climate be measured with individually referenced or group-referenced items; and can implementation climate be reliably and validly measured at an organizational level? We explored these questions in the context of two studies. The answers to these questions varied somewhat across the two studies, suggesting that, when it comes to the measurement of im-plementation climate, context matters.
Table 4 ICC(1), ICC(2), and WABA I results
Intraclass correlations WABA I
ICC(1) ICC(2) F testa,b Study 1:ηbetween Study 1:ηwithin E-Testc 1/F Testd
Study 1: Individual referenced 0.07 0.44 1.80** 0.40 0.91 0.44 0.55
Study 1: Group referenced 0.08 0.48 2.14** 0.43 0.90 0.48 0.47
Study 2: Individual referenced 0.29 0.66 2.92 ** 0.65 0.76 0.86 0.21
Study 2: Group referenced 0.33 0.70 3.37** 0.67 0.74 0.91 0.19
Note: ICC = intraclass correlation coefficient; WABA = within and between analysis **p < .01.
a
Study 1: df(within) = 423 for individual referenced = 426 for group referenced; df(between) = 46.
b
Study 2: df(within) = 133 for individual referenced =129 for group referenced; df(between) = 26.
c
E-test for parts significant at 30°.
d
A parts condition, in whichηw >ηb requires an inverse F-test (1/F) with df = N–J and J–1 for the numerator and denominator respectively.
Table 5 Interrater agreement
N Individual referenced average r*wg(J)
Percent significant individual referenced r*wg(J)
Group referenced average r*wg(J)
Percent significant group referenced r*wg(J)
Study 1 47 0.74 89% 0.79 94%
Measuring implementation climate as a global construct
The results of both studies indicated that implementation climate can be measured as a global construct composed of items reflecting expectations, support and rewards for innovation use. These results are consistent with Klein and Sorra’s [1] conceptualization of implementation climate and consistent with prior research [4,13]. Although no standard instrument exists for measuring implementation climate, the instrument that we developed includes items that reflect all three dimensions of implementation climate and phrases items generally enough to apply in a wide range of contexts. The main difference in factor loadings between the individually referenced items in the two stud-ies is with the items related to expectations. For the CCOP-affiliated physicians, expectations related to helping the CCOP meet its goals were more heavily weighted than the expectations for personal enrollment. This makes sense, as most CCOPs do not institute minimum require-ments for patient enrollment; therefore, physicians note the CCOP’s goals as more important in determining an implementation climate. In contrast, the children’s behav-ioral health clinicians had formal requirements for using TF-CBT and therefore more heavily weighted their indi-vidual expectations as compared to expectations for the agency as a whole. This is reflected in the difference in the loadings on the latent variable for expectations as well.
For the CCOP-affiliated physicians, the group-referenced item loadings are similar to the individually referenced items. For the clinicians in Study 2, however, the group-referenced item loadings for expectations are higher than the loadings on the individually referenced items. This is likely because clinicians were better able to assess
differences in their own experiences and that of other clini-cians. Although they placed less emphasis on helping to meet the agency’s goals when the question was individually referenced, they did believe that clinicians in general are expected to help the agency meet its goals for implement-ing TF-CBT. This is reflected also in our group-referenced CFA, as clinicians gave more equal weight to expectations aimed at both using TF-CBT with a certain number of cli-ents as well as expected the agency meet its goals, most likely because the agency’s implementation goals are so closely tied to individual clinicians’ability to using TF-CBT with at least five clients.
Since Klein and Sorra [1] conceived implementation cli-mate as a global construct, a proper test of their theory of implementation effectiveness should occur when a second-order factor structure consisting of expectations, support and rewards fits the data. This condition was met in both of our study settings; however, for studies in which a clear factor structure does not fit, researchers may still advance theory and research. The data might be used to examine whether some climate dimensions explain more variance in implementation effectiveness than others. For example, in some contexts, support for an innovation’s use may be more important than rewards, especially if implementation is mandatory.
Measuring implementation climate using individually or group-referenced items
The results of the Study 1 suggested that it does not matter whether implementation climate is measured using individually referenced items or group-referenced items. The results of Study 2 suggested that it does mat-ter, at least to some extent. This divergence in study findings is likely due to differences in context.
Group members form perceptions of each other’s experi-ences through direct observation and verbal communica-tion, both of which are facilitated by social interaction and physical proximity. Physicians participating in CCOPs typ-ically practice in multiple, geographtyp-ically dispersed loca-tions. On average, CCOPs consist of 10 physician practices and community hospitals. Although physicians practicing in the same settings have more frequent opportunities to observe and interact with each other, physicians practicing in different settings do not. As a result, they may assume that their personal experiences are representative of the experiences of other physicians in the CCOP. This would explain the high degree of correlation between individually referenced and group-referenced items measuring imple-mentation climate perceptions among CCOP physicians.
By contrast, clinicians affiliated with children’s behav-ioral health agencies often practice in groups in single lo-cations. They have more frequent opportunities to observe and interact with each other and, therefore, have a richer
Table 6 Factor analysis within groups
Study 1: individual referenced
Study 2: individual referenced
Study 1: group referenced
Study 2: group referenced
% Variance 80% 91% 82% 66% 29%
Component loadings
Q1 0.36 0.38
Q2 0.46 0.25
Q3 0.71 0.26
Q4 0.69 0.39
Q5 0.74 0.80
Q6 0.72 0.80
Q7 0.31 0.15 0.84
Q8 0.41 0.20 0.83
Q9 0.69 0.16 0.14
Q10 0.70 0.29 0.00
Q11 0.77 0.86 0.14
source of information from which to form perceptions of each other’s experiences. As a result, clinicians could more easily note differences between their own experience and those of other clinicians. The modest correlations between individually referenced and group-referenced items might indicate that, in this context, these items are measuring re-lated, yet distinct constructs.
Although our study results do not provide clear-cut guidance, group-referenced items may be better suited than individually referenced items for measuring imple-mentation climate and testing Klein and Sorra’s [1] theory of implementation effectiveness. Group-referenced items may be more likely to detect shared perceptions of cli-mate, if they exist, because they direct respondents’ atten-tion toward their social context rather than toward their personal situations [14]. Further, group-referenced climate items may also be more predictive of organizational out-comes than individually referenced items [42]. More the-ory development and research is needed, however, about the conditions under which individually referenced items and group-referenced items measure different constructs and, when they do, whether these differences matter.
Measuring implementation climate as an organization-level construct
The results of Study 1 did not support the measurement of implementation climate as an organization-level con-struct. The results of Study 2 did. These divergent find-ings, again, may be explained by differences in context. The low intraclass correlation coefficients observed in Study 1 indicate that only a small percentage of the vari-ation in physicians’implementation climate perceptions occurred as a function of CCOP membership. Although the level of interrater agreement within CCOPs in some cases is high enough to justify aggregating individual perceptions to the organizational level, the low intraclass correlation coefficients imply that there is little reason to aggregate to the organizational level, since CCOPs did not vary much in implementation climate. Most CCOPs do not have formal expectations about the number of patients that physicians should enroll in clinical trials; those that do have fairly modest expectations. Although some physicians enjoy high levels of research support— namely those who practice in large groups or in‘central’ locations within the CCOP — many do not have re-search staff on site or close by to help them enroll pa-tients in trials. Given legal and ethical constraints, CCOPs cannot provide strong incentives or rewards to physicians for enrolling patients in trials. Recognition tends to be non-monetary, symbolic and social. The ef-fects of such recognition may vary more at the individ-ual level than between groups.
By contrast, the intraclass correlation coefficients ob-served in Study 2 indicate that a substantial percentage
of variation in implementation climate perceptions oc-curred between implementation teams. Moreover, the interrater agreement within implementation teams was high enough to justify aggregating individual perceptions to the organizational level. Although fewer interrater agreement values achieved statistical significance in Study 2 than in Study 1, this may have reflected differences in average group size across the two studies. Implementation climate may have varied significantly between implemen-tation teams because of compatibility of TF-CBT with organizational values and practices. TF-CBT is primarily intended for use in outpatient or community-based set-tings to treat children with trauma histories and their fam-ilies. Although all Study 2 agencies provide children’s behavioral health services, there were several agencies that specialize in other areas (i.e., adult services), are general-ists, or provide services in inpatient or residential settings, which would require substantial modifications to either administrative procedures, or TF-CBT in order to imple-ment. In organizational settings with poor fit, there may be more implementation challenges, resistance, and lim-ited or inconsistent messages about rewards, supports and expectations for implementation.
In summarizing the evidence for measuring implementa-tion climate as an organizaimplementa-tion-level construct, we have given less weight to the within and between analysis, or WABA analysis, suggested by Van Miero and her col-leagues as part of Step 3. WABA has become a less popular approach in the literature due in part to the growth of hier-archical linear modeling [34]. Given that WABA is based on one-way analysis of variance (ANOVA) and regression, WABA is also subject to the same set of assumptions, mainly homogeneity of variance, normality, statistical inde-pendence, and equal interval measurement [42]. An add-itional limitation of using WABA is that any restriction of between-groups variance on implementation climate may result in underestimation of within-cell agreement, and thus produce erroneous conclusions [43].
We also gave less weight to the within-group EFA (Step 5) for Study 2. There is ambiguity about what it means to have no meaningful factor structure, which al-lows researchers to conclude that there is no systematic measurement error present in the data. We were unclear as to whether our factor analysis for Study 2 exhibited no meaningful structure.
between organizational climate and psychological climate), and examine the association of this new construct with in-dividual implementation effectiveness. Alternatively, they could measure the dispersion of implementation climate perceptions and examine whether organizations that ex-hibit greater variability in climate perceptions exex-hibit less effective implementation than those that exhibit greater consistency in climate perceptions. Either option would contribute to theory and research.
Study limitations
The results of this study should be interpreted in light of several limitations. First, Study 2 had a smaller sam-ple size in terms of the number of teams, the size of the teams, and the overall number of participating clini-cians than Study 1. Although the number of observa-tions was sufficient for the analyses conducted, larger sample sizes may yield more accurate parameter esti-mates, especially for the confirmatory factor analysis [44]. Also, the smaller team size may have contributed to a greater sense of shared experiences and percep-tions and thus greater within group agreement. Not-ably, we did achieve high response rates, especially for physician and clinician participants. Therefore, our sults are not likely to be subject to any systematic re-sponse biases. We should note, however, that in both studies, the individually referenced items appeared first in the survey; therefore, systematic bias due to ordering effects could have occurred.
Second, our study-specific findings have limited generalizability given our overall finding that contextual differences matter in how implementation climate should be conceptualized and measured. We can speculate that specific features of context such as the degree to which professionals work interdependently, physical proximity, and opportunities for interaction may influence whether implementation climate should be measured at the indi-vidual or organizational level. However, further inquiry across other practice contexts is necessary for determining the appropriate level at which implementation climate should be measured.
Conclusions
Implementation climate is a global construct represent-ing individual workers’ perceptions of how innovation use is rewarded, supported and expected. Although imple-mentation climate can be considered an organizational level construct, its aggregation may depend entirely on context. In contexts where workers practice inde-pendently, implementation climate can be considered at the individual level. In comparison, in contexts where workers interact frequently and develop a shared per-ception, implementation climate can be a group-level
context. It remains unclear, however, which types of survey question items should be used to capture level implementation climate (individual or group-referenced items). Therefore, researchers should engage in more systematic testing across various contexts to verify the observations in this paper and assess further the reliability and validity of the instrument we devel-oped. For example, we need to test hypotheses about contextual variants, specifically those related to interac-tions among implementers: geographic proximity, cohe-sion, and task interdependence. In addition, researchers should seek more opportunities to validate this measure and understand how well it predicts and explains imple-mentation effectiveness.
Appendix
Specific formulas for Steps 3 and 4
Step 3. Variance within and between groups
ICC(1) equals the correlation between the values of two randomly drawn individuals from a single randomly drawn group. ICC(2) represents the reliability of the group mean scores and varies as a function of ICC(1) and group size.
Values are obtained from a One-Way Analysis of Vari-ance (ANOVA)
ICCð Þ ¼1 MSB−MSW
MSBþðN−1ÞðMSBÞ
ICCð Þ ¼2 MSB−MSW
MSB
Where MSB= Mean Square Between; MSW= Mean
Square Within;N= Number of Individuals in the Group WABA I involves estimating between eta-correlations (ηEX) and within eta-correlations (ηWX) and testing for practical and statistical significance with E and F tests re-spectively. Practical significance based on 30° (group level if E ≥1.73, within-group level if E <0.577) or 15° test (group level if E≥1.30, within-group level if E < 0.77). Stat-istical significance based on F test or 1/F test [34].
WABA I:ηEX ¼
ffiffiffiffiffiffiffiffiffiffi
SSB
SST; s
ηWX ¼ ffiffiffiffiffiffiffiffiffiffi
SSW
SST; s
E¼ ηEX
ηWX;
F¼E2N−J
J−1
Where SSB= Sum of Squares Between; SSW= Sum of Squares Within;SST = Sum of Squares Total;N= Num-ber of Individuals; J = Ngroups
Step 4. Agreement within teams
A common measurement of interrater agreement is the rwg(j)index for multiple items. It is obtained by comparing
variance that would be expected if group members would respond randomly. There are a number of limitations of usingrwg(j). To address some of these concerns, an
alterna-tive version named r*wg(j) was developed. An important
advantage ofr*wg(j)is that rating scales with large number
of items do not result in overestimation of true agreement. For 5-point scales, -1.00 <r*wg(j)< 1.00;r*wg(j)= 0 in case of
random response; and r*wg(j)= 1 in case of maximum
agreement. Dunlap et al. [39] provide r*wg(j) significance
levels for various combinations of sample size and number of categories.
rwg jð Þ¼1− −Sxj2
S2 EU
Where−2
Sxj= Mean of observed variances on J items;SEU=
Expected variance under uniform distribution =ðA2−1Þ.
12
where A = Alternatives in response scale.
Abbreviations
NCI:National Cancer Institute; CCOP: Community Clinical Oncology Program; TF-CBT: Trauma-focused cognitive behavioral therapy; NCI/DCP: National Cancer Institute Division of Cancer Prevention; ICC: Intraclass correlation coefficients; WABA: Within-and-between analysis; CFA: Confirmatory factor analysis; EFA: Exploratory factor analysis; CFI: Comparative fit indices; TLI: Tucker-Lewis fit indices; SRMR: Standard root mean square residuals; RMSEA: Root mean square errors of approximation.
Competing interests
The authors declare that they have no competing interests.
Authors’contributions
SRJ helped carry out Study 1, performed all of the statistical analyses for Study 1, and drafted the manuscript. BJW conceived the overall study design and designed the study instrument. ACB carried out Study 2, and performed all of the statistical analyses for Study 2. All authors read and approved the final manuscript.
Acknowledgements and Funding
This work was supported by the National Cancer Institute (R25CA116339 and R01CA124402) and the National Institute of Mental Health (T32MH019117) at the National Institutes of Health.
Author details
1
Department of Health Policy and Management, Gillings School of Global Public Health, 1101 McGavran-Greenberg Hall, CB #7411, University of North Carolina at Chapel Hill, Chapel Hill, NC 27599-7411, USA.2Cecil G. Sheps Center for Health Services Research, 725 Martin Luther King Jr. Blvd., CB #7590, University of North Carolina at Chapel Hill, Chapel Hill, NC 27599-7411, USA.3College of Social Work, The Ohio State University, 325W Stillman Hall, 1947 College Road, Columbus, OH 43210, USA.
Received: 9 August 2013 Accepted: 14 April 2014 Published: 17 April 2014
References
1. Klein KJ, Sorra JS:The challenge of innovation implementation. Acad Manage Rev1996,21:1055–1080.
2. Greenhalgh T:Diffusion of innovations in health service organisations: a systematic literature review.Malden, Mass: BMJ Books/Blackwell Pub; 2005. 3. Damschroder LJ, Aron DC, Keith RE, Kirsh SR, Alexander JA, Lowery JC:
Fostering implementation of health services research findings into practice: a consolidated framework for advancing implementation science.Implement Sci2009,4:50.
4. Holahan PJ, Aronson ZH, Jurkat MP, Schoorman FD:Implementing computer technology: a multiorganizational test of Klein and Sorra’s model.J Eng Technol Manag2004,21:31–50.
5. Dong LY, Neufeld DJ, Higgins C:Testing Klein and Sorra’s innovation implementation model: an empirical examination.J Eng Technol Manag 2008,25:237–255.
6. Osei-Bryson KM, Dong LY, Ngwenyama O:Exploring managerial factors affecting ERP implementation: an investigation of the Klein-Sorra model using regression splines.Inf Syst J2008,18:499–527.
7. Damschroder LM, Goodrich DE, Robinson CH, Fletcher CE, Lowery JC:A systematic exploration of differences in contextual factors related to implementing the MOVE! weight management program in the VA: a mixed methods study.BMC Health Serv Res2011,11:248. 8. Damschroder LM, Lowery JC:Evaluation of a large-scale weight
management program using the consolidated framework for implementation research.Implement Sci2013,8:51.
9. Teal R, Bergmire DM, Johnston M, Weiner BJ:Implementing community-based provider participation in research: an empirical study. Implement Sci2012,7:41.
10. Weiner BJ, Haynes-Maslow L, Kahwati LC, Kinsinger L, Campbell MK: Implementing the MOVE! Weight- management program in the Veterans health administration, 2007-2010: a qualitative study.Prev Chronic Dis 2012,9:E16.
11. Helfrich CD, Weiner BJ, McKinney MM, Minasian L:Determinants of implementation effectiveness: exploring an adapted model for complex innovations.Med Care Res Rev2007,64:279–303.
12. Weiner BJ, Belden CM, Bergmire DM, Johnston M:The meaning and measurement of implementation climate.Implement Sci2011,6:78. 13. Klein KJ, Conn AB, Sorra JS:Implementing computerized technology: an
organizational analysis.J Appl Psychol2001,86:811–824. 14. Glick WH:Conceptualizing and measuring organizational and
psychological climate - pitfalls in multilevel research.Acad Manag Rev 1985,10:601–616.
15. Glisson C, James LR:The cross-level effects of culture and climate in human service teams.J Organ Behav2002,23:767–794.
16. Glisson C, Green P, Williams NJ:Assessing the Organizational Social Context (OSC) of child welfare systems: implications for research and practice.Child Abuse Negl2012,36:621–632.
17. Glisson C, Green P:Organizational climate, services, and outcomes in child welfare systems.Child Abuse Negl2011,35:582–591.
18. Glisson C, Dukes D, Green P:The effects of the ARC organizational intervention on caseworker turnover, climate, and culture in children’s service systems.Child Abuse Negl2006,30:855–880.
19. Aarons GA, Glisson C, Green PD, Hoagwood K, Kelleher KJ, Landsverk JA, Research Network on Youth Mental Health:The organizational social context of mental health services and clinician attitudes toward evidence-based practice: a United States national study.Implement Sci 2012,7:56.
20. Klein KJ, Conn AB, Smith DB, Sorra JS:Is everyone in agreement? An exploration of within-group agreement in employee perceptions of the work environment.J Appl Psychol2001,86:3–16.
21. Baltes BB, Zhdanova LS, Parker CP:Psychological climate: a comparison of organizational and individual level referents.Human Relations2009, 62:669–700.
22. Minasian LM, Carpenter WR, Weiner BJ, Anderson DE, McCaskill-Stevens W, Nelson S, Whitman C, Kelaghan J, O’Mara AM, Kaluzny AD:Translating research into evidence-based practice: the National Cancer Institute Community Clinical Oncology Program.Cancer2010,116:4440–4449. 23. Kaluzny AD, Lacey LM, Warnecke R, Morrissey JP, Sondk EJ, Ford L:Accrual
of patients to randomized clinical trials. Factors affecting cancer prevention and control research.Int J Technol Assess Health Care1994, 10:506–516.
24. Carpenter WR, Fortune-Greeley AK, Zullig LL, Lee SY, Weiner BJ: Sustainability and performance of the National Cancer Institute's Community Clinical Oncology Program.Contemp Clin Trials2012,33:46–54. 25. McKinney MM, Weiner BJ, Carpenter WR:Building community capacity to
participate in cancer prevention research.Cancer Control2006, 13:295–302.
27. Cohen JA, Mannarino AP, Knudsen K:Treating sexually abused children: 1 year follow-up of a randomized controlled trial.Child Abuse Negl2005, 29:135–145.
28. Deblinger E, Stauffer LB, Steer RA:Comparative efficacies of supportive and cognitive behavioral group therapies for young children who have been sexually abused and their nonoffending mothers.Child Maltreat 2001,6:332–343.
29. Cary CE, McMillen JC:The data behind the dissemination: a systematic review of trauma-focused cognitive behavioral therapy for use with children and youth.Child Youth Serv Rev2012,34:748–757.
30. Kilo CM:A framework for collaborative improvement: lessons from the institute for healthcare improvement’s breakthrough series. Qual Manag Health Care1998,8:1–13.
31. Markiewicz J, Ebert L, Ling D, Amaya-Jackson L, Kisiel C:Learning Collaborative Toolkit.Los Angeles, CA, and Durham, NC: National Center for Child Traumatic Stress; http://www.nctsn.org/sites/default/files/assets/pdfs/lc/Module_1.pdf. 32. van Mierlo H, Vermunt JK, Rutte CG:Composing group-level constructs from individual-level survey data.Organ Res Methods2009,12:368–392. 33. StataCorp:Stata Statistical Software: Release 12.College Station, TX:
StataCorp LP; 2009.
34. Chapter 17: Path Analysis and Structural Equation Modeling. InPDQ Statistics.3rd edition. Edited by Norman GR, Streiner DL. London: BC Decker Inc; 2003:156–176.
35. Hox JJ, Bechger TM:An introduction to structural equation modeling. Fam Sci Rev2007,11:354–373.
36. Schreiber JB, Stage FK, King J:Reporting structural equation modeling and confirmatory factor analysis results: a review.J Educ Res2006,99:323–337. 37. Lance CE, Butts MM, Michels LC:The sources of four commonly reported
cutoff criteria - What did they really say?Organ Res Methods2006, 9:202–220.
38. Bliese PD:Within-group agreement, non-independence, and reliability: Implications for data aggregation and analysis. InMultilevel theory, research, and methods in organizations.Edited by Klein KJ, Kozlowski SWJ. San Francisco: Jossey-Bass; 2000:349–381.
39. Cohen A, Doveh E, Eick U:Statistical properties of the rwg(J) index of agreement.Psychol Methods2001,6:297–310.
40. Dunlap WP, Burke MJ, Smith-Crowe K:Accurate tests of statistical significance for RWG and average deviation interrater agreement indexes.J Appl Psychol2003,88:356–362.
41. Dansereau F, Yammarino FJ:Is more discussion about levels of analysis really necessary? When is such discussion sufficient?Leadership Quarterly 2003,17:537–552.
42. Altmann R, Huff J, Baltes B, LaCost H, Young S, Parker C:Psychological and organizational climate perceptions: A field experiment of a contemporary distinction.Dallas, TX: The Thirteenth Annual Meeting of the Society for Industrial Organizational Psychology; 1998.
43. Castro SL:Data analytic methods for the analysis of multilevel questions: a comparison of intraclass correlation coefficients, rwg(j), hierarchical linear modeling, within- and between-analysis, and random group resampling.Leadersh Q2002,13:69–93.
44. Gagne P, Hancock GR:Measurement model quality, sample size, and solution propriety in confirmatory factor models.Multivar Behav Res2006, 41:65–83.
doi:10.1186/1748-5908-9-46
Cite this article as:Jacobset al.:Context matters: measuring implementation climate among individuals and groups.Implementation Science20149:46.
Submit your next manuscript to BioMed Central and take full advantage of:
• Convenient online submission
• Thorough peer review
• No space constraints or color figure charges
• Immediate publication on acceptance
• Inclusion in PubMed, CAS, Scopus and Google Scholar
• Research which is freely available for redistribution