Volume 3, Issue 7 (September 2012), PP. 33-37
A Study on the Removal of COD Using Laboratory Scale
Fluidized Bed Bioreactor
Dr.G.V.R.Srinivasa Rao
1, K.Srinivasa Murthy
2, P.Chaitanya Kumar
31
Professor, Department of Civil Engineering, Andhra University, Visakhapatnam, A.P., India 2Lecturer,Civil Engineering.Section, M.R.A.G.R.Government Polytechnic, Vizianagaram, A.P.,India.
3
M.E. Scholar, Andhra University, Visakhapatnam, A.P., India
Abstract––The organic component of the wastewater is generally be removed in biological methods of wastewater treatment. This paper presents the application of Fluidized Bed Bioreactor (FBBR) to study the removal of Chemical Oxygen Demand (COD) from synthetic wastewater using a laboratory scale model of fluidized bed bioreactor. The Reactor consists of Perspex glass column of dia. 7.5cm and length 120cm erected in the laboratory. Small rings of thickness 2.5mm and dia. 19mm made of PVC are used as a bed material. The bed material is acclimatized with organic feed for about a week. Synthetic wastewater with COD ranging from 500-1500 mg/l is taken as a stock solution for conducting the study. From the experiment it is observed that, there is an increase in the percent removal of COD with an increase in the operation times. Further, it is observed that, maximum percent removals of COD are obtained at lesser experiment periods with the increase in operation times. Also, it is observed that the reactor gets stabilized and maximum percentage removal of COD is achieved within lesser periods of time with an increase in COD values of stock solutions.
Keywords–– Fluidized Bed Bio Reactor (FBBR), bed material, Synthetic Waste water,Operating Time, Chemical Oxygen Demand (COD)
I.
INTRODUCTION
The dumping of industrial and domestic wastewaters into natural water bodies, without proper treatment, is making the natural water bodies get polluted and damaging the environment. In order to avoid the pollution of water bodies, the wastewaters released from the industries and domestic activities should be well treated and the concentration of their constituents should be brought down to the permissible limits as specified by various international organizations, prior to their disposal into the natural water bodies.
Thus there is a need for the efficient and environmentally safe wastewater treatment technologies to reduce the natural water body contamination. One such technology is, the biological treatment mechanism that removes the most harmful component of the wastewater viz.., organic matter. The biological wastewater treatment mechanism for the removal of Chemical Oxygen Demand (COD), can be conducted on a wide variety of treatment units and reactors, and one such reactor is Fluidized Bed Bioreactor (FBBR).
The fluidized bed bioreactor is a fixed-film reactor column that fosters the growth of micro-organisms on a hydraulically fluidized bed of media. In this reactor the liquid to be treated is pumped upwards through a bed of small biofilm coated particles at a flow rate sufficient to cause fluidization of bed i.e. a state in which the particles, though retained within the reactor, are able to move to one another in the liquid rather than being sediment and immobile.
In fluidized bed bioreactors, it is possible to achieve a high concentration of biomass depending on the operational conditions used in the process and the type of support used to immobilize the micro-organism which is found within a complex structure of cells and their extra-cellular products, referred to as biofilm. The Pilot Plant studies conducted on Fluidized Bed Bio Reactors has demonstrated that the FBBR has the capacity to handle high hydraulic and organic loadings with corresponding low detention times[4],[5],[6]. Similarly various operating variables affect the effectiveness of the FBBR[2].In order to achieve aerobic degradation in this reactor, support particles are fluidized by the flowing wastewater, which must have been previously oxygenated or flow co-currently together with an air system.In fluidized bed bioreactors, effluent recirculation is necessary to provide the fluid velocity within the necessary treatment detention times. Performance of the reactor is normally site specific and depends on ambient conditions, type and quality of the wastewater and nitrate and dissolved oxygen concentration etc. The experiments conducted on Laboratory scale models confirmed the efficient removal of phenols, organic compounds, parameters like COD etc., with a high level of efficiency[1],[3],[7],[8],[9],[10].A variety of Fluidizing particles like PVC discs can be effectively used in the column studies on FBBR [11].
II.
METHODOLOGY
occupying the entire bed material, and kept in aerobic conditions. The slurry is allowed to develop into a biomass attached to the bed material, till the gas bubbles indicating acclimatization are visualized. This process has taken 5 to 7 days.
(1)Valve (2)Stainless Steel Mesh (3)Perspex column 120 cm height 7.5 cm OD and 5 mm thick (4)Air compressor (5) 2.5 HP Motor (6) Reservoir (7) Flow meter
Fig.1 Laboratory Setup of Fluidized Bed Bioreactor
III.
EXPERIMENTATION
The experimental process is started soon after completion of acclimatization of the biomass over the bed material. The stock solution is now fed into the reactor through the inlet in the upward direction. Before feeding into the reactor, the COD content present in the stock solution is measured in the standard methods. The flow rate is adjusted by operating a valve and maintained at a constant level i.e. 8-10 l/hr as is measured using the flow meter. Simultaneously the compressed air is allowed into the bed for continuous aeration of the bed. Care is taken that the bed material occupies the entire length of the reactor. The treated wastewater samples are collected from the outlet of the reactor at regular intervals of time i.e., 15, 30, 45, 60, minutes. The samples are analyzed for their COD values in the standard method and the percent removal of COD is calculated. The entire experiment is repeated everyday for a period of 2 to 3 weeks till a constant percent removal of COD is obtained.
IV.
ANALYSIS
OF
SAMPLES
V.
EXPERIMENTAL
RESULTS
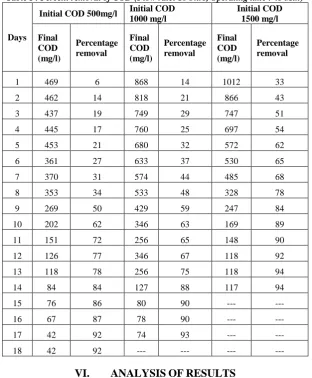
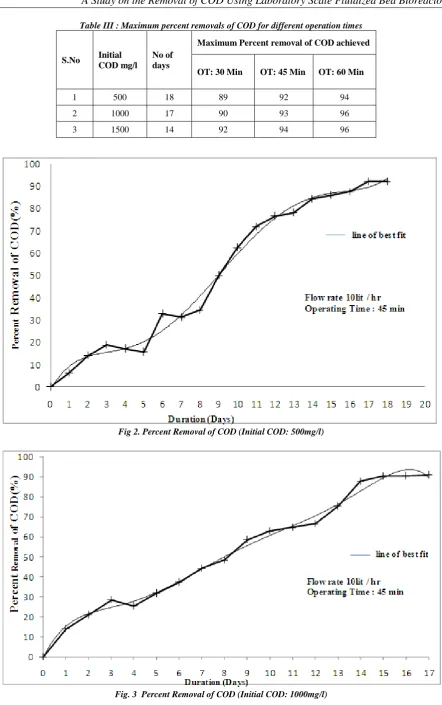
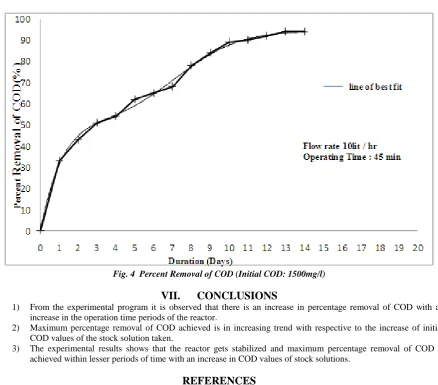
The Percent removal of COD, for various Initial COD concentrations, and for a Flow rate of 10 lit/hr and operating time of 45 min are given below in the table I and are shown graphically in Fig. 2,3,4. The percent removals for the same initial concentrations and flow rate for other operating times were similarly obtained.
Table I : Percent removal of COD (Flow rate: 10 l/hrs, Operating time : 45 Min)
Days
Initial COD 500mg/l Initial COD
1000 mg/l Initial COD 1500 mg/l Final COD (mg/l) Percentage removal Final COD (mg/l) Percentage removal Final COD (mg/l) Percentage removal
1 469 6 868 14 1012 33
2 462 14 818 21 866 43
3 437 19 749 29 747 51
4 445 17 760 25 697 54
5 453 21 680 32 572 62
6 361 27 633 37 530 65
7 370 31 574 44 485 68
8 353 34 533 48 328 78
9 269 50 429 59 247 84
10 202 62 346 63 169 89
11 151 72 256 65 148 90
12 126 77 346 67 118 92
13 118 78 256 75 118 94
14 84 84 127 88 117 94
15 76 86 80 90 --- ---
16 67 87 78 90 --- ---
17 42 92 74 93 --- ---
18 42 92 --- --- --- ---
VI.
ANALYSIS
OF
RESULTS
The maximum percent removals obtained against different operation times (OT) along with the number of days of experiment, for different stock solutions of varying initial COD values are presented in the Tables II and III. From the experimental results it is observed that, there is an increase in the percent removal of COD with an increase in the operation times. Further, it is observed that, maximum percent removals of COD are obtained at lesser experimental periods with the increase in operation times. Also, it is observed that the reactor gets stabilized and maximum percentage removal of COD is achieved within lesser periods of time with an increase in COD values of stock solutions.
Table II : Maximum percent removals obtained against different operation times (OT)
S.No. OT
(Min) Experi mental Period (Days) Max % removal of COD for Initial COD Conc. 500 mg/l Experi mental Period (Days) Max % removal of COD for Initial COD Conc. 1000 mg/l Experi mental Period (Days) Max % removal of COD for Initial COD Conc. 1500 mg/l
1 30 18 89 17 90 14 92
2 45 17 92 17 93 14 94
Table III : Maximum percent removals of COD for different operation times
S.No Initial
COD mg/l
No of days
Maximum Percent removal of COD achieved
OT: 30 Min OT: 45 Min OT: 60 Min
1 500 18 89 92 94
2 1000 17 90 93 96
3 1500 14 92 94 96
Fig. 4 Percent Removal of COD (Initial COD: 1500mg/l)
VII.
CONCLUSIONS
1) From the experimental program it is observed that there is an increase in percentage removal of COD with an increase in the operation time periods of the reactor.
2) Maximum percentage removal of COD achieved is in increasing trend with respective to the increase of initial COD values of the stock solution taken.
3) The experimental results shows that the reactor gets stabilized and maximum percentage removal of COD is achieved within lesser periods of time with an increase in COD values of stock solutions.
REFERENCES
[1]. Hakki Gulsen,Mustafa Turan, “Anaerobic treatability of sanitary landfill leachate in Fluidized Bed Reactor” ,
Turkish J.Eng.Env,Sci,;Env.Sci.; 28: 297-305:2004
[2]. .C.Orcutt, B.H.Carpenter, and C.N.Click, “Fluidized Bed Clarification in wastewater treatment” ,WPCF; 45(9):
1908 -1927; 1973.
[3]. J.R.Foeller and R.L Segar, Jr., “Treatment of Trichloethene (TCE) with a Fluidized – Bed Bioreactor”,
Proceedings of the 12th Annual Conference on hazardous waste, May 19-22,1997, Kansas City, Missouri. [4]. John.S.Jeris, Carl Beer and James Am Mueller , “High Rate Biological Denitrification using a Granular Fluidized
Bed” ,WPCF: 45(9):2118-2128: 1974.
[5]. John.S.Jeris and Roger W.Owens, Pilot-Scale, High- rate Biological Denitrification,WPCF; 47(8) 2043-2057; 1975
[6]. John.S.Jeris, Roger W.Owens,Robert Hickey, “Biological Fluidized-Bed Treatment for BOD and Nitrogen removal”, WPCF; 816- 831; 1977
[7]. Kapal Madireddi and Michael K. Stenstrom, “Denitrification in a Fluidized Sand column: Lake Arrowhead Water Reclamation Pilot Study”,67th Annual water Environment Federation Conference, Chicago, 1994
[8]. L.Wang, J.R. Foeller, and R.L Segar Jr , “Sand Media Type and Charge Effects on TCE Cometabolism in a fluidized Bed Bioreactor”, Proceedings of the Conference on Hazardous Waste Research, St. Louis, May
25-27, 1999
[9]. N.W.Ingole, A.M.Mokadam and S.P.Burghate, “Biological Fluidized Bed Treatment for COD Removal and Denitrification”, Journal of IPHE; Vol.1,56-61; 2005
[10]. V.Patroescu, Gheorghita Jinescu , Eliza Pena- Leonte, L.Dinu, “Denitrification Efficiencies of the industrial Waste water in Fluidized bed Bioreactors”,Roumanian Society of Biological Sciences; 9(5): 1845-1852; 2004
[11]. R.R.Souza, I.T.L.Bersolin, T.L.Bioni, M.L. Gimenes nd B.P.Dias- Filho, “The performance of a Three- Phase Fluidized bed reactor in Treatment of Wastewater with High Organic Load”,Brazilian Journal of Chemical
Engineering; 21(2): 219-227; 2004.