NUCLEOSYNTHESIS STEP BY STEP
Berze High School, Kossuth 33, H
A R T I C L E I N F O
Nearly sixty years after BBFH [1], it is very important to re processes. Since 1957 everybody has spoken about s these processes realized in fact? Do s
approximations?
It is the best to investigate the beginnings. How does the formation of nuclei occur starting
from seed nucleus
because of the high abundance of iron, this process
The possibility of experimental investigation is very limited, so it is very useful to investigate it through a model. The computational model is almost the only way to look into the details.
There is a simple full network computer m
which was made strictly following Käppeler [4]. In the early 2000s it was possible to run such a simple network model on a computer. In case of this model it was not necessary to exclude any nuclei from the ne
order of formation of nuclei by the model step by step. Surprisingly the
before the
INTRODUCTION
It is well-known what literature says about neutron capture processes; according to it there are two types: the slow process (s-process) and the rapid process (r-process). Furthermore, it is also known what the explanation is:
“For unstable nuclei, when the time between successive neutron capture is much larger then
-decay lifetimes(
n
), the network of processes involved is called s process. ….the s-process closely follows the valley of stability. … If neutron capture proceeds on a rapid time scale compared with
-decay lifetimes (the other ex
n ), the network of reactions involved is called r process. … the r-process synthesizes neutron-rich isotopes not reached by the s-process.” [5]Another similar explanation can be seen at Clayton [6] on pages 548-549 and 557-558. The experimental investigation of these processes is nearly impossible, but it is very important to revise these assumptions.
International Journal of Current Advanced Research
ISSN: O: 2319-6475, ISSN: P: 2319-6505,
Available Online at www.journalijcar.org
Volume 6; Issue 12; December 2017; Page No.
DOI: http://dx.doi.org/10.24327/ijcar.2017.
Article History:
Received 19th September, 2017 Received in revised form 25th
October, 2017
Accepted 11th November, 2017 Published online 28th December, 2017
Key words:
Neutron capture, low neutron density, s-process, s-path, network, r-only, intermediate neutron density, AGB, Fe-60
Copyright©2017 Miklós Kiss. This is an open access article distributed under the Creative Commons Attribution License, which permits unrestricted use, distribution, and reproduction in any medium, provided the original work is properly cited.
*Corresponding author: Miklós Kiss
Berze High School, Kossuth 33, H-3200 Gyöngyös, Hungary
NUCLEOSYNTHESIS STEP BY STEP
Miklós Kiss*
Berze High School, Kossuth 33, H-3200 Gyöngyös, Hungary
A B S T R A C T
Nearly sixty years after BBFH [1], it is very important to re-processes. Since 1957 everybody has spoken about s-process and r
these processes realized in fact? Do s-path and r-path exist, or these are only two useful approximations?
It is the best to investigate the beginnings. How does the formation of nuclei occur starting
from seed nucleus 5626
Fe
? It is possible that other nuclei can capture a neutron as well, but because of the high abundance of iron, this process is the most important.The possibility of experimental investigation is very limited, so it is very useful to investigate it through a model. The computational model is almost the only way to look into the details.
There is a simple full network computer model for neutron capture nucleosynthesis [2,3] which was made strictly following Käppeler [4]. In the early 2000s it was possible to run such a simple network model on a computer. In case of this model it was not necessary to exclude any nuclei from the neutron capture process arbitrarily. It is possible to get the
order of formation of nuclei by the model step by step. Surprisingly the
before the 2860
Ni
and before any other nuclei above 6028Ni
along the sknown what literature says about neutron capture processes; according to it there are two types: the slow process process). Furthermore, it is
the time between successive
decay lifetimes
), the network of processes involved is called
s-process closely follows the valley of
-stability. … If neutron capture proceeds on a rapid time scaledecay lifetimes (the other extreme
), the network of reactions involved is called
r-rich isotopes not
Another similar explanation can be seen at Clayton [6] on The experimental investigation of these processes is nearly impossible, but it is very important to
A possible solution is to make a computational model and follow the neutron capture process at given conditions step by step [2,3].
It is well known [4,5] what the two possibilities for a nucleus are when it captures a neutron. It depends on whether the formed nucleus is stable or not. If the new nucleus is stable, a subsequent capture is possible.
1 N 1 A Z N A
Z
X
X
'
The neutron number and mass number increase by one, the proton number does not change.
If the given time is short enough, the probability of capture under
t
is written as:t
v
n
n T n
If the new nucleus is unstable, it can decay. At the beginning the decay is beta decay.
N 1 A 1 Z 1 N 1 A
Z
X
'
X
"
If the time is short enough, the probability of decay is written as:
t
T
2
ln
International Journal of Current Advanced Research
6505, Impact Factor: SJIF: 5.995
www.journalijcar.org
2017; Page No. 8001-8005
http://dx.doi.org/10.24327/ijcar.2017.8005.1270
This is an open access article distributed under the Creative Commons Attribution License, which permits unrestricted use, distribution, and reproduction in any medium, provided the original work is properly cited.
3200 Gyöngyös,
-investigate neutron capture process and r-process, but how are or these are only two useful
It is the best to investigate the beginnings. How does the formation of nuclei occur starting
? It is possible that other nuclei can capture a neutron as well, but is the most important.
The possibility of experimental investigation is very limited, so it is very useful to investigate it through a model. The computational model is almost the only way to look
odel for neutron capture nucleosynthesis [2,3] which was made strictly following Käppeler [4]. In the early 2000s it was possible to run such a simple network model on a computer. In case of this model it was not necessary to utron capture process arbitrarily. It is possible to get the
order of formation of nuclei by the model step by step. Surprisingly the 6026
Fe
is formedalong the s-path.
A possible solution is to make a computational model and follow the neutron capture process at given conditions step by
It is well known [4,5] what the two possibilities for a nucleus are when it captures a neutron. It depends on whether the formed nucleus is stable or not. If the new nucleus is stable, a
(1) The neutron number and mass number increase by one, the
If the given time is short enough, the probability of capture
(2)
If the new nucleus is unstable, it can decay. At the beginning
(3)
probability of decay is written
(4)
Research Article
This is the case if we are speaking about an only nucleus. But what happens if there are a huge number of nuclei? At a given time, the decay either occurs or not. The half-time is a statistical idea. So if there are numerous nuclei during the half-time, about the half of the initial nuclei decays. This way there are some remaining nuclei as well; actually the other half of the initial nuclei. However, during two half-times not all nuclei do decay.
The simple computing model
In order to follow the neutron capture process, let us take a
number of initial seed nuclei of 56
Fe
. If there is a huge amount of seed nuclei for the first approach, we may assume that its quantity is constant. The number of a given nucleus can change with neutron capture or decay:, ) t ( N ) t ( N ) t ( N ) t ( ) t ( N ) t ( N ) t ( N ) t ( dt dN N , Z ' N , Z ' N , Z ' n 2 N , 2 Z 1 N , 1 Z 1 N , Z n N , Z
(5)
Actually these are differential equation systems. There are many possible decay processes needed to be taken into account (beta decay, double beta decay, alpha decay, spontaneous fission etc.).
For the purpose of solving there are two sets used: 1. the available set and 2. The transaction set. The numbers are changed in two steps according to their probability: 1. neutron capture and 2. Decay. These two steps are repeated continuously. Details are in [3].
Firstly, from the available set, the transaction set is generated for every nucleus. The original set is decreased by the transaction. The quantity of nuclei can only be an integer obviously. Thus the number of formed nuclei is needed to be truncated. After it the transaction set is added to the available set. It is done with the capture and after it is done with the decay as well. After these two steps we have a new available set. In this way the change of nuclei, the order of change and the formation could all be followed.
After the decay the quantity of a given unstable nuclei are:
t 0 remaining
N
e
N
,N
decayed
N
0
(
1
e
t)
, (6)For the calculation a time base (time increment or time period) is needed, thus for calculation purposes there are three possibilities; the number of changed and remained nuclei can be taken into account in three ways in case of decay.
1. If the half-time (i.e. the half-life) is much less than the time base, it is assumed that all nuclei decay,
2. If the half-life is in the order of magnitude of the time base, the original exponential expression is used, 3. If the half-life is in longer than the time base , the next
approximation is used:
1
t
N
N
remaining
0
, orN
decayed
N
0
t
(7) (In case of a one percent limit: a,
T
halflife
0
,
15
t
, b,t
69
T
t
15
,
0
halflife
and c,69
t
T
halflife. This meansthat if under the t time the 99% of nuclei are decayed, we calculate as if all nuclei decayed. If
T
halflife>
69
t
, the linearapproximation is used. This is a smaller exclusion than the one used in the classical approach.) Here t denotes the time base.
In this model there is no prior exclusion, instead there is a selection by the process itself. It is important to mention that nucleus is formed only if its number is at least one.
The model can operate at different base times and at different neutron densities. Time dependent neutron density is possible as well. For the model a lot of data are needed: e. g. half-times, decay modes, the percentage branching and neutron capture cross sections at 30 keV [2,3,7,8,9,10].
Operating model step by step
What happens if a nucleus captures a neutron or if nuclei capture neutrons? The answer has been well known since 1957 when the fundamental paper was published by BBFH [1]. Is it possible to verify this classical approach? Does the neutron
capture process begin from the 56
Fe
exactly in this way? Is it possible to verify this traditional approach? Unfortunately, experimental verification is not possible yet, but it is possible to simulate it through a computing model. There is some uncertainty in the value of the necessary data, so the picture given in this way will be a little different quantitatively. However, the qualitative picture given by the model must be taken seriously.
The recent goal is to investigate the order of formation beginning from iron. With this model it is possible to follow the formation of nuclei step by step. This means that the model is stopped after every step so that snapshots of the status quo of the chart of nuclei could be seen. This chart shows that under neutron exposition in a given moment which nuclei are formed and what the secondly, thirdly, fourthly etc. formed nucleus is.
Results of the model
The following section shows what the result is if the model works at different low neutron densities. It is possible to compare the first steps and thus the formation order at
3 11 4
n
2
,
5
10
2
,
5
10
cm
n
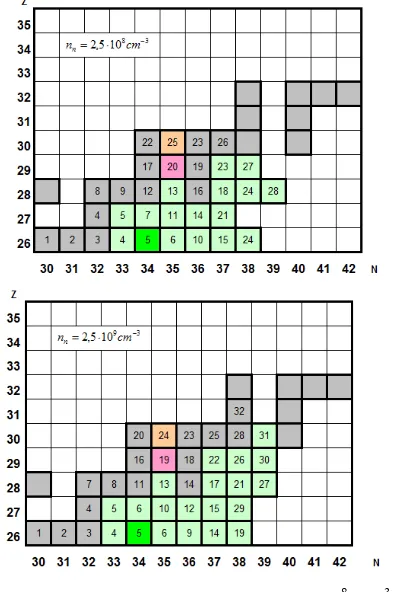
neutron density, which is thelow-intermediate neutron density range. The figures show the order of formation but not the abundances. The numbers in the squares show the order of appearance. The colors refer to the stability. The gray squares denote the stable nuclei; the color squares the unstable nuclei. Light green means short half-life and dark green means long half-life. Some nuclei decay by electron capture, in the pictures these are denoted by orange color. If the nuclei can decay in different ways, these are denoted by purple color (beta decay or electron capture) [3].
At first glance it is visible that the formation always occurs in a band, not along a path in any cases. The left edge is at the beta stability valley. The width of the band depends on the neutron density. At higher neutron density the band is wider.
This means that the s-path is supported by unstable nuclei. Every unstable nucleus involved is a possible channel for nucleosynthesis. These channels have different rates. The band exists only under neutron exposition. If neutron exposure ceases, the band gradually disappears.
same, but the fifth nucleus is different. Surprisingly the 60
Fe
radio nucleus is the fifth in the last case. From this neutrondensity the 60
Fe
is always formed before any nickel nucleus.Figure 1 Initially formed nuclei in case of
n
n
2
,
5
10
4cm
3 and3 5
10
5
,
2
cm
n
n neutron density. The numbers show the order offormation.
Figure 2 Initially formed nuclei in case of
n
n
2
,
5
10
6cm
3 and3 7
10
5
,
2
cm
n
n neutron density. The numbers show the order offormation.
Figure 3 Initially formed nuclei in case of
n
n
2
,
5
10
8cm
3 and3 9
10
5
,
2
cm
n
n neutron density. The numbers show the order offormation.
Figure 3 (left side) shows how the formation band differs from the classical s-path. The case of the stable nucleus 62
Ni
28 is interesting, because this nucleus is formed from stable 2861
Ni
Figure 4 Initially formed nuclei in case of
n
n
2
,
5
10
10cm
3 and3 11
10
5
,
2
cm
n
n neutron density. The numbers show the order offormation.
It is also important that the band becomes wider during the advance of the neutron capture process than the initial width.
Continuous formation
After the step by step investigation, it is interesting what the general picture from iron to bismuth is like.
Fig 5 The nuclei on the Z-N plan at
n
n
2
,
5
10
8cm
3neutron density with
t
10
5s
time base. It can almost be seen as the s- path. In the light gray squares there was not a nucleus formed. The colors mean the number of nuclei on logarithmic scale. Darker squares mean higher abundance. If a nucleus existed but afterwards decayed, its place is denoted by
white.
It is possible to get back the s-path only by changing the time base, because at a short time base the synthesis band always occurs at arbitrary neutron density. If the time base is about
s
10
5 , the band almost disappears and it only seems to be a path (Fig. 5). This means that during the neutron capture process the band exists at arbitrary neutron density (Fig. 6), and the so called s-path does not exist in fact. But the high abundance of formed nuclei at low neutron density is at the stable side of the band. After the decay the band disappears and only the path like pattern remains (Fig. 7). The place of the abundance maximum in the band is changed only at medium neutron density. The maximum is then shifted toward the neutron drip line (Fig. 8).Fig 6 The band on the Z-N plan at
n
n
2
,
5
10
8cm
3 witht
1
s
time base
Fig 7 The remaining nuclei after decay. This is very similar to Fig. 5.
In the classical model the short-lived nuclei were excluded. According to the model an equilibrium concentration of short-lived nuclei always exists, so these nuclei are able to capture a neutron. The exclusion of nuclei is made by the model. It is determined by the conditions and the time base of the model. An investigation of the model shows that if the time base goes to zero, the formation band tends to a fix shape. More nuclei are involved but their number is less and less significant and there is a physical limit (Fig. 8).
Fig 8 Tin isotopes during the neutron exposure if the time base
is different. 1e4 means
t
10
4s
time base. If the time base is shorter, more nuclei are involved in the neutron capture process, but their number becomes smaller (3 8
10
5
,
2
cm
CONCLUSION
The most important consequence is that under neutron exposition a formation band always occurs. The width of the band depends on the neutron density. The abundance of nuclei at a neutron-rich region becomes very low and it is visible only on logarithmic scale.
After decay the abundance of nuclei is almost the same as at classical approach at low neutron density. Nevertheless, there are some interesting differences. When the neutron flux is on the network is working. The width of the band that is which nuclei are involved it is depend on the neutron density. The nucleosynthesis band always exists and the so called r-only nuclei are also always formed. The number of r-only nuclei at low neutron density is small, but it is a qualitative difference that they are formed. If the neutron density becomes higher, the number of the former r-nuclei becomes more and more significant [3,10,11].
The case of 60
Fe
is very important. The formation of 60Fe
under AGB conditions is not only possible [13], but in the TPphase it is very probable [11,14]. Moreover 60
Fe
is an important channel for formation of heavier nuclei. In order offormation 60
Fe
is the fifth nucleus.
References
1. M. E. Burbidge, G. R. Burbidge, W. A. Fowler and F. Hoyle, “Synthesis of the elements in stars,” Rev. Mod. Phys. 29, 547 (1957)
2. M. Kiss, Z. Trócsányi: A unified model for nucleosynthesis of heavy elements in stars, Journal of Physics: Conference Series, Volume 202, Number 1, 2010 IOP Publishing Ltd.
3. M. Kiss: PhD Thesis, University of Debrecen 2012 4. F. Käppeler, H. Beer and K. Wisshak, s-process
nucleosynthesis-nuclear physics and the classical model, Rep. Prog. Phys. 52, 945 (1989).
5. C.E. Rolfs and W.S. Rodney, “Cauldrons in the Cosmos,” The University of. Chicago Press, (1988) 6. D. D. Clayton: Principles of Stellar Evolution and
Nucleosynthesis, The Chicago University Press 1968, 1983
7. J. K. Tuli, Nuclear Wallet Cards 2005, Brookhaven National laboratory
8. http://adg.llnl.gov/Research/RRSN/semr/30kev/rath00_ 7.4.30kev_calc
9.
http://exp-astro.physik.uni-frankfurt.de/kadonis/index.php KADoNiSH
10. M. Kiss and Z. Trócsányi, “Phenomenological Description of Neutron Capture Cross Sections at 30 keV,” ISRN Astronomy and Astrophysics, vol. 2013,
Article ID 170954, 8 pages, 2013.
doi:10.1155/2013/170954
11. M. Kiss: Rate Analysis or a Possible Interpretation of Abundances https://pos.sissa.it/204/110/pdf
12. M. Kiss: Neutron Capture Nucleosynthesis,
TEACHING PHYSICS INNOVATIVELY New
Learning Environments and Methods in Physics Education e-book Proceedings of the international conference Teaching Physics Innovatively (TPI-15) New Learning Environments and Methods in Physics Education Budapest, 17-19 August, 2015.
13. D. Clayton. Isotopes in the Cosmos, Cambridge University Press, 2003
14. M. Lugaro, A. Chieffi: Radioactivities in Low- and Intermediate-Mass Stars in Astronomy with Radioactivities, Springer 2011
How to cite this article:
Miklós Kiss (2017) 'Nucleosynthesis Step By Step', International Journal of Current Advanced Research, 06(12), pp. 8001-8005. DOI: http://dx.doi.org/10.24327/ijcar.2017.8005.1270