Page 317
THE COGNITIVE STRUCTURES OF GEOGRAPHY STUDENT-TEACHERS ABOUT THE CONCEPT OF “POPULATION”
Tahsin Tapur, Caner Aladağ, Baştürk Kaya
Necmettin Erbakan University, Ahmet Keleşoğlu Faculty of Education, Konya, Turkey
Abstract
With this work, it is aimed to determine geography student-teachers’ conceptual framework through evaluating their answer-words given for the key-concept “population”. And alternative concepts about this matter will also be identified and given at the part of “suggestions to be done”. In this work, qualitative research method was applied. Data were collected with the participation of 67 Geography student-teachers. The free word-association test was used as data collection instrument. Data obtained from the study were subject to content analysis, similar answer-words were gathered together and categories were created by this way. Frequencies of each answer-word and some of answer-words in categories were calculated and given in the text as a table.
When the data collected about the key-concept “population” were analyzed, answer-words were divided into 5 categories as “population census”, “population distribution and factors affecting the distribution”, “population mobility”, “quality and quantity of population” and “other concepts”. With this work, it was determined that students’ cognitive structures on the concept of “population” are sufficient. Most of the sentences they founded on the concept of population were scientific and including academic information but at the same time these sentences were superficial and including misconceptions.
Key words:geography, population, conceptual framework, student-teacher
1. INTRODUCTION
The term “population” refers to the number of people who live in an area whose boundaries were defined exactly such as earth, continent, country, region, administrative units (province, district etc.) or a settlement (village, town, city etc.) in a certain period of time. Population is a dynamic event which is changing momently. On the one hand births are taking place but on the other hand deaths are taking place, migrations are also taking place and the qualities of people are changing but above all, there are changes in the quantity of population and quality distributions (Özgür, 2010: 5).
Different assessments have been carried out and different importance has been given to the concept of population in different times. Population, which was kept in the forehead just for its numerical value before 20th century, occupies an important place in terms of its quantitative and qualitative characteristics today.
Population is a phenomenon to be focused on in terms of its impact to environment and development both. Impact of humans on environment in any field is firstly connected to quantity and density of population but at the same time economic, cultural and technical degree of population is important from this point (Tanoğlu, 1969: 29).
Population data carries different meanings for almost everyone. Population data is priceless for administrators, politicians, planners, investors and scientists because lots of events or cases are related to population directly or indirectly. The source of many global problems is the result of human activities. For this reason, population is a significant phenomenon and it is a subject for many scientific researches (Şahin, 2010: 15).
Page 318
perception is selective. Image is a thing that is seen without environmental stimuli. And mind map is a special form of image which has the least relation with sensory experiment (Tuan 1975: 206).
The number of scientific works about the perception of population is inadequate. The works that may be relevant to this matter are indeed related to space and spatial perception, spatial belonging and migration (Ilgın & Hacıhasanoğlu, 2006; Öztürk, 2007; Doğanay & Alim, 2010; Kaygalak, 2011; Yüceşahin & Tüysüz, 2011; Deniz & Özgür, 2013; Cengiz, 2015)
2. OBJECTIVE
The aim of the study is to determine the perceptions of university students about the concept of “population” and reveal the definition of “population” in their minds. In addition to this, its aim is to open new gates to different definitions and explanations considering the original approaches to population set by students. Revealing the students’ misconceptions about the concept of “population” constitutes another object. With this aspect, this study bears a unique character.
3. MATERIALS AND METHODS 3.1. Research Model
In this study, qualitative research method and case-study design from the qualitative research approaches were used. The main feature of qualitative case study is to investigate one or more situations deeply. It means, factors related to a situation (environment, individuals, events, process etc.) are investigated with a holistic approach focusing on how they affect the related situation and how they are affected by the related situation (Yıldırım ve Şimşek, 2011: 77).
3.2. Working Group
Working group consists of 4th and 5th grade students in the Geography Teaching Department of Ahmet Keleşoğlu Faculty of Education, in Necmettin Erbakan University in 2015-2016 academic year. The common feature of the students attended to the study is that they have taken the courses related to population.
3.3. Collecting and Analyzing the Data
In this study, Word Association Test (WAT) was used as a data collection instrument. Word association is a technique designed to reveal the relations people set among the concepts. Since concepts can be the units in topics, word association technique can be used to measure how not only concepts but also a discipline, situations and even people are comprehended (Atasoy, 2004). Word Association Test (WAT) is one of the oldest techniques used for analyzing the cognitive structure of a student and connections between concepts in this structure. It means it is used for analyzing the data network. In this method, student answers with certain words that came to his mind first in a certain period of time about key concepts given on any subjects (Bahar & Özatlı, 2003: 73)
Data of the research contain answer-words that given by 67 geography students about the key concept “population”. Key concept was written ten times on a page and they were all under the other. A sample page layout about the key concept “population” is given below.
Population ---
Population---
Population---
Page 319
The aim in writing a key word under the other 10 times is to provide students’ returning to key concept again after each word spelling. Bahar and Özatlı (2003: 77) reveal that reason of writing a key concept under the other ten times is to prevent the risk of chain-response. Because, student will write the words that came to his mind as a result of a concept which he wrote in response instead of key-concept unless he/she returns to the key-key-concept in writing the key-concept every time. And this gives harm to the purpose of the test. Word association test consists of two stages. These stages are explained below. First, students were informed about WAT and 30 second-time was given for the concept of “population”. While applying the word association test about the key-concept of population, 30 second-time-adopted by Bahar & Özatlı (2003: 77) was used.
Then, during the implementation phase, attention was given to the issue of student-teachers’ writing meaningful sentences between key-concept and associated-word and in the phase of analyzing data, all associated-words and sentences were examined one-by-one. Because, answer-word that was associated with key-concept may be the associated-product which doesn’t have a meaningful relationship with key-concept in the remembering phase (Bahar etc 2006: 70-71).
Content analysis method was used while evaluating the data which were collected with word-association-test.
The main aim in content analysis is to reach the concepts and relations which can explain the data collected. Data, which are reviewed and outlined in descriptive analysis, are exposed to a deeper process and the concepts and themes, which cannot be detected with descriptive approach, may be discovered with the result of this analysis. With this aim, it is needed to conceptualize the collected data, then organize them logically according to the emerging concepts and determine the themes which explain the data. Content analysis interprets similar data integrating within a certain concept and theme framework and organizing the data in such a way that readers can understand (Yıldırım ve Şimşek, 2006: 22). According to this information, the data that was obtained about the population concept and the most frequently repeated answer-words were analyzed with using semantic relation technique. All the answers that were given to key concepts were analyzed in detail and a frequency table was created with calculating how many times answer-words or concepts are repeated for the “population” key-concept.
3.4. Validity and Reliability Studies
An expert review was applied to provide the research’s validity according to Yıldırım and Şimşek (2011: 268). According to this, researcher transmitted all the process verbally to the expert and evaluated the collected data and outcomes together. For the research’s reliability, codes of the two researchers and categories related to the codes were compared. The reliability of the data analysis conducted in this manner calculated with using the formula of; [Consensus /(Consensus+Dissidence) x 100] (Miles & Huberman, 1994: 64). The average reliability between coders was calculated as %88.
4. FINDINGS
Data about the key-concept population were coded and categorized. Free word association test was applied for this concept and word-answers obtained from the test were grouped under five categories. These categories and words answered in each category were listed in the table. If these words were repeated once or not related with the subject or meaningful, they weren’t combined with the other words. 56 words from these kinds of words weren’t included in categories but these were mentioned in the text. Totally 563 word-answers were obtained and 508 of them were listed according to their categories in the table (Table 1)
Page 320
livelihood, traditional family, underdeveloped country, hidden population, voluntary migration, Henry Ford, climate, Istanbul, nonfunctional population, Japan, gradual migration, sources, colhoz, mining, median age, grassland, internal revenue, unskilled population, normal population growth, population geography, population movements, population control, population health, importance of census, reasons for the increase in population, fertility rate of the population, functions of population, cultural characteristics of population, bounce period of population, passive population, health, Syria, mass population, Tunceli, transportation, production and consumption, living standards, resident population and forced migration.
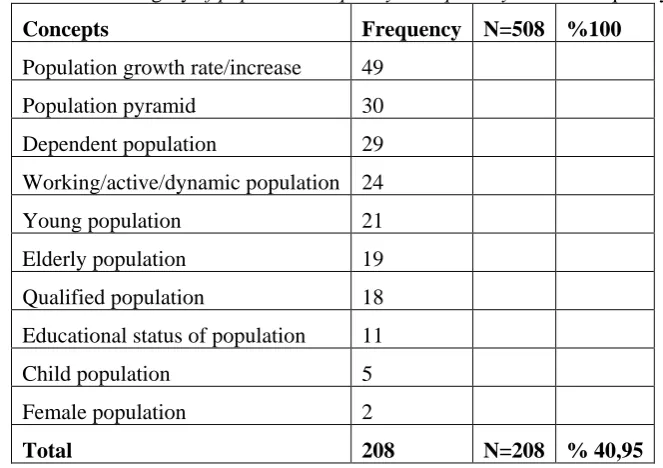
When analyzed the answer-words given to the key-concept population, first category is a dominant category and named as category of population’s quality and quantity and it has 208 frequencies. Geography students expressed the words with the highest frequency of this category (Table 1) such as
population growth rate/increase (49), population pyramid (30), dependent population (29), working/active/dynamic population (24) and young population (21). Frequencies of some words in this category are under 20 such as; elderly population (19), qualified population (18), educational status of population (11), child population (5), female population (2). These words were used less and they have a low density. While analyzing the data in this category, it is seen that students have configured the data about the quality and quantity of population correctly and their academic information is sufficient.
Table 1. The category of population’s quality and quantity and its frequency
Concepts Frequency N=508 %100
Population growth rate/increase 49
Population pyramid 30
Dependent population 29
Working/active/dynamic population 24
Young population 21
Elderly population 19
Qualified population 18
Educational status of population 11
Child population 5
Female population 2
Total 208 N=208 % 40,95
Page 321
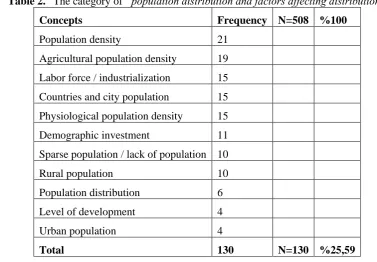
Table 2. “The category of “population distribution and factors affecting distribution”
Concepts Frequency N=508 %100
Population density 21
Agricultural population density 19
Labor force / industrialization 15
Countries and city population 15
Physiological population density 15
Demographic investment 11
Sparse population / lack of population 10
Rural population 10
Population distribution 6
Level of development 4
Urban population 4
Total 130 N=130 %25,59
Third category includes the word-answers related to population movement’s category (Table 3). The frequency of this category is 98. In this category, participants mostly used the expressions such as
migrations/migration/brain drain (31), population planning/policy (19), death rate (10). Although participants used some words less such as exchange migration/battles (9), birth rate (9), infant death rate (8), population explosion (8), seasonal and nomadic population (4), it is seen that they configure their cognitive structure correctly.
Table 3. The category of “population movements” and its frequency
Concepts Frequency N=508 %100
Migrations/migration/brain drain 31
Population planning/policy 19
Death rate 10
Exchange migration/Battles 9
Birth Rate 9
Infant death rate 8
Population explosion 8
Seasonal and nomadic population 4
Total 98 N=98 %19,29
Fourth category includes the answer-words related to census (Table 4). Frequency of participants’
Page 322
Table 4. Concepts related with “census” and its frequency
Concepts Frequency N=508 %100
Census 13
De facto 9
De jure 9
Demographic structure 6
Malthus theory 5
Total 42 N=42 %8,27
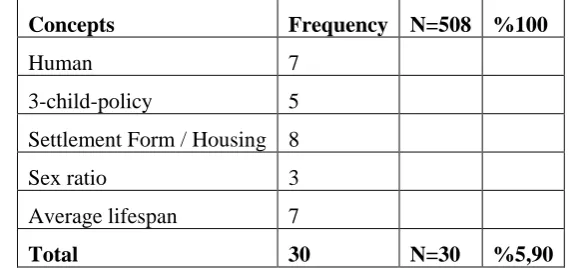
Fifth category includes the answer-words grouped under the category of other concept related to population (Table 5). Words in this category consist of the expressions not included in other categories. Views about the different dimensions of population characteristics are suggested in this category. Instead of forming different categories with these words, giving them together is approved.
Table 5. The category of “other concepts related to population” and its frequency
Concepts Frequency N=508 %100
Human 7
3-child-policy 5
Settlement Form / Housing 8
Sex ratio 3
Average lifespan 7
Total 30 N=30 %5,90
Page 323
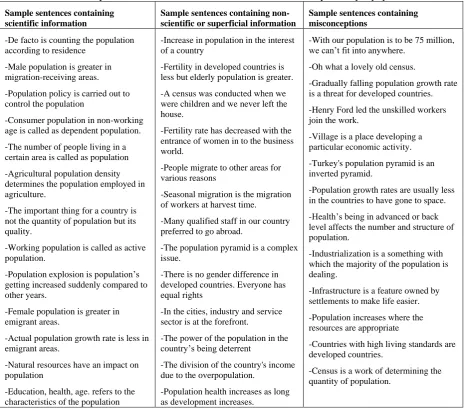
Table 6. Sample sentences that students have founded on the key-concept “population” Sample sentences containing
scientific information
Sample sentences containing non-scientific or superficial information
Sample sentences containing misconceptions
-De facto is counting the population according to residence
-Male population is greater in migration-receiving areas.
-Population policy is carried out to control the population
-Consumer population in non-working age is called as dependent population.
-The number of people living in a certain area is called as population
-Agricultural population density determines the population employed in agriculture.
-The important thing for a country is not the quantity of population but its quality.
-Working population is called as active population.
-Population explosion is population’s getting increased suddenly compared to other years.
-Female population is greater in emigrant areas.
-Actual population growth rate is less in emigrant areas.
-Natural resources have an impact on population
-Education, health, age. refers to the characteristics of the population
-Increase in population in the interest of a country
-Fertility in developed countries is less but elderly population is greater.
-A census was conducted when we were children and we never left the house.
-Fertility rate has decreased with the entrance of women in to the business world.
-People migrate to other areas for various reasons
-Seasonal migration is the migration of workers at harvest time.
-Many qualified staff in our country preferred to go abroad.
-The population pyramid is a complex issue.
-There is no gender difference in developed countries. Everyone has equal rights
-In the cities, industry and service sector is at the forefront.
-The power of the population in the country’s being deterrent
-The division of the country's income due to the overpopulation.
-Population health increases as long as development increases.
-With our population is to be 75 million, we can’t fit into anywhere.
-Oh what a lovely old census.
-Gradually falling population growth rate is a threat for developed countries.
-Henry Ford led the unskilled workers join the work.
-Village is a place developing a particular economic activity.
-Turkey's population pyramid is an inverted pyramid.
-Population growth rates are usually less in the countries to have gone to space.
-Health’s being in advanced or back level affects the number and structure of population.
-Industrialization is a something with which the majority of the population is dealing.
-Infrastructure is a feature owned by settlements to make life easier.
-Population increases where the resources are appropriate
-Countries with high living standards are developed countries.
-Census is a work of determining the quantity of population.
5. CONCLUSION AND DISCUSSION
This study was conducted to determine the geography students’ opinions about the subject of “population”. The cognitive structures of geography students about the concept of population are discussed in the context of geography science and evaluated with word association test. The answer-words given to the key-concept population are coded under five categories. These are the categories namely as the quality and quantity of population, population distribution and factors affecting distribution and population movements and their frequencies are all above 50 and the categories namely as the census and other words related to population and the frequency of these last two categories is under 50. The first three categories have the most answer-words as dominant categories. It is seen that students include all the concepts about population in these categories.
Page 324
When sample sentences that students founded about the key-concept population are examined, sentences containing scientific information are sufficient. These sentences are given in table 2. This result shows that students learned the concepts about population with their scientific meanings. Some sample sentences such as De facto is counting the population according to residence, consumer population in non-working age is called as dependent population,arithmetic population average is the proportion of country’s surface area and population, are frequently used sentences among students. This result reveals that students have not-much discrepancy about the population concept in their minds.
Moreover, Sentences that are superficial or contain non-scientific information are used frequently by students. In these sentences, students tried to reveal the population concept with simple and non-scientific expressions. These superficial and non-non-scientific samples are such as A census was conducted when we were children and we never left the house, A lot of people in our country go abroad to wander.
In addition, some sample sentences that contain misconceptions have been identified such as With our population is to be 75 million, we can’t fit into anywhere, Population growth rates are usually less in the countries to have gone to space, Infrastructure is a feature owned by settlements to make life easier. These sentences are given in detail in table 6.
Incomplete and incorrect information is emerging as a problem at all levels of education. To configure such concepts correctly and to provide the conceptual understanding, the methods and techniques presented by constructivist learning approach need to be used frequently.
REFERENCES
Atasoy, B. 2004. Fen Öğrenimi ve Öğretimi, Ankara: Asil Yayın Dağıtım.
Bahar, M. & Özatlı, N.S. 2003, Kelime İletişim Test Yöntemi ile Lise 1. Sınıf Öğrencilerinin Canlıların Temel Bileşenleri Konusundaki Bilişsel Yapılarının Araştırılması, Balıkesir Üniversitesi Fen Bilimleri Enstitüsü Dergisi 5 (2), s.75-85.
Bahar, M., Nartgün, Z., Durmuş, S. & Bıçak, B. 2006, Geleneksel ve Alternatif Ölçme Değerlendirme Öğretmen El Kitabı, Ankara: Pegem Yayıncılık.
Cengiz, D. 2015. Zorunlu Göçün Mekânsal Etkileri ve Yerel Halkın Algısı: Kilis Örneği, Turkish Studies International Periodical For The Languages, Volume 10/2 Winter 2015, p.101-122.
Deniz, A. & Özgür, M. 2013, Antalya’daki Rus Gelinler: Göçten Evliliğe, Evlilikten Göçe, Sosyoloji Dergisi, s.151-175.
Doğanay, S. & Alim, M. 2010, Türkiye’de Kırsal Nüfusun Şehir Algısı Üzerine Bir Araştırma: Yeşilyurt Köyü (Trabzon), Doğu Coğrafya Dergisi (Eastern Geographical Review) 23, s.171-184.
Ilgın, C. & Hacıhasanoğlu, O. 2006, Göç-Aidiyet İlişkisinin Belirlenmesi İçin Model: Berlin Kreuzberg Örneği, İTÜ Dergisi, s.59-70.
Kaygalak, İ. 2011, Postmodern Eleştirilerin Coğrafi Düşünce ve Yeni Mekân, Coğrafi Bilimler Dergisi 9 (1), s.1-10.
Miles, M.B. ve Huberman, A.M. 1994, Qualitative Data Analysis: an Expanded Sourcebook (2nd Ed.). Thousand Oaks, California: Sage.
Özgür E.M. 2010, Nüfus Coğrafyası Ders Notu, Ankara Üniversitesi, Dil ve Tarih-Coğrafya Fakültesi, Coğrafya Bölüm Ders Notu (COĞ 108), Ankara.
Öztürk, M. 2007, Coğrafya: Gelişimi, İçeriği, Eğitimi, (Editörler Karabağ, S. ve Şahin, S.) Kuram ve Uygulamada Coğrafya Eğitimi, Ankara: Gazi Kitabevi.
Page 325
Tanoğlu, A. 1969, Nüfus ve Yerleşme, İstanbul Üniversitesi Edebiyat Fakültesi Coğrafya Enstitüsü Yayın No: 45, İstanbul.
Tuan, Y. F. 1975, Images And Mental Maps, Annals of the Association of American Geographers 65 (2), p.205-212.
Yıldırım, A. & Şimşek H. 2011, Sosyal Bilimlerde Nitel Araştırma Yöntemleri, Ankara: Seçkin Yayıncılık.