R E S E A R C H
Open Access
MISSEL: a method to identify a large
number of small species-specific genomic
subsequences and its application to viruses
classification
Giulia Fiscon
1*†, Emanuel Weitschek
1,2†, Eleonora Cella
3,4, Alessandra Lo Presti
3,
Marta Giovanetti
3,5, Muhammed Babakir-Mina
6, Marco Ciotti
7, Massimo Ciccozzi
1,3,
Alessandra Pierangeli
8, Paola Bertolazzi
1and Giovanni Felici
1*Correspondence: [email protected] †Equal contributors
1Institute of Systems Analysis and Computer Science A. Ruberti (IASI), National Research Council (CNR), Via dei Taurini 19, 00185 Rome, Italy Full list of author information is available at the end of the article
Abstract
Background: Continuous improvements in next generation sequencing technologies led to ever-increasing collections of genomic sequences, which have not been easily characterized by biologists, and whose analysis requires huge computational effort. The classification of species emerged as one of the main applications of DNA analysis and has been addressed with several approaches, e.g., multiple alignments-,
phylogenetic trees-, statistical- and character-based methods.
Results: We propose a supervised method based on a genetic algorithm to identify small genomic subsequences that discriminate among different species. The method identifies multiple subsequences of bounded length with the same information power in a given genomic region. The algorithm has been successfully evaluated through its integration into a rule-based classification framework and applied to three different biological data sets: Influenza, Polyoma, and Rhino virus sequences.
Conclusions: We discover a large number of small subsequences that can be used to identify each virus type with high accuracy and low computational time, and moreover help to characterize different genomic regions. Bounding their length to 20, our method found 1164 characterizing subsequences for all the Influenza virus subtypes, 194 for all the Polyoma viruses, and 11 for Rhino viruses. The abundance of small separating subsequences extracted for each genomic region may be an important support for quick and robust virus identification.
Finally, useful biological information can be derived by the relative location and abundance of such subsequences along the different regions.
Keywords: Classification of genomic sequences, Genetic algorithms, Supervised learning, Extraction of multiple classification models
Background
The analysis of DNA sequences of living organisms is relevant for many genetic, biologi-cal, and medical purposes. It can support the automated recognition and classification of organisms, genomic regions characterization, and the study of genetic evolution of pop-ulation of individuals of the same species. Its deployment for taxonomic classification of organisms is first proposed for archaea, bacteria, protists and viruses [1–3], and then for many other domains [4, 5] becoming a central research topic in Bioinformatics.
DNA sequences used for this aim are different for diverse organisms and corresponds to specificgenomic regions, e.g., the mitocondrial DNA region associated with cytochrome c oxidase I (COI), commonly refered to asBarcode, largely used for species classification in the animal kingdom (see, among others, [6]).
The methods that are adopted to pursue this task are inherited from the more gen-eral sequence analysis and supervised learning (i.e., classification) literature, and can be divided into 3 main groups [7]: tree-based methods, similarity-based methods, and character-based methods. The first ones make use of Parsimony (i.e., PAR [8]), or Neighbor Joining (i.e., NJ [9]), or Bayesian Inference [10] to assign unidentified sequence query to categories based on their clusters membership in a tree. The second group is composed of methods such as BLAST [11], NN [12], TaxonDNA [13] that assign sequence queries to categories based on how many nucleotide characters they share. The third group of methods comprises tools like DNA-BAR [14], BLOG [15], CAOS [16], BRONX [17], PTIGS-IdIt [18], Linker [19], and Alignment-free analytics [20, 21]. Methods in the latter group are based on the identification of specific and limited nucleotides positions of the DNA sequences that can be used for recognizing the class of the sample sequences. All the mentioned approaches share the same supervised learning paradigm: a set of sample sequences for which the class is known (the so-called training set, composed of labeled sequences) is analyzed to derive rules that may recognize also unlabeled sequences [22, 23].
Supervised learning is typically effective when the domain of the samples is well defined, e.g., we know that the samples can belong to a known number of species or classes; good examples can be found in [24], where supervised learning methods successfully classify species through the analysis of DNABarcodesequences.
The literature offers indeed several methods to identify virus species through the analysis of DNA sequences (among them, [25–29]).
In this paper, we investigate some aspects that remained unexplored: in particular, where the nucleotide changes that make one species different from another are located, if such nucleotides are close to each other along the sequence, how many equivalent characterizing subsequences are within the boundaries of the considered sequence. An additional aspect, that will be considered also in this paper, is the differential analysis of known genomic regions, to see if they show a different abundance of genetic variations with respect to a number of taxa.
in species characterization. As shown in the last section of this paper, this spatial informa-tion can be very relevant, and can be associated with biological properties of the original sequence.
We design MISSEL (Multiple SubSequences Extractor for cLassification) - a new method to solve this problem based on a meta-heuristic algorithm, which identifies many small subsequences that retain enough information to classify the considered species. Such subsequences are used to identify portions of the sequences that are rich of discriminating information with respect to those that are non-meaningful.
We applyMISSELto the genomes of Rhino, Influenza, and Polyoma viruses. These three virus types, having positive and negative strand RNA or DNA genomes respectively, present features that make them particularly suited for the proposed method.
The recent discovery of novel and divergent human Polyoma viruses raises key ques-tions regarding their evolution, tropism, latency, reactivation, immune evasion and contribution to diseases. Moreover, the increasing number of human and animal Polyoma viruses suggests that many of them remain to be unveiled. The most common patholog-ical manifestation is the reactivation in an immunosuppressed host, so that a molecular characterization is often needed.
Influenza subtyping is of epidemiological and clinical significance, beside the obvious interest during pandemic periods. In particular, seasonal Influenza A(H3N2) gener-ally causes more severe outcomes among at risk groups than A(H1N1) or Influenza B viruses [30]. For that reason, Influenza epidemic surveillance in Europe has been recently implemented with virological surveillance to alert about the real-time predominating subtype.
As far as human Rhino virus (HRV) is concerned, conflicting reports have associated (or not) HRV-C to a clinical severity greater than HRV-A and to recurrent wheezing [31, 32], so that genotyping should be implemented to possibly clarify these issues.
In all three cases, it is important to classify with precision the different virus types, but also to identify the regions that mostly support such classification, which are supposedly the regions where mutations have occurred in the evolution process. The number and the size of separating subsequences provide additional insight on the location of mutations and on their uniques in characterizing the analyzed taxa.
In these data setsMISSELidentified 1164 equivalent small subsequences for all the Influenza virus subtypes, 194 for the Polyoma viruses, and 11 for the Rhino viruses. The size of such subsequences is rather small, as their are composed by no more than 20 contiguous nucleotides.
Below we provide a clear statement of the problem and a description of the proposed method for its solution. A compact additional analysis of the related literature in the field of meta-heuristic algorithms is also provided.
Problem statement
Given a set of genomic sequences belonging to different classes (i.e., species), find the largest possible number of subsequences with the following properties:
• The size of the subsequence is bounded and small if compared to the size of the input sequences;
• The subsequence does not contain any other subsequence with the same properties.
Related work
The above problem contains several complex aspects. The main one is that search-ing for many subsequences with desirable properties is much more difficult than searching for a single optimal one. Additionally, the dimensions of the prob-lem to be solved are typically very large (i.e., DNA sequences with thousands of bases). The complexity of the problem does not suggest a straightforward deploy-ment of a mathematical optimization model, and therefore we consider a meta-heuristic approach that is much faster than enumeration, and sufficiently precise and time-effective.
Meta-heuristicsare nature-inspired algorithms that can be suitably customized to solve complex and computationally hard problems, and can be inspired to different princi-ples, such asAnt colony optimization[33],Genetic Algorithms[34],Simulated annealing
[35],Tabu Search[36],Particle swarm optimization[37]. Several authors in the literature considered similar problems, although they cannot be reconducted to the framework of multiple solutions that we adopt here.
Recent studies [38–40] focused on problems with multiple objective functions, often used as a tool to counterbalance the measurement bias affecting solutions based on a single objective functions, or to mitigate the effect of noise in the data. Deb et al. [41] also approached the issue of identifying gene subsets to achieve reliable classification on available disease samples by modeling it as a multi-objective optimization prob-lem. Furthermore, they proposed a multimodal multi-objective evolutionary algorithm that finds multiple, multimodal, non-dominated solutions [42] in one single run. Those are defined as solutions that have identical objective values, but differ in their pheno-types. Other works [43, 44] pointed to multiple membership classification, dealing with the fitting of complex statistical models to large data sets. Again, Liu et al. [45] pro-posed a subset gene identification consisting of multiple objectives, but, differently from Deb et al. [41], they scalarize the objective vector into one objective that is solved by using a parallel genetic algorithm, in order to avoid expensive computing cost. Kohavi et al. [46] addressed the problem of searching for optimal gene subsets of the same size, emphasizing the use of wrapper methods for the features selection step. Rather than try-ing to maximize accuracy, they identified which features were relevant, and used only those features during learning. The goal of our work is again different: to extract informa-tion on interesting porinforma-tions of the genomic sequences by taking into account equivalent subsequences.
Materials and methods
The main components of our work are described below, starting from a detailed descrip-tion of the algorithm.
MISSEL: multiple subsequences extractor for classification
In this section, we presentMISSEL(Multiple SubSequences Extractor for cLassification), a method to extract alternative and equivalent subsequences that can be applied in super-vised classification problems for biological sequences belonging to different classes. A subsequence is a set of consecutive nucleotide positions of the sequence. Given a set of aligned sequences of equal lengthn, belonging to different classes, we look for the largest number of subsequences with the following characteristics:
• They areseparating subsequences, i.e., knowing the nucleotide in the positions of the subsequence allows one to predict, with high reliability, the class of sequences whose class is unknown;
• The length of the subsequence (also referred to as itssize) is small and anyway not larger than a given threshold.
MISSEL is an ad-hoc nature-inspired meta-heuristics based on an evolutionary approach [34], which identifies the desired subsequences in a reasonable computational time. In the following, we discuss the details of the algorithm.
Genetic algorithm
MISSEL is based on an ad-hoc developed Genetic Algorithm (GA). It implements a search paradigm that exploits an ever-changing population whose individuals represent possible solutions of the given problem. Such a population evolves according to a set of
genetic operators.
Each individualsi(i.e., candidate solution) is a set of consecutive positions of the input sequences. To each individual, the following values are associated:
• βi, its length;
• σi, its starting position;
• αi, its discriminant power (described in detail in the following);
• nαi, number of pairs of sequences of different class not covered at levelαi(better
explained in the following);
• F(si), its fitness value (better explained in the following).
Firstly, apopulation S0 of candidate individuals is generated and initialized (at time t = 0). Then, the population evolves (t > 0), selecting each individual according to a randomized rule based on its fitness value, and computing a new individual by means of differentgenetic operations. At each iteration, the survival capacity of eachi-th individual of the population is defined according to itsfitnessvalue, so that the new population will have improved overall fitness. New generations of the population are iteratively computed until one stopping criterion is verified. Once the genetic algorithm has been run, the best individuals are returned.
Population and fitness
We recall that a subsequence is fully identified byβiandσi, and it is also referred to as anindividualof the population. A generic individual inStis referred to assi. We note that two individuals (iandj) with same starting position (σi = σj) and same length (βi =βj) identify exactly the same positions and are therefore equal.
Additionally, we refer toRas the repository of individuals that are candidate for being part of the final solution. The discriminant power ofsi(referred to asαi) is derived from a feature selection model based on an integer program already discussed in [47–50]: for a set of features of a given size, it indicates a lower bound on how many times a pair of samples of different classes is separated by a feature in the set. Intuitively, such a value represents how many different discriminating models can be build with the considered features. In this case, the features are the positions of the small subsequence that cor-responds to the individual. Additionally, we also take into account the valuenαi, that indicates how many pairs of samples of different classes are separated exactly byαi fea-tures. We observe that individuals with a high value ofαiare very rich of discriminating information; moreover, a small value ofnαi indicates that the value ofαimay be further increased with few additional features (for this reason,αi andnαi are the main ingredi-ent of the fitness function ofsi, described below). Given an individualsiidentified by its lengthβiand its starting pointσi, the computation ofαiis straightforward: build a matrix withmrows indexed by the pairs of samples belonging to different classes andncolumns indexed by the positions insi; then, each element of this matrix shows the value 1, if the value of the nucleotide in the position indexed by the column is different from the pair indexed by the row, and 0 otherwise. The row-wise minimum number of ones for theβi columns that start fromσiis exactlyαi. To complete this description, we note thatαi≤βi and that nαi ≤ K, whereK is the number of pairs of input sequences that belong to different classes.
With the above ingredients, the fitness functionF(si)can be computed, based on the value ofαi(to which fitness is directly related),βiandnαi(fitness being indirectly related with both of them). Then,F(si)takes into account:
• Thequality of individualsi(related withαβii, the larger, the better).
• Thesize of individualsi(βi, the smaller, the better);
using the following formula:
F(si)=ωA·A+ωB·B (1)
where:
A= αi βi +
K−nαi
K (2)
B= n−β+1
n (3)
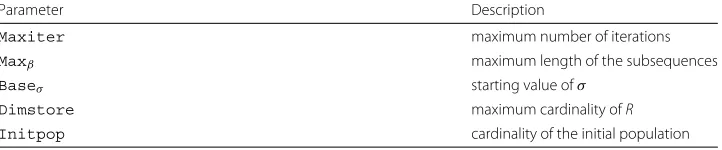
Table 1Overview of the parameters of the genetic algorithm
Parameter Description
Maxiter maximum number of iterations
Maxβ maximum length of the subsequences
Baseσ starting value ofσ
Dimstore maximum cardinality ofR
Initpop cardinality of the initial population
Relationship among individuals: equivalence and dominance
Among all the computed subsequences, we focus on theequivalentandnon-dominated
ones. Let S be the set of individuals in the repository R, and consider the following definitions:
Definition 1Equivalent individuals
Given two individuals s1,s2 ∈ S,they are equivalent if the following 3 conditions are verified: 1)α1=α2; 2)β1=β2; 3)σ1=σ2.
two equivalent individuals should not be both stored inR. We now turn to consider a
dominancerelation between individuals.
Definition 2Domination between individuals
Given two individuals s1,s2∈S, we say that s1dominates s2(s1s2) if one of the following 2 conditions is verified: 1)α1> α2andβ1≤β2; 2)α1≥α2andβ1< β2.
As a consequence, we have that individual si ∈ S is non-dominated if there is no individualsj∈S,sj=si, such thatsjsi.
Less formally, individualidominates individualj if it has the same lengthβi=βj
, but it shows a higher separation powerαi> αj
, or if it has the same value of separa-tion power (αi = αj), but it has a shorter length
βi< βj
. Our algorithm computes all the equivalent individuals by filtering out any individual that is dominated by another one inR. Moreover, if a new individual is equivalent to an individual already inRcan be computed in constant time.
The quality of the final subset of solutions mostly depends on the way the genetic algo-rithm is implemented; that is, how the fitness of each solution is measured and how subsequences are selected and extended in each iteration. The main idea is that, when properly designed, the genetic algorithm can determine populations that are sufficiently heterogeneous and whose solutions have good values.
Genetic operations
We summarize below the genetic operators adopted inMISSEL.
Selection: individuals are selected from the population at random with probability pro-portional to the value of their fitness function. At the initialization step, all candidate individuals are assigned the same value of fitness.
Parthenogenesis: each selected individual in the current population generates a new one. Theparthenogenesisoperator expands the selected individual by increasing the subsequence length of a givenγvalue, selected at random in the interval [ 0,Maxβ−βi+1];
positions that will be added at the head of the new subsequence, the second one (γ2)
the ones to be appended at the end. The name of this operator is inspired to the bio-logical form of reproduction in which the ovum develops into a new individual without fertilization.
Trimming: this operator is executed in order to reduce the length of the extracted sub-sequences, maintaining the separating power of the subsequence, and is applied to an individual just before it is entered in R. Starting from an individuals1(α1,β1,σ1), the trimming operator looks for another individual s2 (α2,β2,σ2), such that α1 = α2and σ1≤σ2≤σ1+β1−β2(i.e.,s2is a subsequence ofs1, with the same discriminating power
(α1=α2).
Mutation: Mutation is needed to prevent an irrecoverable loss of potentially useful information that parthenogenesis and trimming may occasionally cause. This operator is a random alteration of the length of an individual that occurs with small probability, and randomly cuts at the head or tail of the subsequence.
Steps of the algorithm
In the following, we describe the steps of the algorithm:
1. Initialize a random populationSt,t=0of individuals. SetR= ∅.
2. Create a new populationSt+1by repeating the following steps until no new solution is found, i.e., until the solution does not change any more respect to the others:
• Through theselection operator, select an individual from the population; • By means of theparthenogenesis genetic operator, expand the selected
individual, by increasing the subsequence length of a givenγ value and form a new individual. If no more expansion are allowed (βi=Maxβ), the new individual is the exact copy of the old one.
• By using themutation operator and according to a mutation probability, randomly cut the new solution at a random position.
• Perform thetrimming of the new individual to reduce itsβi.
• Check if the new individual is dominated by one in the repositoryR ; if not, discard from the repository all individuals dominated by the new one and insert the new individual inR and inSt+1and compute its fitness value.
3. Sett=t+1
4. Check termination conditions: (i) theR has not changed in the lastk>10
iterations; (ii) the maximum number of iterations (Maxiter) has been reached; (iii) the number of individuals exceeds the value ofDimstore. If one of the stopping condition is satisfied, stop, and returnR.
5. Go to the step 2.
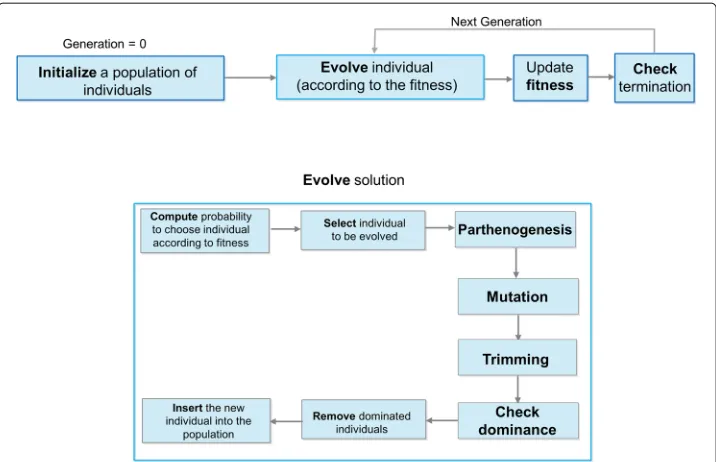
An extended flowchart of our algorithm is drawn in Fig. 1.
Score computation
Once the final repository of individualsRis obtained, we can derive aggregate information from the individuals contained therein. By the construction ofR, we know thatRcontains
Fig. 1Extended flowchart ofMISSEL. Graphical representation of the whole procedure implemented by the genetic algorithm: (i) initialization of a random population of individuals; (ii) evolution of the current population according to a set ofgenetic operators; (iii) evaluation of the fitness of each individual in the population according to fitness function F and updating of the fitness value; (iv) checking the termination conditions. The evolution step is further composed of probability computation, selection of individuals, parthenogenesis, mutation, trimming and dominance checking; then the individual is inserted into the current population, where a proper cleaning is also made according to dominance rules
in the experiments described in the following to characterize different genomic regions of the same virus type. To bring this information to light, we compute, for each positionj
of the sequence, the ratio between the sum of theαifor the individualssi∈Rthat contain that position, and the similar sum over theβi(see Eq. 4).
score(j)=
si∈Hjαi
si∈Hjβi ,Hj=
si∈R:σi≤j≤σi+βi
,j=1, ..,n (4)
Such score measures can be charted over the length of the complete sequence to see if the discriminating power is concentrated in some portion of the sequence. When the scores are charted for different genomic regions, we are interested in comparing the landscape of discriminating power along the regions, to see where and how they concen-trate or exhibit isolated peaks. Within each region, we can then point out sets of specific consecutive nucleotide positions that discriminate for the considered classes.
Finally, we store the equivalent and non-dominated solutions, measuring for each of them the effective discriminating power with a classification method, and summa-rizing the results according to characteristics of the individuals (e.g., their length and discriminating power).
Classification of sequences through individuals inR
set) are automatically assigned to a class by analyzing the classification model. An addi-tional goal is also to compute a clear and compact classification model that fits the data, for example “if-then” rules that have been extracted by rule-based classifiers. The classi-fication model aids biologists to extract relevant positions that are discriminant for new sequence samples [22].
Proper validation can be performed splitting the available labeled data at random into training and test sets, and computing correct classification percentages for both. An important aspect of automated classification is the prevention of overfitting, which can manifest itself with very high correct classification percentages in the training sets, and very poor ones on the test sets. Additional validation can be performed by random per-mutations of class labels; solutions extracted from data with randomly permuted labels should not exhibit separating power. Results from these validation analyses, which we provide for our experiments, give us additional confidence in the quality of our proposed method and in the fact that we are properly handling overfitting risks.
Our method is released as a software package calledMISSELand is available at http:// dmb.iasi.cnr.it/missel.php. For installation and usage the reader may refer to the user guide provided as Additional file 1.
Results and discussion
In this section, we present the main results of our method applied to three experimental data sets of virus sequences.
Experimental data sets
We analyze data sets of sequences belonging to three virus groups: Influenza, Polyoma, and Rhino viruses.
Influenza. Influenza viruses (INL) are involved in the etiology of acute respiratory infections of the upper and lower respiratory tract. They are RNA viruses belonging to the Orthomyxoviridae family. We can distinguish Influenza virus types A, B, and C. Influenza virus types A and B cause annual epidemics in temperate climates, while Influenza virus C is less common. Influenza A epidemics follow the emergence of a novel virus result-ing from genetic shift and a new combination of hemagglutinin (HA) and neuraminidase (NA) genes. Based on the antigenic differences in the neuraminidase and hemagglu-tinin glycoproteins, Influenza virus A is subdivided into several subtypes. New strains of Influenza virus B are instead the result of selective immune pressure that results in small antigenic changes of the hemagglutinin gene. We analyzed the sequences of the H1N1 and H3N2 subtypes of Influenza A (INL A); these subtypes co-dominated the last three influenza seasons in Europe with different distribution of cases between Northern and Southern Europe.
The Influenza viruses data set is composed of more than 40,000 sequences from the NA, HA, and MP genomic regions of H1N1 and H3N2 subtypes (serotypes) of Influenza type A. The average fragment length is 1291 nucleotides and the average number of sequences from each genomic region is greater than 6000. The reader may refer to Table 2 for additional details.
Table 2Data set description of Influenza viruses
Class/genomic region NA HA MP
H1N1 5999 6110 11994
H3N2 4716 4715 9427
Number of sequences 10715 10825 21421
Number of nucleotides 1410 1701 756
The number of sequences and their corresponding nucleotides is shown for each virus subtype (H1N1 and H3N2), which is considered as a different class, and for each genomic region
non-enveloped DNA viruses with an icosaedral capsid which surrounds a circular double stranded DNA genome of about 5 Kb in length. The genome can be subdivided into three functional regions: the early region encoding for the large and small tumour antigens (LT-ag and ST-(LT-ag); the late region encoding for the structural proteins (VP1, VP2 and VP3); and the non-coding control region containing the origin of replication and transcriptional control elements.
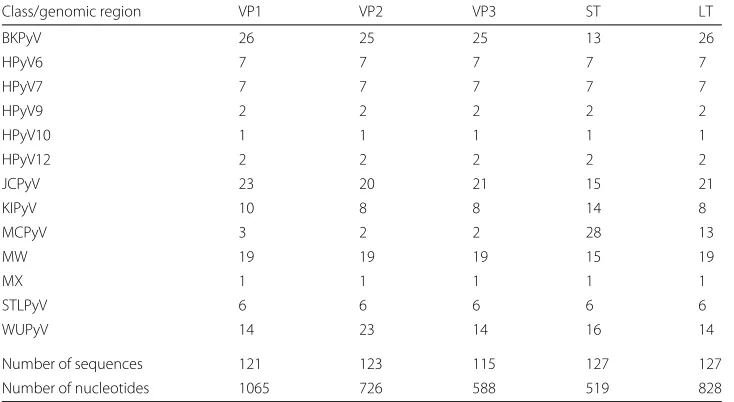
The Polyoma viruses data set is composed of BKPyV, JCPyV, KIPyV, WUPyV, MCPyV, HPyV6, HPyV7, TSPyV, HPyV9, HPyV10 (MW and MX isolates), STLPyV, and HPyV12 sequences. In particular, for each human Polyoma virus five genomic regions (i.e., VP1, VP2, VP3, ST, LT) have been considered. Each genomic region is composed of more than 120 sequences, longer than 450 nucleotides, and belonging to the 13 different species. The reader may refer to Table 3 for additional details.
Human Rhino viruses. Human Rhino viruses (HRV) are considered as the cause of the common cold, but their association with lower respiratory tract infections and with asthma inception has been recently acknowledged [52, 53]. They have been historically classified into 99 reference serotypes in the genus Rhino virus of the family Picornaviri-dae [54], but more than 160 genotypes are now reclassified into three species (HRV-A, B, and C) into the Enterovirus genus of the same family [55, 56]. The increasing use of molecular techniques led to identify species and genotype through phylogenetic analysis,
Table 3Data set description of Polyoma viruses
Class/genomic region VP1 VP2 VP3 ST LT
BKPyV 26 25 25 13 26
HPyV6 7 7 7 7 7
HPyV7 7 7 7 7 7
HPyV9 2 2 2 2 2
HPyV10 1 1 1 1 1
HPyV12 2 2 2 2 2
JCPyV 23 20 21 15 21
KIPyV 10 8 8 14 8
MCPyV 3 2 2 28 13
MW 19 19 19 15 19
MX 1 1 1 1 1
STLPyV 6 6 6 6 6
WUPyV 14 23 14 16 14
Number of sequences 121 123 115 127 127
Number of nucleotides 1065 726 588 519 828
as well as to detect associations with clinical syndromes. Most PCR-based tests for HRV detection target short conserved fragments of 5’ Untranslated Region (UTR) in order to detect the majority of HRVs in one run, but typing of HRVs requires sequencing of longer and more variable genomic regions. In several studies a large portion of the 5’UTR and/or the region coding for viral protein (VP4) and part of the VP2 have been amplified. How-ever, genetic categorization of HRVs is complicated by a wide genetic diversity generating minor variants and novel strains and by recombination events that occurred in the evolu-tionary history, as in the case of HRV-C [57–60]. As an example, most HRV-C strains have a 5’UTR derived from recombination events with HRV-A and would segregate together with HRV-A in a phylogenetic analysis conducted only on the 5’UTR.
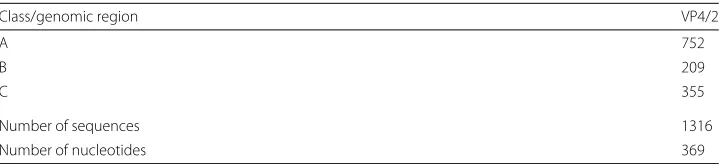
For the HRV data set, we choose the VP4 and part of the VP2 region that codes for structural viral protein, which are phylogenetically characterized in several previous stud-ies [32, 61]. The data set is composed of 1316 sequences from the VP4/2 genomic region with an average length of 222 nucleotides, that belong to the three different species of Rhino virus (species A, B, and C). The reader may refer to Table 4 for additional details.
All the above-mentioned data sets are available at http://dmb.iasi.cnr.it/missel.php. The sequences were originally downloaded from GenBank (http://www.ncbi.nlm.nih. gov/genbank/) and have been aligned with Clustal W of the Bioedit software [62], and then manually edited. We remark that each virus data set includes several gene regions, and that only the sequences of the same gene region are aligned and of the same length.
Experimental results
We test MISSELon the viral genomic sequence data sets of Influenza, Polyoma, and Rhino viruses described above. The parameters used for runningMISSELare reported in Table 5. To assess overfitting of the classification models, we chose different percent-age splits into training and test sets for the different data sets under analysis. In order to further validate our approach and ensure that our results are not unduly affected by overfitting, we performed random permutations of class memberships for each data set. Through these random permutations we test the null hypothesis under whichMISSELis able to extract meaningful subsequences regardless of the class partition imposed on the training set. Such hypothesis would be accepted only in the presence of a marked over-fitting behavior of the algorithm. The details are reported in each subsection related to the different viral data sets. The parameter setting we selected are proven to be robust and effective to achieve reliable results. For what concerns the Maxβ choice, we run MISSEL with an increasing value of β (up to 20) in order to find the right balance between the length of the solutions and the number of equivalent solutions for each data
Table 4Data set description of Rhino viruses
Class/genomic region VP4/2
A 752
B 209
C 355
Number of sequences 1316
Number of nucleotides 369
Table 5Setting of parameters used for the execution ofMISSEL
Maxiter Maxβ Baseσ Dimstore
Influenza viruses 5·104 10–20 5 106
Polyoma viruses 5·104 20 5 106
Rhino viruses 5·104 20 5 106
set. We remark that we are interested in extracting short subsequences and we choseβ accordingly for each data set.
Influenza viruses
Table 6 reports the equivalent and non-dominated solutions for the Influenza viruses data set obtained by the algorithm. We fix the maximum solutions length to 10 for HA and NA genomic regions (i.e.,β≤10) and to 20 for the largest MP genomic region (i.e.,β≤20).
We provide the score value (formula 4) along the positions of the sequence, see Panels (a)-(c) of Fig. 4. Positions with high score values indicate locations of the sequence where a large number of discriminant subsequences intersect - higher values indicating portions more interesting and rich in separating power.
Then, we test all the extracted classification models using a percentage split schema of 30% for training and 70% for testing for the NA and HA genomic regions, and 15% for training and 85% for testing for the MP genomic region. We choose the previously mentioned training and test percentage splits because of the high number of sequences (i.e., more than ten thousands) and in order to obtain balanced training sets of adequate size. The results are listed in Table 7, where we highlight how the classification accuracy rates stand out at an average of 99–100% for both training and test set for HA and NA genomic regions (β ∈[ 1, 10]). As far as the MP genomic region is concerned, we observe a higher variability of results and an average correct classification rate on training and test set of 71%. Furthermore, Panel (a)-(c) of Fig. 2 and Fig. 3 report the bar plots with the percentage of correct recognition rates, averaged on the sameβvalues, and obtained on the test and training set of Influenza viruses, respectively.
Additional validation is performed by applying the algorithm to data with random permutations of class membership. Such a test is repeated for 100 different random permutations. The average classification performances obtained from the solutions are extremely poor, never exceeding 52% in training or 38% in testing, with an empirical p-value below 0.001, thus confirming the validity of our method.
Polyoma viruses
Table 8 lists the number of solutions that are equivalent and non-dominated. Here, we extract alternative solutions of maximum size 20 (i.e.,β ≤ 20) for the Polyoma viruses data set.
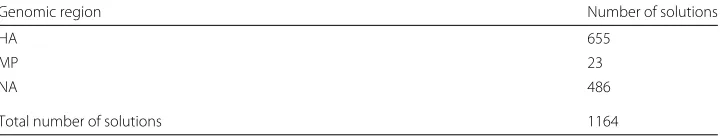
Table 6Number of equivalent and non-dominated solutions for Influenza viruses H1N1 and H3N2 withβ≤10 for HA and NA genomic regions andβ≤20 for MP genomic region
Genomic region Number of solutions
HA 655
MP 23
NA 486
Table 7Classification accuracy on training and test set for the 3 genomic regions of Influenza viruses (mean±standard deviation computed on all solutions)
Genomic region β Train [%] Test [%]
HA 2 95.44±17.14 95.46±17.05
3 99.99±0.06 99.98±0.08
4 99.99±0.11 99.96±0.15
5 100±0.06 99.98±0.09
6 100 99.99±0.04
7 100 99.99±0.04
8 100 99.98±0.05
9 100 99.98±0.06
10 100 99.98±0.07
NA 2 100±0.01 99.98±0.02
3 99.98±0.11 99.96±0.13
4 100 99.99±0.02
5 100 99.99±0.02
6 100 99.99±0.02
7 100 99.99±0.03
8 100 99.99±0.03
9 100 99.99±0.02
10 100 100±0.01
MP 2 56.72±29.09 56.41±28.95
3 84.59±5.75 83.94±5.48
5 38.46±2.44 38.39±2.54
8 71.15±40.04 71.24±40.10
9 81.01 80.96
12 81.51 80.72
19 91.66 91.14
Accuracy rates of extracted equivalent and non-dominated solutions withβ≤10
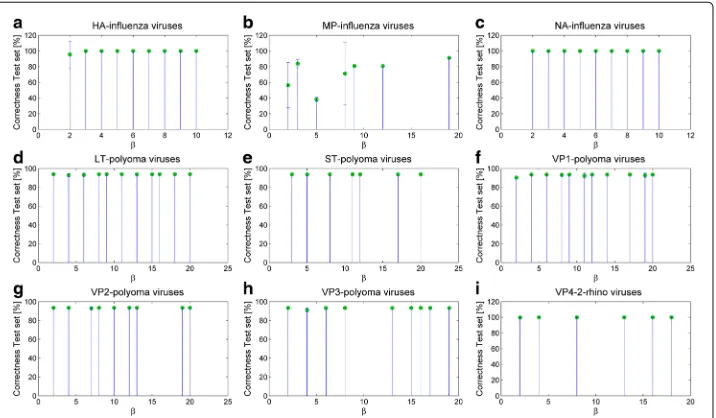
Fig. 2Bar plots of the classification performances on the test sets for the three analyzed types of viruses. The reported values are averaged on the solutions with the same value ofβ; the error bars refer to the
Fig. 3Bar plots of the classification performances on the training sets for the three analyzed types of viruses. The reported values are averaged on the solutions with the same value ofβ; the error bars refer to the corresponding standard deviations computed on all solutions.aHAbMPcNA data sets of Influenza viruses, dLTeSTfVP1gVP2hVP3 data sets of Polyoma viruses, andiVP4/2 data sets of Rhino viruses
We compute the above-mentioned scores that provide a map of the solutions with respect to their location along the sequence -see panels (d)–(h) of Fig. 4.
Then, we evaluate how those solutions perform in terms of classification rate. We use a percentage split schema with 80% for training and 20% for testing. The results of the clas-sification of alternative solutions on Polyoma viruses are reported in Table 9. Rangingβ from 1 to 20, we obtain averaged correct classification rates of 100% on training set and 93% with very low standard deviation values on test set for all the extracted solution. The bar plots with the correct classification rate averaged on the sameβvalues and obtained on the test and training set of Polyoma viruses are reported in Panels (d)-(h) of Fig. 2 and Fig. 3. When compared with the classification performance under random permuta-tions of class memberships, the subsequences obtained on real classes result significantly different from those obtained on random ones (p<0.001).
Rhino viruses
Table 10 lists the number of all the equivalent and non-dominated solutions. We set the maximum solution length to 20 (i.e.,β ≤20). We compute the scores for each position of the sequence and provide a map of the sequence in Panel (i) of Fig. 4. Several peaks in score appear for Rhino virus genomic region VP4/2. We note how some areas appear much denser than others.
Table 8Number of equivalent and non-dominated solutions for Polyoma viruses withβ≤20
Genomic region Number of solutions
LT 53
ST 17
VP1 84
VP2 22
VP3 18
Fig. 4Distribution of non-dominated solutions for genomic regions:aHAbMPcNA of Influenza viruses,d LTeSTfVP1gVP2hVP3 of Polyoma viruses, andiVP4/2 of Rhino viruses
Coming to classification performances, we use a percentage split schema of 80% for training and 20% for testing. Table 11 shows the classification results. We point out that all the alternative classification models perform with a really high reliability, i.e., an average of 100% correct classification rate on training set and 99.96% on test set, withβ ∈[ 1, 20]. Panel (i) of Fig. 2 and Fig. 3 report the bar plots with the percentage of correct classifica-tions averaged on the sameβ values and obtained on the test and training set of Rhino viruses, respectively.
The comparison with the performance under random permutations of class member-ships confirms that our method is able to identify meaningful signals in the data: correct classification rates on 100 randomly permuted instances are always below 20%, and the related p-value below 0.001.
All the results described above, as well as the extracted subsequences for each virus data set are available at http://dmb.iasi.cnr.it/missel.php and provided as Additional file 2, where the reader may also find all the specific nucleotides distinguishing the species for further investigation.
Comparative analysis
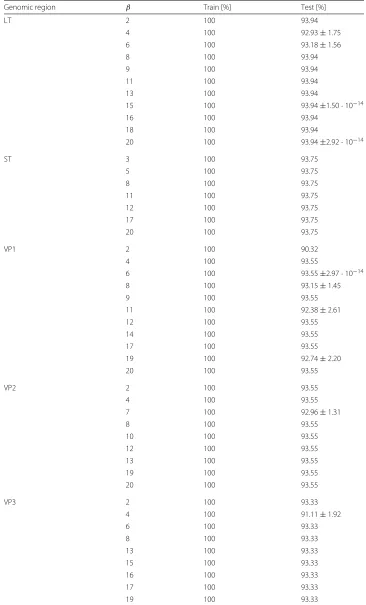
Table 9Classification accuracy on training and test set for the 5 genomic regions of polyomaviruses (mean±standard deviation computed on all solutions)
Genomic region β Train [%] Test [%]
LT 2 100 93.94
4 100 92.93±1.75
6 100 93.18±1.56
8 100 93.94
9 100 93.94
11 100 93.94
13 100 93.94
15 100 93.94±1.50·10−14
16 100 93.94
18 100 93.94
20 100 93.94±2.92·10−14
ST 3 100 93.75
5 100 93.75
8 100 93.75
11 100 93.75
12 100 93.75
17 100 93.75
20 100 93.75
VP1 2 100 90.32
4 100 93.55
6 100 93.55±2.97·10−14
8 100 93.15±1.45
9 100 93.55
11 100 92.38±2.61
12 100 93.55
14 100 93.55
17 100 93.55
19 100 92.74±2.20
20 100 93.55
VP2 2 100 93.55
4 100 93.55
7 100 92.96±1.31
8 100 93.55
10 100 93.55
12 100 93.55
13 100 93.55
19 100 93.55
20 100 93.55
VP3 2 100 93.33
4 100 91.11±1.92
6 100 93.33
8 100 93.33
13 100 93.33
15 100 93.33
16 100 93.33
17 100 93.33
19 100 93.33
Table 10Number of equivalent and non-dominated solutions for Rhino viruses withβ≤20
Genomic region Number of solutions
VP4/2 (ABC-Rhino) 11
1. For each genomic region we set as input sequences the ones belonging to a given class, e.g., Rhino viruses A of VP4/2 region;
2. For each genomic region we set as control sequences the ones belonging to all the other classes, e.g., Rhino viruses B and C of VP4/2 region;
3. We set the E-value threshold (i.e., the expected number of false positives) to10−40
for Influenza and Rhino viruses and to10−10for Polyoma viruses; we set this threshold very near 0 since alsoMISSELis designed to discover short subsequences resulting in the accuracy range of 99% - 100%;
4. We extract the motifs that characterize each class in the considered genomic region.
The above-mentioned motifs are compared with those extracted byMISSELthat, con-versely to DREME, is able to compute the species specific subsequences for all classes at once.
When considering Influenza viruses, DREME identifies a total of 290 motifs: 76 for HA, 129 for MP, and 85 for NA gene region, respectively. In this case,MISSELextracts a larger number of subsequences (more than one thousand with an average accuracy of 99.9%) and therefore it provides the investigator with a larger number of solutions.
For Polyoma viruses, we perform the motif discovery only on gene region ST due to the large number of comparisons among the available classes that one would otherwise have to run with DREME. In this case, it identifies a total of 481 motifs. The number of the motifs extracted byMISSEL(i.e., 17) is smaller, and hence our approach allows focusing on core subsequences related to the investigated virus class. Furthermore, DREME does not find enriched short motifs for those classes with a set of under-represented sequences, conversely to MISSEL that finds solutions even for classes with a small number of sequences.
When considering Rhino viruses, DREME identifies a total of 101 motifs for VP4/2 region. The size of the motifs extracted byMISSELis smaller (i.e., 11 subsequences), and hence our approach allows focusing on core motifs related to the investigated class of the virus.
To summarize, when dealing with a few number of classes (e.g., Influenza viruses) an approach like DREME is viable when dealing with problems with a small number of classes; when dealing with more than three classes, in order to extract a manageable number of motifs, one has to set an unrealistically high E-value threshold. Conversely,
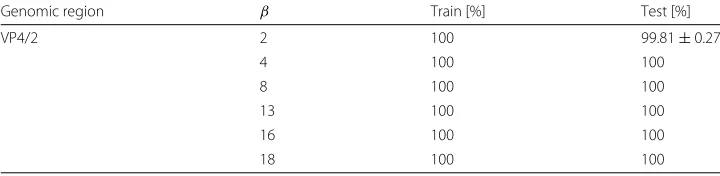
Table 11Classification accuracy on training and test set for Rhino viruses genomic region (mean± standard deviation computed on all solutions). Accuracy rates of extracted equivalent and
non-dominated solutions withβ≤20
Genomic region β Train [%] Test [%]
VP4/2 2 100 99.81±0.27
4 100 100
8 100 100
13 100 100
16 100 100
a supervised-based method likeMISSELcan be preferable when addressing multiclass problems (e.g., Polyoma viruses) both from a computational point of view and in terms of classification performance.
To conclude, we wish to highlight that most of the subsequences extracted byMISSEL are different from the ones computed by state-of-the-art motif discovery methods provid-ing additional knowledge to the investigators and enhancprovid-ing the novelty of our approach. Finally, unlike motif discovery approaches, MISSEL is able to identify the discrimi-nating subsequences, their contiguous position, and is able to locate them along the region.
Conclusions
In this paper, we have presented a method that extracts, from a set of sequences belonging to different classes, small subsequences that contain sufficient information to discrimi-nate among the classes. The method addresses a new problem in sequence analysis and is based on a specifically designed genetic algorithm. Data sets of sequences from viral species belonging to different types (DNA virus, positive stranded RNA virus, negative stranded fragmented RNA virus) were used to test the method.
We can draw several conclusions based on the work that has been presented, below we divide these into algorithmic conclusions, which concern MISSELin general, and biological conclusions, which concern the virus classification applications we presented. The latter are indeed important to show the potential of the proposed method in other applications.
From thealgorithmic standpoint, the method appears to be effective both for the qual-ity of its solutions and for the small computational effort required. The use of a properly designed genetic algorithm seems to be the right choice for this problem, and cuts down significantly the search time. The abundance of alternative solutions for the three appli-cations poses a challenge to experts that use supervised learning methods: how many alternative solutions of high quality can one find for a classification task?MISSELanswers this question for a specific environment and it is clearly shown by the experimental results that the identified subsequences are all of utmost quality when tested with standard clas-sifiers. Such a fact is strongly confirmed by the tests run on randomized data, for all three cases. We highlight that the method can be applied straightforwardly to any supervised learning setting where data is described by strings on any alphabet.
From thebiological standpoint, the results indicate several aspects worthy of further analysis and investigation that are beyond the scope of this paper, but will stimulate future research.
Fig. 5Distribution of the number of extracted solutions for eachβvalue of genomic regions:aHAbMPc NA of Influenza viruses,dLTeSTfVP1gVP2hVP3 of Polyoma viruses, andiVP4/2 of Rhino viruses. The x axes report the length of solution (β); y axes refer to the number of extracted solutions for eachβ
by a large relative abundance of separating sequences are indeed those where selective pressure has been stronger.
A second interesting aspect is related to the small length (i.e., value ofβ) of the sepa-rating subsequences - summarized in Fig. 5, where we provide the number of equivalent and non-dominated subsequences identified, averaged on their length (i.e., on eachβ). An overview of the all theβvalues of each extracted solution is reported in Fig. 6, according to decreasing values ofβ. While we provide a bound to the length of the subsequences, results show that the vast majority of solutions have much smaller length.
Thirdly, length distributions vary markedly from region to region within the same virus: the skewness of the distribution exhibited by solutions in the Influenza MP region when compared with HA and NA regions, as well as the large number of solutions of maximal size for LT-Polyoma, indicate that characterizing mutations may happen in nucleotide positions, which are distant along the sequence.
Finally, the abundance of small separating subsequences may be an important sup-port for quick and robust virus identification in settings where samples are drawn from different locations in the host body, and different - possibly unknown - virus types may be present. The availability of a well-characterized set of subsequences that can identify a virus class with respect to the other known classes would allow the construction of a reliable ensemble classifier even in the presence of unknown types.
In conclusion, we list some future extensions of the work presented in this paper. We plan to apply our method to different genomic viral sequences, as well as to more general species classification problems (e.g., DNA Barcoding [24]). It would be also interesting to extend our algorithm to deal with other classification problems within the domain of DNA, RNA or protein sequences. To conclude, it would be very useful to set up an open-access and comprehensive database comprising all separating subsequences identified in the analyzed species.
Additional files
Additional file 1:The user guide forMISSELsoftware, which is a pdf file with all the instructions for the user to run the software. (PDF 891 KB)
Additional file 2:This supplementary data package includes the experimental results of MISSEL. In particular, the reader may find three folders.
(1) classification_results: the spreadsheet files with the classification results for the three viral data sets (3 gene regions for Influenza, 5 gene regions for Polyoma, 1 gene region for Rhinoviruses) on training and test sets. (2) discriminating_positions: the comma separated spreadsheet files with the discriminative positions for the three
viral data sets (3 gene regions for Influenza, 5 gene regions for Polyoma, 1 gene region for Rhinoviruses). (3) positions_score: the comma separated spreadsheet files with the score values on the three viral data sets
(3 gene regions for Influenza, 5 gene regions for Polyoma, 1 gene region for Rhinoviruses). (RAR 292 KB)
Abbreviations
A: Adenine; BK: B.K. (patient initials); BKPyV: B.K. (patient initials) polyomavirus; C: Cytosine; DNA: Deoxyribonucleic acid; G: Guanine; GA: Genetic Algorithm; HRV: Human Rhino viruses; HA: Gene region Influenza hemagglutinin; HPv: Human Polyoma virus; INL: Influenza viruses; JC: John Cunningham; JCPyV: John Cunningham polyomavirus; KI: Karolinska Institute; KIPyV: Karolinska Institute polyomavirus; LT: Large t antigen; MC: Merkel cell; MCPyV: Merkel cell polyomavirus; MISSEL: Multiple SubSequences Extractor for cLassification; MP: Gene region Influenza Matrix Protein; NA: Gene region Influenza viral neuraminidase; NCCR: Noncoding control region; PML: Progressive multifocal leucoencephalopathy; ST: Small t antigen; STLPyV: Saint Louis polyomavirus; T: Thymine; TSPyV: Trichodysplasia spinulosa polyomavirus; UTR: Untranslated Region; VP1: Gene region VP1; VP2: Gene region VP2; VP3: Gene region VP3; VP4/2: Gene region viral protein VP4 and part of VP2; WU: Washington University; WUPyV: Washington University polyomavirus
Acknowledgements Not applicable.
Funding
The research is supported by the FLAGSHIP “InterOmics” project [PB.P05] and The Epigenomics Flagship Project (Progetto Bandiera Epigenomica) “EPIGEN” [PB.P01] funded by Italian Ministry of Education, University and Research (MIUR) and the National Research Council of Italy (CNR).
Availability of data and material
Authors’ contributions
GFel, GF, EW, PB wrote the paper. GF, EW, GFel designed and implemented the algorithm. EW developed the software package. GF, EW performed the experiments. GF analyzed and performed the presentation of the results. GFel, PB directed the research. AP inspired the idea of investigating short sequence regions, wrote the Rhino viruses introduction, and contributed to the biological validation. MC inspired and directed biological research. MCio wrote the virology introduction and contributed to the biological validation. ALP, EC downloaded and aligned virus sequences. MBM downloaded Influenza virus sequences. MG downloaded Rhino virus sequences. All authors read and approved the final version of this manuscript.
Competing interests
The authors declare that they have no competing interests.
Consent for publication Not applicable.
Author details
1Institute of Systems Analysis and Computer Science A. Ruberti (IASI), National Research Council (CNR), Via dei Taurini 19, 00185 Rome, Italy.2Department of Engineering, Uninettuno International University, Corso Vittorio Emanuele II 39, 00186 Rome, Italy.3Department of Infectious Diseases, Istituto Superiore di Sanita, Viale Regina Margherita 299, 00161 Rome, Italy.4Public Health and Infectious Diseases, Sapienza University, Piazzale Aldo Moro 5, 00185 Rome, Italy.5Department of Biology, University of Rome Tor Vergata, Via della Ricerca Scientifica 1, 00133 Rome, Italy.6Foundation of Technical Education, Sulaimaniyah, Kurdistan Region, Iraq.7Laboratory of Molecular Virology, Polyclinic Tor Vergata Foundation, Viale Oxford 81, 00133 Rome, Italy.8Virology Laboratory, Department of Molecular Medicine, Sapienza University, Viale di Porta Tiburtina 2, 00185 Rome, Italy.
Received: 4 July 2016 Accepted: 20 November 2016
References
1. Woese C, Fox G. Phylogenetic structure of the prokaryotic domain: the primary kingdoms. PNAS. 1977;74:5088–90. 2. Nanney DL. Dgenes and phenes in tetrahymena. Bioscience. 1982;32:783–40.
3. Pace NR. A molecular view of microbial diversity and the biosphere. Bioscience. 1997;276:734–40.
4. Brown B, Emberson RM, Paterson AM. Mitochondrial coi and ii provide useful markers for weiseana (lepidoptera, hepialidae) species identification. Bull Entomol. 1999;89:287–94.
5. Bucklin A, Guarnieri M, Hill RS, Bentley AM, Kaartvedt S. Taxonomic and systematic assessment of planktonic copepods using mitochondrial coi sequence variation and competitive species-specific pcr. Hydrobiology. 1999;401:239–54.
6. Hebert P, Stoeckle M, Zemlak T, Francis C. Identification of birds through coi dna barcodes. PLOS Biol. 2004;2:1–7. 7. van Velzen R, Weitschek E, Felici G, Bakker FT. Dna barcoding of recently diverged species: relative performance of
matching methods. PloS one. 2012;7(1):30490.
8. Farris S. Estimating Phylogenetic Trees from Distance Matrices James. Am Nat. 1972;106(951):645–68.
9. Saitou N. The neighbour-joining method: a new method for reconstructing phylogenetic trees. Mol Biol Evol. 1987;4: 406–25.
10. Munch K, Boomsma W, Huelsenbeck JP, Willerslev E, Nielsen R. Statistical assignment of dna sequences using bayesian phylogenetics. Syst Biol. 2008;57(5):750–7.
11. Altschul SF, Madden TL, Schäffer AA, Zhang J, Zhang Z, Miller W, Lipman DJ. Gapped blast and psi-blast: a new generation of protein database search programs. Nucleic Acids Res. 1997;25(17):3389–402.
12. Austerlitz F, David O, Schaeffer B, Bleakley K, Olteanu M, Leblois R, Veuille M, Laredo C. Dna barcode analysis: a comparison of phylogenetic and statistical classification methods. BMC Bioinforma. 2009;10(Suppl 14):10. 13. Meier R, Shiyang K, Vaidya G, Ng PK. Dna barcoding and taxonomy in diptera: a tale of high intraspecific variability
and low identification success. Syst Biol. 2006;55(5):715–28.
14. DasGupta B, Konwar KM, M˘andoiu I, Shvartsman AA. Dna-bar: distinguisher selection for dna barcoding. Bioinformatics. 2005;21(16):3424–6.
15. Weitschek E, Velzen R, Felici G, Bertolazzi P. Blog 2.0: a software system for character-based species classification with dna barcode sequences. what it does, how to use it. Mol Ecol Res. 2013;13(6):1043–6.
16. Sarkar IN, Planet PJ, Desalle R. caos software for use in character-based dna barcoding. Mol Ecol Res. 2008;8(6): 1256–9.
17. Little DP. Dna barcode sequence identification incorporating taxonomic hierarchy and within taxon variability. PLoS ONE. 2011;6(8):20552.
18. Liu C, Liang D, Gao T, Pang X, Song J, Yao H, Han J, Liu Z, Guan X, Jiang K, et al. Ptigs-idit, a system for species identification by dna sequences of the psba-trnh intergenic spacer region. BMC Bioinforma. 2011;12(Suppl 13):4. 19. Albu M, Nikbakht H, Hajibabaei M, Hickey DA. The dna barcode linker. Mol Ecol Res. 2011;11(1):84–8. 20. Kuksa P, Pavlovic V. Efficient alignment-free dna barcode analytics. BMC Bioinforma. 2009;10(Suppl 14):9. 21. Weitschek E, Cunial F, Felici G. Laf: Logic alignment free and its application to bacterial genomes classification.
BioData Mining. 2015;8(1):1.
22. Tan P, Steinbach M, Kumar V. Introduction to Data Mining. Boston: Addison Wesley; 2005.
23. Kotsiantis SB, Zaharakis I, Pintelas P. Supervised machine learning: A review of classification techniques. In: Proceedings of the 2007 Conference on Emerging Artificial Intelligence Applications in Computer Engineering; 2007. p. 3–24.
25. Lavigne R, Darius P, Summer EJ, Seto D, Mahadevan P, Nilsson AS, Ackermann HW, Kropinski AM. Classification of myoviridae bacteriophages using protein sequence similarity. BMC Microbiol. 2009;9(1):224.
26. Bao Y, Chetvernin V, Tatusova T. Pairwise sequence comparison (pasc) and its application in the classification of filoviruses. Viruses. 2012;4(8):1318–27.
27. Weitschek E, Presti AL, Drovandi G, Felici G, Ciccozzi M, Ciotti M, Bertolazzi P. Human polyomaviruses identification by logic mining techniques. Virol J. 2012;9(1):1–6.
28. Muhire B, Martin DP, Brown JK, Navas-Castillo J, Moriones E, Zerbini FM, Rivera-Bustamante R, Malathi V, Briddon RW, Varsani A. A genome-wide pairwise-identity-based proposal for the classification of viruses in the genus mastrevirus (family geminiviridae). Arch Virol. 2013;158(6):1411–24.
29. Hara K, Rivera MM, Koh C, DeMino M, Page S, Nagabhyru PR, Rehermann B, Liang TJ, Hoofnagle JH, Heller T. Sequence analysis of hepatitis c virus from patients with relapse after a sustained virological response: relapse or reinfection? J Infect Dis. 2014;209(1):38–45.
30. Kaji M, Watanabe A, Aizawa H. Differences in clinical features between influenza a h1n1, a h3n2, and b in adult patients. Respirology. 2003;8(2):231–3.
31. Midulla F, Pierangeli A, Cangiano G, Bonci E, Salvadei S, Scagnolari C, Moretti C, Antonelli G, Ferro V, Papoff P. Rhinovirus bronchiolitis and recurrent wheezing: 1-year follow-up. Eur Respir J. 2012;39(2):396–402.
32. Pierangeli A, Ciccozzi M, Chiavelli S, Concato C, Giovanetti M, Cella E, Spano L, Scagnolari C, Moretti C, Papoff P, et al. Molecular epidemiology and genetic diversity of human rhinovirus affecting hospitalized children in rome. Med Microbiol Immunol. 2013;202(4):303–11.
33. Colorni A, Dorigo M, Maniezzo V, et al. An investigation of some properties of anant algorithm. In: Proceedings Of The Parallel Problem Solving From Nature Conference (Ppsn 92). Brussels: Elsevier Publishing; 1992. p. 509–20. 34. Holland JH. Adaptation in Natural and Artificial Systems: An Introductory Analysis with Applications to Biology,
Control, and Artificial Intelligence. Ann Arbor, MI: U Michigan Press; 1975.
35. Kirkpatrick S, Gelatt CD, Vecchi MP, et al. Optimization by simmulated annealing. Science. 1983;220(4598): 671–80.
36. Glover F. Tabu search-part i. ORSA J Comput. 1989;1(3):190–206.
37. James K, Russell E. Particle swarm optimization. In: Proceedings of 1995 IEEE International Conference on Neural Networks. Perth: The University of Western Australia; 1995. p. 1942–1948.
38. Li X. A non-dominated sorting particle swarm optimizer for multiobjective optimization. In: Genetic and Evolutionary Computation—GECCO 2003. Berlin Heidelberg: Springer; 2003. p. 37–48.
39. Handl J, Kell DB, Knowles J. Multiobjective optimization in bioinformatics and computational biology. IEEE/ACM Trans Comput Biol Bioinforma (TCBB). 2007;4(2):279–92.
40. Michailides C, Angelides DC. Optimization of a flexible floating structure for wave energy production and protection effectiveness. Eng Struct. 2015;85:249–63.
41. Deb K, Reddy AR. Reliable classification of two-class cancer data using evolutionary algorithms. BioSystems. 2003;72(1):111–29.
42. Miettinen K. Nonlinear Multiobjective Optimization vol. 12. New York: Springer; 1999.
43. Browne WJ, Goldstein H, Rasbash J. Multiple membership multiple classification (mmmc) models. Stat Model. 2001;1(2):103–24.
44. Maris E. Estimating multiple classification latent class models. Psychometrika. 1999;64(2):187–212. doi:10.1007/BF02294535.
45. Liu J, Iba H. Selecting informative genes using a multiobjective evolutionary algorithm. In: Evolutionary Computation, 2002. IEEE; 2002. p. 297–302.
46. Kohavi R, John GH. Wrappers for feature subset selection. Artif Intell. 1997;97(1):273–324.
47. Bertolazzi P, Felici G, Festa P, Fiscon G, Weitschek E. Integer programming models for feature selection: New extensions and a randomized solution algorithm. Eur J Oper Res. 2016;250(2):389–99.
48. Festa P, Resende MGC. Hybrid GRASP heuristics. Stud Comput Intell. 2009;203:75–100.
49. Festa P, Resende MGC. GRASP: Basic components and enhancements. Telecommun Syst. 2011;46:253–71. 50. Bertolazzi P, Felici G, Festa P, Lancia G. Logic classification and feature selection for biomedical data. Comput Math
Appl. 2008;55:889–99.
51. Dulli S, Furini S, Peron E. Data Mining. New York: Springer; 2009.
52. Kaiser L, Aubert JD, Pache JC, Deffernez C, Rochat T, Garbino J, Wunderli W, Meylan P, Yerly S, Perrin L, et al. Chronic rhinoviral infection in lung transplant recipients. Am J Respir Crit Care Med. 2006;174(12):1392–9. 53. Jackson JL, Lesho E, Peterson C. Zinc and the common cold: a meta-analysis revisited. J Nutrition. 2000;130(5):
1512–5.
54. Hamparian V, Colonno R, Cooney M, Dick E, Gwaltney Jr J, Hughes J, Jordan Jr W, Kapikian A, Mogabgab W, Monto A. A collaborative report: rhinoviruses–extension of the numbering system from 89 to 100. Virology. 1987;159(1):191–2.
55. Tapparel C, Junier T, Gerlach D, Cordey S, Van Belle S, Perrin L, Zdobnov EM, Kaiser L. New complete genome sequences of human rhinoviruses shed light on their phylogeny and genomic features. BMC Genomics. 2007; 8(1):224.
56. Carstens E. Ratification vote on taxonomic proposals to the international committee on taxonomy of viruses (2009). Arch Virol. 2010;155(1):133–46.
57. Huang T, Wang W, Bessaud M, Ren P, Sheng J, Yan H, Zhang J, Lin X, Wang Y, Delpeyroux F, et al. Evidence of recombination and genetic diversity in human rhinoviruses in children with acute respiratory infection. PLoS One. 2009;4(7):6355.
58. Wisdom A, Leitch EM, Gaunt E, Harvala H, Simmonds P. Screening respiratory samples for detection of human rhinoviruses (hrvs) and enteroviruses: comprehensive vp4-vp2 typing reveals high incidence and genetic diversity of hrv species c. J Clin Microbiol. 2009;47(12):3958–67.
60. McIntyre CL, Knowles NJ, Simmonds P. Proposals for the classification of human rhinovirus species a, b and c into genotypically assigned types. J Gen Virol. 2013;94(Pt 8):1791–806.
61. Broberg E, Niemela J, Lahti E, Hyypia T, Ruuskanen O, Waris M. Human rhinovirus associated severe pneumonia in a neonate. J Clin Virol. 2011;51(1):79–82.
62. Hall TA. Bioedit: a user-friendly biological sequence alignment editor and analysis program for windows 95/98/nt. In: Nucleic Acids Symposium Series, vol. 42. Oxford: Oxford University Press; 1999. p. 95–8.
63. Bailey TL, Boden M, Buske FA, Frith M, Grant CE, Clementi L, Noble WS. MEME SUITE: tools for motif discovery and searching. Nucleic Acids Res. 2009;37(Web Server issue):W202–8. doi:10.1093/nar/gkp335.
64. Bailey TL. Dreme: motif discovery in transcription factor chip-seq data. Bioinformatics. 2011;27(12):1653–9.
• We accept pre-submission inquiries
• Our selector tool helps you to find the most relevant journal
• We provide round the clock customer support
• Convenient online submission
• Thorough peer review
• Inclusion in PubMed and all major indexing services
• Maximum visibility for your research
Submit your manuscript at www.biomedcentral.com/submit