Original Research Article
A study of non-communicable diseases risk factors among the tribal
population of Lefunga block, Tripura: cross sectional study
Aman Kumar
1*, Rupali Choudhury
2, Sushma Yadav
2INTRODUCTION
The burden of non-communicable diseases (NCDs) such as diabetes and coronary heart disease is increasing both globally and in India. In 2008, of the 57 million global deaths, 36 million or 63% were due to NCDs and out of which CVDs were responsible for 47.9% deaths which is the largest proportion of NCD related deaths.1 It may be said that not only developed countries will be affected by NCD, the developing countries will also equally, even
more, will be affected.2 The rate of increase of NCD in developing countries is almost double in comparison to developed countries.3 It seems reasonable to argue that people with changing lifestyles due to growing urbanization are associated with adverse NCD risk factors irrespective of their habitat.4 From rural 6.7% of women and 58.9% of men consume alcohol. 12.8% women and 14.9% men are overweight and obese (BMI>25 kg/m2) in rural area of 15-49 age group and same for men is 13.4%.5
ABSTRACT
Background: The burden of non-communicable diseases such as diabetes and coronary heart disease is increasing both globally and in India. The present study was conducted to estimate the prevalence of risk factors associated with non-communicable disease and to study the association of the risk factors with non-communicable disease among tribal population of Lefunga Block of Tripura.
Methods: A cross-sectional study was conducted in Lefunga block during April to June 2017 among 150 Indigenous tribal population of Tripura. Multistage random sampling was used. A predesigned, pretested, semi-structured modified WHO STEPs questionnaire was used. Chi square and Multiple Logistic Regression was done to see association.
Results: Mean age was 39.03±12.76 years. Majority (66.7%) were females and (44.7%) had studied up to secondary. (26%) were tobacco smokers and (68%) were tobacco chewing. (36%) were alcoholic. (89.3%) had exercising for <2.5 hrs. 68% were taking vegetables >10 times/ week and 88.7% were taking fruits <5 times/week. (26%) were overweight, (45.3%) had abdominal obesity and 31% were hypertensive. 93.3% were aware of the harmful effects of tobacco consumption. Multiple logistic regression analysis showing factors associated with male were more likely to had higher abdominal obesity and alcohol user >50 yrs, government employee. With smoking, male having more chances of smoking and Age group of 20-30 yrs and 31-40 yrs.
Conclusions: The mean age was 39.03±12.76 years. (26%) were overweight, (45.3%) had abdominal obesity and (31%) were hypertensive. NCD clinic, IEC should be increased.
Keywords: NCD, Tribal, Lifestyle risk factors, WHO STEPS questionnaire
Department of Community Medicine, 1Institute for Medical Sciences and Research Centre, Jaipur, Rajasthan;
2
Agartala Government Medical College, Agartala, Tripura, India
Received: 21 July 2018
Accepted: 22 August 2018
*Correspondence:
Dr. Aman Kumar,
E-mail: [email protected]
Copyright: © the author(s), publisher and licensee Medip Academy. This is an open-access article distributed under the terms of the Creative Commons Attribution Non-Commercial License, which permits unrestricted non-commercial use, distribution, and reproduction in any medium, provided the original work is properly cited.
However,there is paucity of information regarding the non-communicable diseases risk factors among tribal population of Tripura. Hence the present study has been conducted to estimate the prevalence of risk factors associated with non-communicable disease among tribal population of Lefunga block of Tripura and to study the association of the risk factors with non-communicable disease among tribal population of Lefunga block of Tripura.
METHODS
This was a cross-sectional study conducted in a rural community Lefunga block during April to June 2017 among 150 Indigenous tribal population of Tripura. Indigenous tribes viz. Debbarma, Koloi, Jamatias were populated in these areas. The study was conducted among 150 indigenous tribal residents of the area considering a Prevalence of risk factor for NCD to be 11% reported by Oommen from a cross sectional study among Rural and Urban area of Tamil Nadu, with an absolute precision of 5 per cent at 5% level of significance.6
Multistage random sampling technique was used in the present study. Lefunga block had 10 villages out of which 5 villages were selected by simple random sampling in 1st stage. Then in the 2nd stage, from each village, 30 families were selected (as per Panchayat family registers) by systematic random sampling method considering every 2nd house. Data were collected through house to house visit. A predesigned, pretested semi-structured modified version of WHO STEPS questionnaire was used. Due to limited resources, biochemical analysis (STEPS 3) was not conducted. STEPS 1 included information on age, sex, education, marital status, tobacco use, alcohol consumption, consumption of fruits, vegetables and physical activity. In STEPS 2 height, weight, waist circumference and blood pressure were measured. Weighing machine, constant tension tape and stadiometer were used to measure weight, waist circumference and height, respectively. Blood pressure was measured using Omron digital automatic blood pressure monitor three times. The average of the last two readings was taken as the final reading for that participant. All the measurements were taken according to the STEPS protocol. Re-calibration of equipment was done at regular intervals pregnant woman. Persons below 18 years, Bed ridden patients with debilitating illness and who did not give consent were excluded from the study. Individual data collections were kept anonymous and strict confidentiality was maintained.
Data analysis was done by SPSS V19.0. Descriptive statistics were expressed in frequencies and percentages. Chi square test was applied to assess the association of different variables. P<0.05 was considered statistically significant. Multiple logistic regression analysis was applied to identify the risk factor association with demographic profile. Those variables which were found to be significantly associated with NCD risk factor by
using Chi square test and Fisher exact test were only used as predictor variable in multiple logistic regression analysis. The study was conducted after obtaining permission from institutional ethics committee of Agartala Govt. Medical College.
RESULTS
Table 1 showed that the total number of respondents was 150. The mean age of the respondents was 39.03±12.76 years with a range of 20-70 years. The sample had 66.7% females and 33.3% males. Majority of the study participants were married, studied upto secondary school (44.7%) and 52% were not involved in any occupation at the time of study.
Table 1: Demographic characteristics of respondents.
Characteristics Respondents Frequency
(N) %
Sex Male 50 33.3
Female 100 66.7
Age group (in years)
20-30 56 37.3 31-40 38 25.3 41-50 24 16 >50 32 21.3
Marital status
Married 136 90.7 Unmarried 6 4.0 Widow 8 5.3
Religion Hindu 128 85.3
Christian 22 14.7
Literacy
Illiterate 23 15.3 Literate 18 12.0 Primary
School 32 21.3 Secondary
School 67 44.7 Higher
Secondary & Above
10 6.6
Occupation
Homemaker 78 52.0 Unskilled
labourer 37 24.7 Skilled
labourer 14 9.3 Govt.
employee 8 5.3 Self
employed 13 8.7
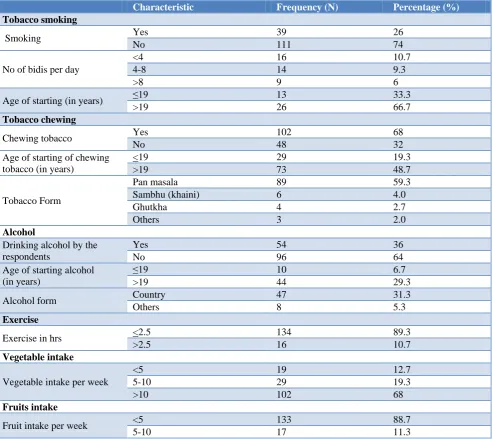
masala and 48.7% respondents started chewing tobacco after the age of 19 yrs. 36% of respondents were engaged in the drinking activity where 31.3% drink country liquor.
89.3% respondents are doing exercise for <2.5 hrs, 68% people are taking vegetables more than 10 times per week and 88.7% people are taking fruits less than 5 times.
Table 2: Behavioural risk factors of non-communicable diseases.
Characteristic Frequency (N) Percentage (%)
Tobacco smoking
Smoking Yes 39 26
No 111 74
No of bidis per day
<4 16 10.7
4-8 14 9.3
>8 9 6
Age of starting (in years) ≤19 13 33.3
>19 26 66.7
Tobacco chewing
Chewing tobacco Yes 102 68
No 48 32
Age of starting of chewing tobacco (in years)
<19 29 19.3
>19 73 48.7
Tobacco Form
Pan masala 89 59.3
Sambhu (khaini) 6 4.0
Ghutkha 4 2.7
Others 3 2.0
Alcohol
Drinking alcohol by the respondents
Yes 54 36
No 96 64
Age of starting alcohol (in years)
≤19 10 6.7
>19 44 29.3
Alcohol form Country 47 31.3
Others 8 5.3
Exercise
Exercise in hrs <2.5 134 89.3
>2.5 16 10.7
Vegetable intake
Vegetable intake per week
<5 19 12.7
5-10 29 19.3
>10 102 68
Fruits intake
Fruit intake per week <5 133 88.7
5-10 17 11.3
Table 3: Clinical risk factors of non communicable diseases.
Characteristics Frequency (N) Percentage (%)
BMI
Underweight 14 9.3
Normal 98 63.3
Pre- obese 35 25.3
Obese class I 2 1.3
Obese class II 1 0.7
Waist- hip ratio Normal 82 54.7
High Risk 68 45.3
Blood pressure
Normal 50 33.3
Pre hypertension 55 36.7
Table 3 shows that the overweight was seen in 26%, abdominal obesity in 45.3% and 31% were suffering from hypertension. Table 4: 93.3% of the respondents were aware of the harmful effects of tobacco consumption. 72.7% said they received this awareness from electronic media.
Table 4 showed that 93.3% of the participants were aware about the harmful effect of tobacco on health and 65.3% would advice someone to quit tobacco. 72.7% would get source of information from electronic media about the harmful effect of tobacco.
Table 4: Awareness on harmful effect of tobacco consumption.
Characteristics Frequency (N) Percentage (%)
Harmful effect of tobacco Yes 140 93.3
On health No 10 6.7
Source of information on Electronic media 109 72.7
Harmful effect of tobacco
Health worker 6 4.0
Printed media 6 4.0
Relatives/friends 13 8.7
Would advice someone to quit tobacco
Yes 98 65.3
No 52 34.7
Table 5: Multiple logistic regression analysis showing factors associated with body mass index.
Characteristics Normal/underweight Obese Odds ratio (95% C.I.) P value
Sex
Male 32 18 0.642 (0.238-1.731) 3.81
Female 79 21 1
Occupation
Household 63 15 2.712 (0.678-10.843) 0.158 Unskilled labourer 28 9 2.579 (0.681-9.767) 0.163 Skilled labourer 10 4 2.178 (0.440-10.784) 0.340 Govt. employee 3 5 0.495( 0.081- 3.033) 0.447
Self employed 7 6 1
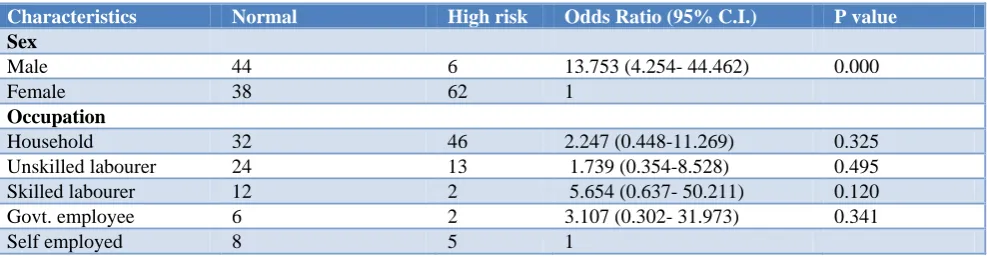
Table 6: Multiple logistic regression analysis showing factors associated with waist hip ratio.
Characteristics Normal High risk Odds Ratio (95% C.I.) P value
Sex
Male 44 6 13.753 (4.254- 44.462) 0.000
Female 38 62 1
Occupation
Household 32 46 2.247 (0.448-11.269) 0.325 Unskilled labourer 24 13 1.739 (0.354-8.528) 0.495 Skilled labourer 12 2 5.654 (0.637- 50.211) 0.120 Govt. employee 6 2 3.107 (0.302- 31.973) 0.341
Self employed 8 5 1
Table 5 showed that factors associated with body mass index in which body mass index is not significantly associated with sex and occupation in Multiple Logistic Regression analysis.
Table 6 showed that Multiple Logistic Regression analysis showing factors associated with waist hip ratio in which males had 13 times more chances of higher abdominal obesity [13.75(95% CI 4.254-44.462)] as compared to female.
Table 7: Multiple logistic regression analysis showing factors associated with alcohol consumption.
Characteristics Yes No Odds ratio (95% C.I.) P value
Sex
Male 35 15 6.307(2.241-17.749) 0.000
Female 20 80 1
Age group (in years)
20-30 11 45 0.267(0.084-0.842) 0.024
31-40 14 24 0.713(0.223-2.279) 0.568
41-50 15 9 1.840(0.505-6.706) 0.356
>50 15 17 1
Occupation
Household 14 63 0.371(0.076-1.821) 0.222
Unskilled labourer 22 15 0.815(0.179-3.708) 0.791 Skilled labourer 9 5 1.187(0.189-7.467) 0.855 Govt. employee 2 6 0.128(0.015-0.220) 0.043
Self employed 8 5 1
Table 8: Multiple logistic regression analysis showing factors associated with hypertension.
Characteristics Normal Hypertension Odds Ratio (95% C.I.) P value
Sex
Male 10 40 0.785 (0.277-2.223) 0.648
Female 40 60 1
Occupation
Household 36 42 2.454 (0.543-11.096) 0.244 Unskilled labourer 7 30 0.759 (0.163- 3.525) 0.725 Skilled labourer 3 11 0.914 (0.148-5.625) 0.923 Govt. employee 1 7 0.468 (0.040-5.497) 0.545
Self employed 3 10 1
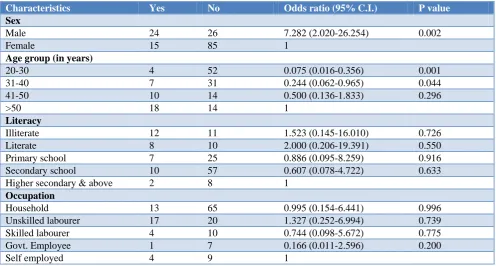
Table 9: Multiple logistic regression analysis showing factors associated with tobacco smoking.
Characteristics Yes No Odds ratio (95% C.I.) P value
Sex
Male 24 26 7.282 (2.020-26.254) 0.002
Female 15 85 1
Age group (in years)
20-30 4 52 0.075 (0.016-0.356) 0.001
31-40 7 31 0.244 (0.062-0.965) 0.044
41-50 10 14 0.500 (0.136-1.833) 0.296
>50 18 14 1
Literacy
Illiterate 12 11 1.523 (0.145-16.010) 0.726
Literate 8 10 2.000 (0.206-19.391) 0.550
Primary school 7 25 0.886 (0.095-8.259) 0.916 Secondary school 10 57 0.607 (0.078-4.722) 0.633 Higher secondary & above 2 8 1
Occupation
Household 13 65 0.995 (0.154-6.441) 0.996
Unskilled labourer 17 20 1.327 (0.252-6.994) 0.739 Skilled labourer 4 10 0.744 (0.098-5.672) 0.775 Govt. Employee 1 7 0.166 (0.011-2.596) 0.200
Table 8 showed that factors associated with hypertension in which hypertension is not significantly associated with sex and occupation in multiple logistic regression analysis.
Table 9 showed that Multiple Logistic Regression analysis in which Tobacco smoking is significantly associated with male having 7 times more chances of smoking [7.282(95% CI 2.020-26.254)] as compared to female, Age group of 20-30 yrs had 93% less chances [0.075(95% CI 0.016-0.356)] as compared to >50 years of age and 31-40 yrs had 76% less chances [0.244(95% CI 0.062-0.965)] as compared to >50 years of age.
DISCUSSION
The study was conducted by Kandpal on a tribal population in which 36% were males and 64% females.7 In our present study, all the individuals are equal to or above 20 years of age, of which 33.3% are males and rest 66.7% are females. Bhagyalaxmi conducted on the prevalence of risk factors of NCD in a district of Gujarat, it was found that 10% of the study subjects were skilled labour.8 In our study, it was found that 14% were skilled labour. Kandpal on Rang Bhotias which showed that 37.5% consumed alcohol, among this 78.8% of males and 14.1% of females were found to consume alcohol.7 Our present study, showed that 36% of the study subjects consumed alcohol. Among which 70% of males and 20% of females were found to consume alcohol. Bhagyalaxmi conducted on prevalence of risk factors of NCDs in a district of Gujarat, it was observed that 23.8% were smokers.8 In our study, it was found that among the study subjects 26% were smokers. In a study conducted by Prabhakaran on the employees of a large industry area near Delhi, they found that 70% were hypertensive.9 Similar study, by Gupta on the urban population of Delhi reported that 73.9% were hypertensive.10 In our study, it was observed that 66.7% of the study subjects were hypertensive. Misra conducted on Mishing tribe, showed 26% had BMI >25 Kg/m2.11 Another study, was conducted by Chadha in Delhi, showed 27.8% were having BMI >25 Kg/m2.12 In our study, it was observed that 25.3% had BMI>25 Kg/m2. Kanniyappan conducted in south India showed 47.8% had waist-hip ratio above normal.13 In our study, the proportion of men and women having waist-hip ratio >1.0 and >0.85 respectively was significantly higher of about 45.3%. Our study showed high prevalence of hypertension among the study subjects. Similarly, Prabhakaran and Gupta in their studies that hypertension was the most prevalent risk factor for development of CVDs.9,10 The overall prevalence of hypertension was higher in individuals who consumed alcohol. In our study, the prevalence of CVD risk factors was found higher among those who consumed alcohol. Kandpal in which it was also reported that there was higher risk of developing CVD with alcohol consumption.7 Bhagyalaxmi in her study reported that smoking tobacco was also a risk factor for development of NCDs, which in our study was also found
to be a significant risk factor for developing NCDs.8 A study by Mishra and Kanniyappan also reported BMI and waist-hip ratio as equally significant risk factor for development of CVDs.11,13
CONCLUSION
The tobacco and alcohol use, two of the major NCD risk factors were high in this population. A strong negative behaviour was the low level of physical activity among this population which could be the reason for low level of overweight and abdominal obesity, hypertension. Unhealthy diet was more prevalent among the illiterates which could be resolved by better education. Awareness on harmful effect of tobacco of health was higher and treatment and control of hypertension was lower probably due to inadequate access to health care.
Recommendations
Increase in number of NCD clinic. Enforcement of laws against use of tobacco and alcohol should be made more stringent. More information, education and communication activity regarding promotion of physical activity and balanced diet.
Funding: No funding sources Conflict of interest: None declared
Ethical approval: The study was approved by the Institutional Ethics Committee
REFERENCES
1. WHO (2011), Global Status Report on Non-communicable diseases-2010. Available at: http://www.who.int/nmh/publications/ncd_report_fu ll_en.pdf. Accessed on 10 June 2017.
2. Ezzati M, Lopez AD, Rodgers A, Vander Hoorn S, Murray CJL, The Comparative Risk assessment collaborating group. Selected major risk factors and global and regional burden of disease. Lancet. 2002;360:1347-60.
3. Gaziano TA. Cardiovascular disease in the developing world and it’s cost effective management. Circulation. 2005;112:3547-53. 4. Das M, Pal S, Ghosh A. Prevelance of
Cardiovascular disease risk factors by habitat: A study on Adult Asian Indians in West Bengal, India. Antropol Anz. 2011;68:253-64.
5. NFHS IV- 2015-16 Tripura fact sheet. Available at: http://rchiips.org/NFHS/pdf/NFHS4/TR_FactSheet. pdf. Accessed on 15 June 2017.
6. Oommen AM, Joseph V, George AKV, Jose J. Prevalence of risk factors for non communicable diseases in rural and urban Tamilnadu. Indian J Med Res. 2016;144:460-71.
8. Bhagyalaxmi A, Atul T, Shikha J. Prevalence of Risk Factors of Non-communicable Diseases in a District of Gujarat, India. J Health Popul Nutr. 2013;31(1):78–85.
9. Prabhakaran D, Shah P, Chaturvedi V, Ramkrishnan L, Monhappa A, Reddy KS. Cardiovascular risk factors prevalence among men in a large industry of northern India. National Med J India. 2005;18(2):59-65.
10. Gupta R, Gupta VP, Sarna M, Bhatnagar S, Thanvi J, Sharma V, et al. Prevalence of Cardiovascular Diseases and risk factors in an urban Indian population: Jaipur Heart Watch-2. Indian Heart J. 2002;54(1):59-66.
11. Misra PJ, Mini GK, Thankappan KR. Risk factor profile for non-communicable diseases among
Mishing tribes in Assam,India: Results from a WHO STEP survey. Indian J Med Res. 2014;140:370-8. 12. Chadha SL, Radhakrishnan S, Ramachandran K,
Kaul U, Gopinath N. Epidemiological study of Cardiovascular Heart Diseases in urban population of Delhi. Indian J Med Res. 1990;92:424-30. 13. Kanniyappan D, Kalidhas P, Aruna RM. Age,
gender related prevalence of cardiovascular risk factors in overweight and obese south Indian adults. Int J Biol Med Res. 201;2(2):513-22.