RESEARCH ARTICLE
TIME SERIES ANALYSIS OF VEGETABLE PRODUCTION AND FORECASTING USING ARIMA MODEL
*
Arivarasi, R. and Madhavi Ganesan
Centre for Water Resources, Anna University, Chennai, Tamil Nadu, 600 025, India
ARTICLE INFO
ABSTRACT
In the present study, time series analysis was used to assess the trend of vegetable production in terms of acreage and production in the feeder zones of Chennai city. The trend of two zones [(zone 1 -Kancheepuram district) & (zone 2 -Thiruvallur district)], was evaluated by the statistical (Paired t) test. Auto Regressive Integrated Moving Average (ARIMA) Model was used to forecast the area and production of vegetables in the selected zones. From the analysis, the ARIMA (0, 1, 2) model is suitable for the cultivation area of the zone 2 and for zone 1 ARIMA (2, 0, 1) model is suitable. ARIMA (2, 0, 1) model is highly suitable for the vegetable production of both the zones. The model performances are validated by comparing the regression co-efficient values. While the model was used for forecasting for the period 2011-12 to 2014-15, decreasing trend was found in cultivated area and production of vegetables in zone 1 however in zone 2, increasing trend was found in cultivated areas whereas decreasing trend was found for the vegetable production. Hence, it can be concluded that if this situation is remaining the same for a long time then the further cultivation of vegetable crops will no longer be possible in both the zones.
Copyright © Arivarasi and Madhavi Ganesan.This is an open access article distributed under the Creative Commons Attribution License, which permits unrestricted use, distribution, and reproduction in any medium, provided the original work is properly cited.
INTRODUCTION
Indian agriculture is increasingly getting influenced more by economic factors and is characterized by small farm holdings
(Hazra, 2001). Vegetables are the best resources for
overcoming micronutrient deficiencies and provide
smallholder farmers with much higher income and more jobs per hectare than staple crops (AVRDC, 2006). India’s total vegetable acreage and production for the fasli (Agricultural)
year 2010-2011 are 8494.6*103ha and 146554.5*103t
respectively, of which the Tamil Nadu state fraction is
277.3*103ha and 8279.9*103t which is nearly 3% of
cultivation area and 5% of vegetable production of the country. In the state, the vegetable cultivation area ranges from
100-300*103 ha and the production ranges from 5000 to
10000*103t coming third in acreage and second in production.
Chennai city is the capital of Tamil Nadu state where the government and NGO’s play a vital role, in addition to the above, the private sectors are also booming (i.e. Automobiles, information technology, medical and tourism etc.,). In addition to that a sustained economic growth, rising per capita income and growing urbanization are apparently causing a shift in the consumption patterns in favor of high-value commodities like fruits, vegetables, meat and fish products from staple food such as rice, wheat and cereals. Industrialization stimulates the high population density in the urban areas and makes the demand for food items.
*Corresponding author: Arivarasi, R.
Centre for Water Resources, Anna University, Chennai, Tamil Nadu, 600 025, India.
The population of the city for the year 1901 was 5.41lakhs and for the year 2011was 46.81lakhs. It has been projected about 50.57lakhs for the year 2021. The Decadal Growth rate of the city population between the years 2001 to 2011 was 7.76%. The consumption of fruit, vegetables and meat has increased considerably. The demand for these items during certain period of the year is so high. The vegetables are transported from different neighboring districts to meet the needs of the local residents of the city. For this study, the two zones (Kancheepuram and Thiruvallur districts) were selected which are very close to the Chennai city and the trend of vegetable production was analyzed and forecasted. Time series analysis was used to find the trend of vegetable production. Number of attempts were made to the model and to forecast the various agricultural crops using ARIMA (p d q) models. The model
was used to forecast the sugarcane yield in Pakistan (Yaseen et
al., 2005). Two years back, the cultivation area, production
and productivity of sugarcane have been forecasted using ARIMA model in the Tamil Nadu state (Suresh and Krishnapriya, 2011).
MATERIALS AND METHODS
The main objective of this paper was to analyze the trend of vegetable production in the feeder zones of the city. The data used in the present study have been acquired from the state agriculture department for the year 2000-2011. Linear and compound regression equation was derived to analyze the secondary data.
ISSN: 0976-3376
Vol.06, Issue, 10, pp. 1844-1848, October,Asian Journal of Science and Technology 2015SCIENCE AND TECHNOLOGY
Article History:
Received 28th July, 2015
Received in revised form 26th August, 2015
Accepted 16th September, 2015
Published online 17th October, 2015
Key words:
Time determine the method, Auto Regressive Integrated Moving Average (ARIMA) Model was used to forecast the area and production and it can be denoted by ARIMA (p, d, q). Here p indicates the order of the autoregressive part, d indicates the amount of differencing and q indicates the order of the moving average part. Based on trial and error method, the values of (p d q) were changed such as (1 0 1), (0 1 1), (1 1 0), (1 0 2), (0 1 2), (1 2 0), (2 0 1), (0 2 1) & (1 1 0) respectively and the regression coefficient values were compared. High regression coefficient value indicates that the model prediction is good.
In this study, several software was applied as follows;
Microsoft Excel - To create an attribute database
SPSS 21 - To analyze and to forecast
Arc GIS 9.3 - To digitize the study zone
RESULTS AND DISCUSSION
Table 1 shows the production and productivity of each zone. Table 2 shows the results obtained from the descriptive statistical analysis of the data.
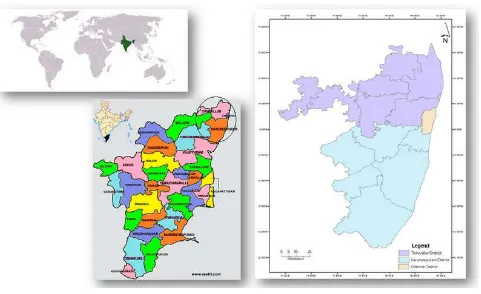
For the inferential analysis, Paired t test was carried out to check whether the difference in area and production in the two districts is significant or not. The correlation coefficient value of the cultivated area in both the district is 0.469 and for the vegetable yield is 0.626. It denotes that there is a positive correlation between two zones. From the inferential analysis, the association among the two zones in terms of cultivation area and production of vegetables is not significant. Figure 1 illustrates the location of the selected zones. Figure 2 and 3 are the time series plot of vegetable cultivation area and production in both the districts.
In the Zone 1, the area of vegetable cultivation is more than a thousand hectares during the year 2003 to 2005 and then it is in decreasing trend from the year 2006-2007. Similarly in Zone 2 the vegetable cultivation area is decreased from the year 2006-2007 and drastically it increased during the year 2010-2011. In both the zones, the area of cultivation is
slightly increased from the year 2009-2010.In the Zone 1, the
maximum area goes up to more than 1600ha and the production goes up to more than 20,000t and in Zone 2 the maximum area goes nearly 1000ha and the production goes
below 16,000t range.
Figure 1. Location map of study zones (Kancheepuram and Thiruvallur districts)
Table 1. Cultivation Area and Production of Vegetable Crops in Zone 1 and 2
Year
Zone 1 (Kancheepuram) Zone 2 (Thiruvallur)
Area (ha) Production (t) Area (ha) Production (t)
2001-02 837 12221 871 11403
2002-03 871 11409 720 11588
2003-04 1750 21724 847 11762
2004-05 1322 20813 719 13552
2005-06 1507 17812 821 11806
2006-07 397 5093 484 7884
2007-08 359 4074 490 5237
2008-09 276 3132 448 4780
2009-10 245 2948 655 8975
Figure 2. Time series plot of cultivated area and production in Zone 1 (Kancheepuram District)
Figure 3. Time series plot of cultivated area and production in Zone 2 (Thiruvallur District)
Table 2. Descriptive Statistical analysis results
Minutiae Kancheepura
m (Zone 1)
Thiruvallur (Zone 2)
Min Area (ha) 245 448
Max Area (ha) 1750 1030
Min Production (t) 2948 4780
Max Production (t) 21724 15196
Mean (µ) Area 797 708.5
Mean (µ) Production 10591.5 10218.3
Std Deviation (σ) Area 555.4 191.7
Std Deviation (σ) Production 7347.5 3423.1
From the graphs, it is apparently shown that in Zone 2, there is no sudden change in the cultivated area.
Also it shows that, the sustainability of vegetables in terms of area and production is poor in Zone 1 when compared to Zone 2. Figure 4 and 5 illustrate the graphical representation of the comparison of Zone 1 & 2 in terms of area and yield of
vegetable cultivation. The linear equation derived from the
trend line shows that the area and production are in decreasing trend in both the zones. Simple linear and compound regression equation has been generated for both the zones and forecasted using ARIMA model with 95% confidence limits in an SPSS 21 environment. The simple linear equation is
Figure 4. Time series plot of vegetable cultivation area between zone 1 and 2
Model for Vegetable Cultivation in Zone 1
Figure 5. Time series plot of vegetable production between zone 1 and 2
Y=a+bt
Y=1451. 33-118.97X --- 1
Compound equation is
Y=a * (b) t
Y=1706. 734* (0.834) t--- 2
Equation 1 and 2 shows the linear and compound regression equation for the cultivation area of zone 1 (Kancheepuram district). From the linear equation, It shows that every year the
area decreased (-118.97) times. The R2 value of the linear
equation is 0.421 and for compound regression is 0.559.
Table 3. Iterative Method -R2 Value
ARIMA Model ( p d q ) Zone 1 Zone 2
Area Production Area Production
1 0 1 0.421 0.568 0.085 0.644
0 1 1 0.337 0.406 0.142 0.676
1 1 0 0.300 0.406 0.148 0.585
1 0 2 0.526 0.615 0.190 0.580
0 1 2 0.309 0.465 0.418 0.715
1 2 0 0.109 0.135 0.194 0.682
2 0 1 0.597 0.747 0.404 0.839
0 2 1 -0.016 0.268 0.067 0.688
Figure 6. Observed Vegetable Cultivation Area in Zone 1
Figure 7 . Forecasted Vegetable Cultivation Area in Zone 1 – ARIMA (2 0 1)
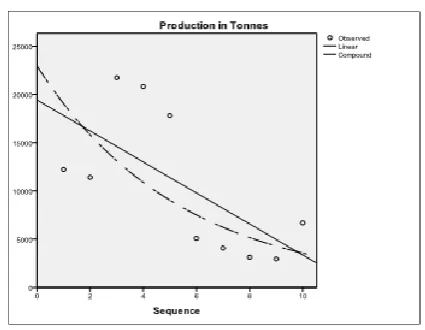
Figure 8. Observed Vegetable Production in Zone 1
Model for Vegetable Cultivation in Zone 2
Figure 9. Forecasted Vegetable Production in Zone 1 - ARIMA (2 0 1)
Figure 10. Observed Vegetable Cultivation Area in Zone 2
Figure 11. Forecasted Vegetable Area in Zone 2
Table 4. Forecasted Results
Year 2011-12 2012-13 2013-14 2014-15
Zone 1 2 1 2 1 2 1 2
Forecasted Area (ha) 404 1326 205 1699 0 2016 0 2374
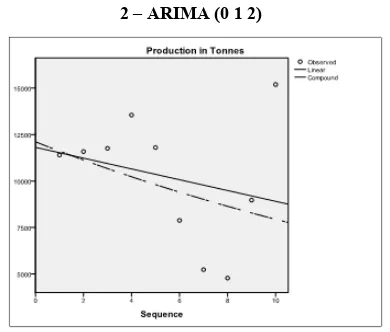
2 – ARIMA (0 1 2)
Figure 12. Observed Vegetable Production in Zone 2
Figure 13. Forecasted Vegetable Production in Zone 2 - ARIMA (2 0 1)
Figure 6, 8, 10 and 12 shows the observed values of area and production for both the zones and their linear and compound regression lines. Figure 7, 9, 11 and 13 illustrates the forecasted values of area and production for both the zones. The area will be increased and the production will be decreased considerably for zone 2. Table 3 shows the model
R2 values obtained from the iterative process. Table 4 shows
the results obtained from the ARIMA model. It indicates that the predicted values of cultivation area and production for zone 1 and 2.
Conclusion
Trend of vegetable production was analyzed using time series analysis. The parsimonious models for given data are ARIMA (2 0 1) (Autoregressive Integrated Moving Average model of auto regressive order 2, differencing 0 and moving order 1) and ARIMA (0 1 2).
The model result shows that in zone 1 (Kancheepuram district), the cultivated area and production both are in decreasing trend and in zone 2 (Thiruvallur district), the area is in increasing trend and the production is in decreasing trend. If the same trend is continuing, surely it will conduce to the failure in vegetable production in both the zones. Hence, it is recommended that the vegetable cultivation practices and cropping pattern should be analyzed to increase the productivity of vegetable crops in the selected zones.
Acknowledgements
The authors would like to acknowledge the Horticulture Department, Kancheepuram, Thiruvallur and Chennai for their support rendered in conducting this study and making possible to bring out this article.
REFERENCES
Annual Reports 2001-2011. Cultivation Area, Production and Productivity of Horticulture crops’, Directorate of Horticulture and Plantation Crops, Agriculture Department, Government of Tamil Nadu, India
AVRDC (Asian Vegetable Research and Development Center), 2006. Vegetables Matter. The World Vegetable Center. Shanhua, Taiwan
District census handbook 2011. Directorate of census operation, Tamil Nadu, India
Garg S .K. 1998. A Textbook of Water Supply Engineering, Khanna publishers, New Delhi, 24-51
Hazra, C.R 2001. Crop Diversification in India, Expert Consultation on Crop Diversification in the Asia-Pacific Region, Food and Agriculture Organization of the United Nations Regional office for Asia and the Pacific, Bangkok, Thailand, RAP Publications, 32-50
Indian Horticulture Database 2011. National Horticulture Board, Ministry of Agriculture, Government of India.
Suresh K.K. and Krishna Priya S.R. 2011. ‘Forecasting
Sugarcane Yield of Tamilnadu Using ARIMA Models’,
An International Journal of Sugar Tech., 13 (1): 23-26,
Yaseen, M., M. Zakria, Islam-ud-din-Shahzad, M. Imran Khan, and M. Aslam Javed. 2005. Modeling and
forecasting the sugarcane yield of Pakistan. International
Journal of Agricultural Biology 7 (2): 180–183.