Original Research Article
Correlates and determinants of nutritional status of adolescent girls: a
comparative study among government and private schools
Prashant R. Kokiwar
1*, P. Yadu Vamshi Reddy
2, P. Nikitha
2, P. Rajitha
2, P. Nissi Angeline
2,
V. Preethi
2, P. Navya
2, R. Sai Chitra
2, R. Hima Sameera
2INTRODUCTION
10-19 years is taken as age group of adolescents as suggested by World Health Organization (WHO). One fifth of the global population is constituted by them. Physical growth is very rapid for adolescents.1 During adolescence height increases by 20% and weight gain is 50% of the adult height and weight respectively. Apart from this almost 45% increase is seen in bone mass.2
It has been found that people neglect the adolescents. Especially adolescent girls are largely neglected. For above mentioned growth to occur, proper nutrition is of utmost importance. But this is also ignored resulting in varying degrees of malnutrition. The diet of adolescents must high in energy at the same time it must be balanced in terms of proteins, fats and carbohydrates. As nutrition need is the highest during this period, they are supposed to take proper nutrition. They are most important as they also are the future of the country.3
ABSTRACT
Background: Under nourished adolescent girls are more likely to give birth to malnourished child when they become pregnant and deliver. Hence their nutritional status is of much more importance. Objectives were to study the nutritional status of adolescent girls, to study the correlates and determinants of nutritional status and compare it between government and private schools.
Methods: A school based cross sectional study was carried out for a period of three months. This study was comparative in nature, comparing the adolescent girls from government and private schools. It was possible to study 74 and 97 adolescent girls from government and private schools respectively. Anthropometric measurements were recorded using standard guidelines.
Results: There were only 4 cases (5.4%) of underweight and only 3 cases (4.1%) in government school. Similarly there was only one case (1.03%) of underweight and only 7 (7.2%) of the cases in the private school. The mean height was significantly less among the children from government school compared to the private school. But there was no difference between the mean weight and BMI of children from two schools.
Conclusions: Prevalence of overweight and obesity was low in the present study. It was not found to be associated with education and occupation of parents and type of family.
Keywords: Nutritional status, Adolescents, Body mass index
1
Professor and HOD, Department of Community Medicine, Malla Reddy Institute of Medical Sciences, Suraram, Hyderabad, Telangana, India
2
MBBS, Malla Reddy Institute of Medical Sciences, Suraram, Hyderabad, Telangana, India
Received: 28 January 2018
Revised: 09 March 2018
Accepted: 10 March 2018
*Correspondence:
Dr. Prashant R. Kokiwar, E-mail: [email protected]
Copyright: © the author(s), publisher and licensee Medip Academy. This is an open-access article distributed under the terms of the Creative Commons Attribution Non-Commercial License, which permits unrestricted non-commercial use, distribution, and reproduction in any medium, provided the original work is properly cited.
In developing world, among adolescents girls form a very high risk group. This is because there is a tendency in the developing countries to neglect them and get them married at an early age. This exposes them to the risk of malnutrition as well as they are at high risk of morbidity and mortality of reproductive in nature. Diet determines the growth of the adolescent girls. They are also future mothers whose nutritional status will also decide the nutritional status of future generation. This point makes the adolescent girls more unique compared to their counterparts i.e. adolescent boys.4
Adolescents undergo not only physical and physiological changes but also they undergo various psychological changes. They start observing the surrounding world with more cautious mind, they start forming their attitudes, habits and personalities at this stage. Once formed, more or less it tends to remain permanent. This is true for even all types of changes that occur among them during this transitional phase of life. Usually body mass index which is age and sex specific is preferred method to understand the nutritional status of the adolescents.5
Adolescents are at high risk of malnutrition including under nutrition and over nutrition in some cases. They are susceptible to various influences in the environment. Adolescent pregnancy poses extra burden. This is compounded with heavy physical work usually seen in developing countries. Gender discrimination makes adolescent girls high risk group. Iron deficiency anemia and under nutrition are common health problems.6
Process of acquiring adult identity gets started at adolescent age group. “According to census 2001, there are 225 million adolescents in the age group of 10 to 19 years”.7
“Adolescent girls, constitutes nearly one tenth of Indian population”. This statement is very important as they are source of future generations. Future generation health and vitality depends upon physical, physiological and psychological maturity and firmness of these girls.8
Under nourished adolescent girls are more likely to give birth to malnourished child when they become pregnant and deliver. Hence their nutritional status is of much more importance.9
Hence present study was carried out to study the nutritional status of adolescent girls, to study the correlates and determinants of nutritional status and compare it between government and private schools.
METHODS
A school based cross sectional study was carried out for a period of three months from July 2017 to September
Community Medicine, Malla Reddy Institute of Medical Sciences, Suraram, Hyderabad.
Inclusion criteria
Inclusion criteria were adolescent girls only studying in classes from 8th to 10th; schools giving permission to carry out the study; adolescent girls willing to participate in the study; adolescent girls present on the day of survey.
Exclusion criteria
Exclusion criteria were adolescent girls not willing to participate in the present study; adolescent girls found to have communication problems or any illness at the time of the present study.
It was possible to study 74 and 97 adolescent girls from government and private schools respectively. We selected girls from 8th to 10th class only.
Institutional Ethics Committee permission was taken before starting the present study. Permission from Principals of selected government and private schools was taken so that present study can be smoothly conducted. Respective class teacher permission was also obtained and was treated as informed consent by all adolescent girls participating in the present study of that particular class.
10-19 years is taken as age group of adolescents as suggested by World Health Organization (WHO).10
Anthropometric measurements like height and weight were measured as the standard guidelines lay down by WHO.11
Based on height and weight, body mass index was calculated using the formula.12
Revised Indian Academy of Pediatrics (IAP) growth charts for height, weight and body mass index for 5 to 18 years old Indian children were used to compare the age wise BMI of girls for the present study.13
Age of the adolescent girl was confirmed by school records. Primary details were recorded as given by class teacher for the present study for that respective class.
Statistical analysis
The data was analyzed using proportions and chi square test. For mean values, student’s t test was used. P value of less than 0.05 was taken as statistically significant.
RESULTS
There were a total of 7 students who were malnourished in government school and 8 students in private school. Among them in the private school, the number of overweight was more than those in the government school (Table 1).
The mean height was significantly less among the children from government school compared to the private school. But there was no difference between the mean weight and BMI of children from two schools (Table 2.
The mean height, weight and BMI of children having father occupied as professionals was not significantly
different from those children having father occupied as unskilled or labourer (Table 3).
The mean height, weight and BMI of children having mother occupied as professionals was not significantly different from those children having mother occupied as unskilled or labourer (Table 4).
The mean height, weight and BMI of children having literate father was not significantly different from those children having illiterate father (Table 5).
The mean height, weight and BMI of children having literate mother was not significantly different from those children having illiterate mother (Table 6).
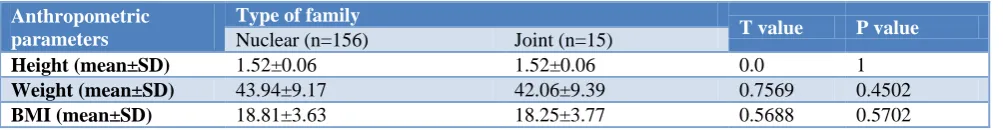
The mean height, weight and BMI of children belonging to nuclear family was not significantly different from those children belonging to joint family (Table 7).
Table 1: Prevalence of malnutrition (underweight + overweight) among adolescent girls.
Malnutrition (underweight + overweight)
Government school Private school Total
Number Percentage (%) Number Percentage (%) Number Percentage (%)
Yes 7 (4+3) 9.5 8 (1+7) 8.2 15 8.7
No 67 90.5 89 91.8 156 91.3
Total 74 43.3 97 56.7 171 100
Table 2: Comparison of anthropometric parameters between government and private schools.
Anthropometric parameters Government school Private school T value P value
Height (mean±SD) 1.51±0.07 1.53±0.05 2.1789 0.0307
Weight (mean±SD) 42.3±9.4 44.87±9.2 1.7441 0.0830
BMI (mean±SD) 18.45±3.6 18.9±3.6 0.8099 0.4192
Table 3: Comparison of anthropometric parameters in father occupation.
Anthropometric parameters
Father occupation
T value P value Professional, skilled, clerical,
business (n=109)
Unskilled, laborer (n=62)
Height (mean±SD) 1.52±0.06 1.52±0.06 0.0 1
Weight (mean±SD) 43.3±9.19 43.85±9.2 0.0821 0.9347
BMI (mean±SD) 18.68±3.63 18.89±3.65 0.1436 0.8860
Table 4: Comparison of anthropometric parameters in mother occupation.
Anthropometric parameters
Mother occupation
T value P value Professional, skilled, clerical,
business (n=45)
Unskilled, laborer (n=126)
Height (mean±SD) 1.52±0.06 1.52±0.06 0.0 1
Weight (mean±SD) 43.31±9.2 43.94±9.2 0.3943 0.6938
Table 5: Comparison of anthropometric parameters in father education.
Anthropometric parameters
Father education
T value P value
Illiterate (n=59) Literate (n=112)
Height (mean±SD) 1.52±0.06 1.52±0.06 0.0 1
Weight (mean±SD) 43.31±9.2 43.94±9.2 0.3943 0.6938
BMI (mean±SD) 18.66±3.66 18.79±3.65 0.2049 0.8379
Table 6: Comparison of anthropometric parameters in mother education.
Anthropometric parameters
Mother education
T value P value
Illiterate (n=88) Literate (n=89)
Height (mean±SD) 1.52±0.06 1.52±0.06 0.0 1
Weight (mean±SD) 43.5±9.3 44.07±9.2 0.4099 0.6824
BMI (mean±SD) 18.65±3.67 18.87±3.67 0.3988 0.6906
Table 7: Comparison of anthropometric parameters in type of family.
Anthropometric parameters
Type of family
T value P value
Nuclear (n=156) Joint (n=15)
Height (mean±SD) 1.52±0.06 1.52±0.06 0.0 1
Weight (mean±SD) 43.94±9.17 42.06±9.39 0.7569 0.4502
BMI (mean±SD) 18.81±3.63 18.25±3.77 0.5688 0.5702
DISCUSSION
There were a total of 7 students who were malnourished in government school and 8 students in private school. Among them in the private school, the number of overweight was more than those in the government school.
The mean height was significantly less among the children from government school compared to the private school. But there was no difference between the mean weight and BMI of children from two schools.
The mean height, weight and BMI of children having father occupied as professionals was not significantly different from those children having father occupied as unskilled or labourer. The mean height, weight and BMI of children having mother occupied as professionals was not significantly different from those children having mother occupied as unskilled or labourer.
The mean height, weight and BMI of children having literate father was not significantly different from those children having illiterate father. The mean height, weight and BMI of children having literate mother was not significantly different from those children having illiterate mother.
The mean height, weight and BMI of children belonging to nuclear family were not significantly different from those children belonging to joint family.
government school students.14 We found that only height was significantly more in private school students compared to the government school students. BMI was not significantly different.
Kapil et al observed that obesity was more among 10-12 years of age compared to other age groups. The author attributed this finding to adipose tissue increase and weight gain due to puberty.15
Chhatwal et al found that overweight and obesity was more among adolescents belonging to upper class as opposed to adolescents from lower class.17 Obesity prevalence was 11.1% and overweight prevalence was 14.2%. But in the present study we observed a very low prevalence of 8.7% combined for overweight and obesity. The author found that prevalence of overweight and obesity was more among boys than girls.
Kotian et al noted that obesity prevalence was 4.8% and overweight prevalence was 9.3%.18 In the present study we observed a comparable prevalence of 8.7% combined for overweight and obesity.
CONCLUSION
Funding: No funding sources Conflict of interest: None declared
Ethical approval: The study was approved by the Institutional Ethics Committee
REFERENCES
1. Rees JM. Nutritional influences on physical growth and behavior in adolescence. In: Adams G, editor. Biology of Adolescent Behavior and Development. California: Sage Publications; 1989: 139–162. 2. DiMeglio G. Nutrition in adolescence. Pediatr Rev.
2000;21(1):32-3
3. The 1996 version New Work. United Nations; 1997. The sex and age distribution of world population. 4. Thame M, Wilks RJ, McFarlane-Anderson N,
Bennett FI, Forrester TE. Relationship between maternal nutritional status and infant's weight and body proportions at birth. Eur J Clin Nutr. 1997;51(3):134-8.
5. Das S, Kaushik B. Body mass index and chronic energy deficiency among adult sandals of Purulia District, West Bengal, India. Int J Hum Sci. 2010;7:2.
6. Das DK, Biswas R. Nutritional status of adolescent girls in a rural area of North 24 Parganas District, West Bengal. Indian J Public Health. 2005;49:18-21.
7. Patil SN, Wasnik V, Wadke R. Health problems amongst adolescent girls in rural areas of Ratnagiri district of Maharashtra, India. J Clinical Diagnos Res. 2009;3:1784-90.
8. Choudhary S, Mishra CP, Shukla KP. Nutritional status of adolescent girls in rural area of Varanasi. Indian J Prev Soc Med. 2003;34(1):53-61.
9. Shivaramakrishna HR, Deepa AV, Sarithareddy M. Nutritional status of Adolescent Girls in Rural Area of Kolar District- A Cross-Sectional Study. Al Ameen J Med Sci. 2011;4(3):243-6.
10. World Health Organization. Health and
Development. Available at: http://www.searo.who.
int/EN/Section13/Section1245.htm. Accessed on 10 October 2017.
11. World Health Organization. Physical Status: The use and interpretation of anthropometry. WHO Tech Rep Series. 1995;85:4:424-38.
12. Park K. Park’s Text Book of Preventive and Social Medicine, 24th ed. Jabalpur: M/s Banarasidas Bhanot Publishers; 2016.
13. IAP Growth Charts Committee, Khadilkar V, Yadav S, Agrawal KK, Tamboli S, Banerjee M, Cherian A et al. Revised IAP growth charts for height, weight and body mass index for 5- to 18-year-old Indian children. Indian Pediatr. 2015;52(1):47-55.
14. Marwaha RK, Tandon N, Singh Y, Aggrawal R, Grewal K, Mani K. A Study of Growth Parameters and Prevalence of Overweight and Obesity in School Children from Delhi. Indian Paediatr. 2006;43(11):943-52.
15. Kapil U, Singh P, Pathak P, Dwivedi SN, Bhasin S. Prevalence of Obesity amongst Affluent School Children in Delhi. Indian Pediatr. 2002;39(5):449-52.
16. Popkin BM, Gordon-Larsen P. The nutrition transition: worldwide obesity dynamics and their determinants. Int J Obes Relat Metab Disord. 2004;28 Suppl 3:S2-9.
17. Chhatwal J, Verma M, Riar SK. Obesity among pre-adolescent and pre-adolescents of a developing country (India). Asia Pac J Clin Nutr. 2004;13(3):231-5.
18. Kotian MS, Ganesh Kumar S, Kotian SS.
Prevalence and Determinants of Overweight and Obesity among Adolescent School Children of South Karnataka, India. Indian J Community Med. 2010;35(1):176-8.