IJSRSET173647 | Received : 13 Sep 2017 | Accepted : 26 Sep 2017 | September-October-2017 [(3)6: 347-352]
© 2017 IJSRSET | Volume 3 | Issue 6 | Print ISSN: 2395-1990 | Online ISSN : 2394-4099 Themed Section: Engineering and Technology
347
A Novel method for Rainfall Prediction using Machine
Learning
Priti Pandey, Pankaj Richhariya
Bhopal Institute of Technology and Science, Bhopal, Madhya Pradesh, India
ABSTRACT
Surges are viewed as catastrophic events that can cause setbacks and destroying of infra structures. Uncertainty of rainfall also creates problem, a reduced amount of rainfall and high amount of rainfall both are not desirable henceforth for both the cases water resource management is necessary. Prediction of rainfall can play impotent role for WRM (Water resource management). After studying different literature, work can be carried out using data mining techniques and machine learning model. In this we have proposed a rainfall prediction model which is an integration of clustering data mining technique and multiple regression, which will make efficient and accurate prediction. Proposed algorithm used k- nearest neighbor regression, and we have also implemented k-medoid regression. Further we have passed predicted data to classifier which will generate confusion matrix with two values TPR (True Positive Rate) and FNR (False negative Rate).
Keywords: WRM, TPR, FNR
I.
INTRODUCTION
Forecasting is a procedure of estimating or predicting the future depends on past and nearby data. Forecasting provides information about the impending future measures and their consequences for the administration. It may not decrease the difficulties and hesitation of the future. Nevertheless, it increases the self-reliance of the management to craft imperative decisions. Forecasting is the foundation of premising. Forecasting uses various statistical data. Consequently, it is also called as Statistical Analysis. Significance of forecasting involves following points:
Forecasting provides reliable and relevant information about the present and past events and the probable future measures. This is very essential for sound planning.
It gives self-belief to the managers for making imperative decisions.
It is the source for making planning grounds. It keeps managers alert and active to face the
challenges of future measures and the changes in the atmosphere.
Boundaries of forecasting involves following points:-
The analysis and collection of data about the present, history and future involves lots of time and capital. Consequently, managers have to equilibrium the cost of forecasting with its reimbursement. Most of the small firms don't do forecasting on account of the high cost.
Forecasting task can only approximate the future measures. It cannot pledge that these measures will take place in the future. Long-term prediction will be fewer accurate in comparison with to short-range forecast.
Data Prediction is based on convinced assumptions. If these assumptions are mistaken, the forecasting will be incorrect. Forecasting is depend on past measures. On the other hand, past may not reiterate itself at all times.
Forecast is merely a prediction about the future values of data. However, most extrapolative model forecasts assume that the past is a proxy for the future. There are many traditional models for forecasting: exponential smoothing, regression, time series, and composite model forecasts, often involving expert forecasts. Regression analysis is a statistical technique to analyze quantitative data to estimate model parameters and make forecasts.
Regression analysis is a statistical process for estimating the relationships among variables. It includes many techniques for modeling and analyzing several variables, when the focus is on the relationship between a dependent variable and one or more independent variables (or 'predictors'). The horizontal line is called the X-axis and the vertical line the Y-axis. Regression analysis looks for a relationship between the X variable (sometimes called the “independent” or “explanatory” variable) and the Y variable (the “dependent” variable).
Fig.-1 Linear Regression
In simple regression analysis, one seeks to measure the statistical association between two variables, X and Y. Regression analysis is generally used to measure how changes in the independent variable, X, influence changes in the dependent variable, Y. Regression analysis shows a statistical association or correlation among variables, rather than a causal relationship among variables. The case of simple, linear, least squares regression may be written in the form:
Where Y, the dependent variable, is a linear function of X, the independent variable. The parameters α and β characterize the population regression line and e is the randomly distributed error term. The regression estimates of α and β will be derived from the principle of least squares.
II.
Literature Survey
Andrew Kusiak et. al. said that Rainfall affects local water quantity and quality. A data-mining approach is applied to predict rainfall in a watershed basin at Oxford, Iowa, based on radar reflectivity and tipping-bucket (TB) data. Five data-mining algorithms, neural network, random forest, classification and regression tree, support vector machine, and k-nearest neighbor, are employed to build prediction models. The algorithm offering the highest accuracy is selected for further study. Model I is the baseline model constructed from radar data covering Oxford. Model II predicts rainfall from radar and TB data collected at Oxford. Model III is constructed from the radar and TB data collected at South Amana (16 km west of Oxford) and Iowa City (25 km east of Oxford). The computation results indicate that the three models offer similar accuracy when predicting rainfall at current time. Model II performs better than the other two models when predicting rainfall at future time horizons [IEEE 2013].
Pinky Saikia Dutta et. al. said that Meteorological data mining is a form of data mining concerned with finding hidden patterns inside largely available meteorological data, so that the information retrieved can be transformed into usable knowledge. Weather is one of the meteorological data that is rich in important knowledge. The most important climatic element which impacts on agricultural sector is rainfall. Thus rainfall prediction becomes an important issue in agricultural country like India. Author uses data mining technique in forecasting monthly Rainfall of Assam. This was carried out using traditional statistical technique -Multiple Linear Regression. The data include Six years period [2007-2012] collected locally from Regional Meteorological Center, Guwahati,Assam, India . The performance of this model is measured in adjusted R-squared .Our experiments results shows that the prediction model based on Multiple linear regression indicates acceptable accuracy [IJCSE 2014].
method, we have to forecast rainfall for our state also [IJET 2010].
Ravinesh C. Deo et. al. siad that The prediction of drought events is a topic of significant interest for the management of water resources agriculture, facilities maintenance, control and infrastructural (floodgates, airports, motor-roads, etc.). Our study attempted to determine an effective data-driven machine learning model for predicting the monthly Effective Drought Index (Byun and Wilhite, 1999) using meteorological datasets from eastern Australia for the first time. A new machine learning model (ELM), which was an improved version of the SLFN architecture, was investigated and the prediction skills were compared with the conventional ANN model with back propagation algorithm. The monthly variables used as inputs to both models were the mean rainfall and mean, maximum and minimum temperatures and the climate mode indices (Southern Oscillation Index, Pacific Decadal Oscillation, Indian Ocean Dipole and Southern Annular Mode) [Elsevier 2014].
S. N o. Author/Title/Year/ Publication Meth od Used Description
1. Shubhendu Trivedi
e. al. The Utility of
Clustering in
Prediction Tasks
Centre for
Mathematics and
Cognition gran 2011 K-Mena s
Observed that use of
a predictor in
conjunction with
clustering improved
the prediction
accuracy in most datasets
2. Hakan Tongal et. al.
Phase-space
reconstruction and self-exciting threshold modeling approach to forecast lake water levels Springer-Verlag
Berlin Heidelberg
2013 k-neare st neigh bour (k-NN) model & SETA R model
A comparison of two nonlinear model
approaches was
made. Author used the k-NN approach and SETAR model for prediction of water levels for the three largest lakes in Sweden.
3. Andrew Kusiak et.
al./ Modeling and
Prediction of
Rainfall Using
Radar Reflectivity
Data: A
Data-Mining Approach/ IEEE 2013 k-NN, SVM, MLP, Rand om forest
Among the five data-mining
algorithms tested in this paper, the MLP has performed best. It has been selected to predict rainfall for three models for all future time horizons. The baseline Model
I has been
constructed with
radar reflectivity
data only. The
proposed
methodology has
demonstrated
high-accuracy rainfall
predictions in
Oxford, Iowa.
4. Pinky Saikia Dutta
Et. Al. / Prediction Of Rainfall Using Datamining
Technique Over
Assam/ IJCSE 2014 Multi ple linear regres sion
Uses data mining
technique in
forecasting monthly Rainfall of Assam. This was carried out
using traditional
statistical technique
-Multiple Linear
Regression. The data include Six years period [2007-2012]
collected locally
from Regional
Meteorological Center,
Guwahati,Assam,
India . The
performance of this model is measured
in adjusted
R-squared.
5. M.Kannan et.
al./Rainfall
Forecasting Using
Data Mining
Technique/ IJET
2010
Regre ssion
Rainfall prediction
becomes a
significant factor in agricultural
challenging
problems around the world in the last century. Regression technique provides sifnificent accuracy.
6. Ravinesh C. Deo et. al./ Application of the extreme learning machine algorithm for the prediction of
monthly Effective
Drought Index in
eastern Australia/
Elsevier 2014
ANN model
The ELM model is seen to enhance the prediction skill of
the monthly
Effective Drought
Index over the ANN
model, and
therefore, can
overcome
deficiencies in
prediction when
applied to climate
analysis that
typically requires
thousands of training data points and time
efficacy of the
modeling framework.
7. Jae-Hyun Seo et.
al./Feature Selection for Very Short-Term
Heavy Rainfall
Prediction Using
Evolutionary Computation/ Hindawi 2013
k-NN and k-VNN
In comparative SVM
tests using
evolutionary
algorithms, the
results showed that
genetic algorithm
was considerably
superior to
differential
evolution. Te
equitable treatment score of SVM with
polynomial kernel
was the highest
among our
experiments on
average. k-VNN
outperformed k-NN, but it was dominated
by SVM with
polynomial kernel.
III.
Problem Identification
Jae-Hyun Seo et. al. Hindavi 2014 developed a method to predict heavy rainfall in South Korea which uses k-NN and Variant k-k-NN as prediction model.
K-nearest neighbours - Algorithm Step-1. Training: Store all the examples Step-2. Prediction: h(xnew )
Let be x1, . . . , xk the k more similar examples to xnew
h(xnew )= combine predictions(x1, . . . , xk ) Step-3. The parameters of the algorithm are the number k of neighbours and the procedure for combining the predictions of the k examples
Step-4. The value of k has to be adjusted (crossvalidation)
There are some bottlenecks of k-nearest neighbor prediction are as follows:
1. The straightforward algorithm has a cost O(n log(k)), not good if the dataset is large.
2. The model cannot be interpreted (there is no description of the learned concepts).
3. It is computationally expensive to find the k nearest neighbors when the dataset is very large.
4. Performance depends on the number of dimensions that we have (curse of dimensionality) =⇒ Attribute Selection.
5. The more dimensions we have, the more examples we need to approximate a hypothesis.
6. This is especially bad for k-nearest neighbors i.e. if the number of dimensions is very high the nearest neighbors can be very far away.
7. The number of examples that we have in a volume of space decreases exponentially with the number of dimensions.
8. K-means has problems when clusters are of differing
a. Sizes b. Densities
c. Non-globular shapes 9. Problems with outliers
IV.
Solution Methodology
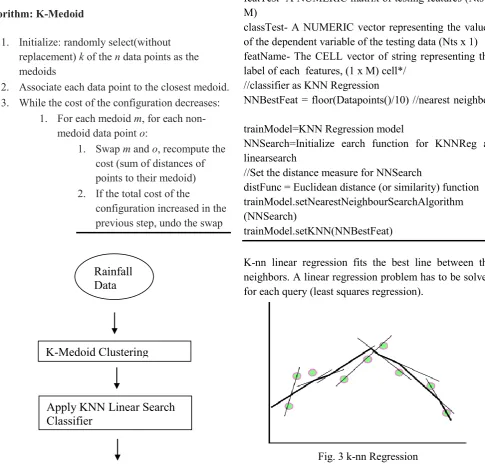
As we have discussed in problem identification section to overcome the drawback of k-means clustering algorithm we will use K-nearest neighbours - Regression algorithm accordingly our proposed scheme layout as shown in fig-2.
In our proposed algorithm k-nn classification and regression is integrated to overcome the bottle neck if exsiting k-nn algorithm.
Further we have also compared the performance of earlier prediction algorithm with our proposed algorithm.
Algorithm
Algorithm: K-Medoid
1. Initialize: randomly select(without replacement) k of the n data points as the medoids
2. Associate each data point to the closest medoid. 3. While the cost of the configuration decreases:
1. For each medoid m, for each non-medoid data point o:
1. Swap m and o, recompute the cost (sum of distances of points to their medoid) 2. If the total cost of the
configuration increased in the previous step, undo the swap
Fig. 2 Proposed Scheme Layout
Proposed Algorithm
Regression (featTrain classTrain, featTest, classTest, featName, classifier)
/*featTrain- A NUMERIC matrix of training features (N x M)
classTrain- A NUMERIC vector representing the values of the dependent variable of the training data (N x 1) featTest- A NUMERIC matrix of testing features (Nts x M)
classTest- A NUMERIC vector representing the values of the dependent variable of the testing data (Nts x 1) featName- The CELL vector of string representing the label of each features, (1 x M) cell*/
//classifier as KNN Regression
NNBestFeat = floor(Datapoints()/10) //nearest neighbor
trainModel=KNN Regression model
NNSearch=Initialize earch function for KNNReg as linearsearch
//Set the distance measure for NNSearch
distFunc = Euclidean distance (or similarity) function trainModel.setNearestNeighbourSearchAlgorithm (NNSearch)
trainModel.setKNN(NNBestFeat)
K-nn linear regression fits the best line between the neighbors. A linear regression problem has to be solved for each query (least squares regression).
Fig. 3 k-nn Regression
Rainfall
Data
Apply KNN Linear Search
Classifier
Apply KNN Regression
Prediction Model
Rainfall Forecasting
V.
Result and Discussion
For implementation of our proposed algorithm we have used Matlab 2015b. We have used rainfall dataset from Department of Agricultural Meteorology Indira Gandhi Agricultural University, Raipur Station: Labhandi Monthly Meteorological Data: 2015. Example as follows:
Mont h
Max.
Min. Temp .
Rainf all
Relative Humidi ty
Wind Veloci ty Tem
p. (°C) (mm) (%)
(Kmp h)
(°C)
I II
Jan. 26.5 11.4 9.4 91 37 2.8 Feb. 30.9 14.4 2.2 85 33 2.9 Mar 33.6 19.1 19.3 75 34 3.8 Apr. 37.3 23.1 51.4 73 35 7.2 May 41.9 27.4 13.4 58 28 7.1 Jun. 36 26 271.6 80 54 8.4 Jul. 31.9 25.3 173.2 87 71 8.4 Aug. 31.3 25.2 267.4 91 73 7 Sep. 32.2 25.2 219.6 93 66 4.4 Oct. 33.3 22.3 0 91 47 2.7 Nov. 31.3 17.2 0 89 37 2.8 Dec. 29.1 14.9 13.8 85 39 2.6
Total 1041.
3
Avera
ge 32.9 21 83 46 5
Fig.4- Main GUI of Proposed System
Table-1 Meteorological Data S.
No.
Methodology TPR(True Positive Rate)
1. Earlier 85%
2. Proposed 92%
VI.
CONCLUSION
Forecast is merely a prediction about the future values of data. After experimental evaluation we came into conclusion that our proposed algorithm produces TPR as 92% henceforth proposed algorithm having accuracy is better.
In future, we can apply proposed algorithm to image dataset, to increase the prediction accuracy, some other prediction model or deep learning can be applied.
VII.
REFERENCES
[1]. Shubhendu Trivedi e. al. The Utility of Clustering in Prediction Tasks Centre for Mathematics and Cognition gran 2011
[2]. Hakan Tongal et. al. Phase-space reconstruction and self-exciting threshold modeling approach to forecast lake water levels Springer-Verlag Berlin Heidelberg 2013
[3]. Andrew Kusiak et. al./ Modeling and Prediction of Rainfall Using Radar Reflectivity Data: A Data-Mining Approach/ IEEE 2013
[4]. Pinky Saikia Dutta Et. Al. / Prediction Of Rainfall Using Datamining Technique Over Assam/ IJCSE 2014
[5]. M.Kannan et. al./Rainfall Forecasting Using Data Mining Technique/ IJET 2010
[6]. Ravinesh C. Deo et. al./ Application of the extreme learning machine algorithm for the prediction of monthly Effective Drought Index in eastern Australia/ Elsevier 2014
[7]. Jae-Hyun Seo et. al./Feature Selection for Very Short-Term Heavy Rainfall Prediction Using Evolutionary Computation/ Hindawi 2013
[8]. Meghali A.Kalyankar,Prof. S.J.Alaspurkar.Data Mining Technique to analyse Meterological Data.IEEE Paper.