1 INTRODUCTION
Different forms of energy can be recognized within the electromagnetic spectrum, due to their wave-lengths and frequencies. Frequencies ranging be-tween 3 kHz and 300 GHz define the Radio Fre-quency (RF) part of the spectrum. Ground-penetrating radar (GPR) is an electromagnetic tool operating within the RF spectrum.
The RF spectrum composes part of the Non-ionizing radiations (NIR). The NIR radiative energy is able to only excite the ions contained within a medium when passing through it, instead of charging them. The most remarkable effect from this excitation is the heating of the medium. Other effects are generally re-ferred to as non-thermal. The power of penetration of a NIR into a body, as well as its rate of absorption, is highly frequency-dependent (Kwan-Hoong 2003).
To date, the non-thermal effects of NIR on human health are not completely understood, and several in-ternational institutions payed attention on the free use of radiative instruments, especially in the case of un-controlled environment, such as in GPR surveys of roads. This fact, as reported in many national and in-ternational research programmes (Dimbylow & Bolch 2007, Gluszcz 2009, ICNRPI 1992, Health Protection Agency 2006, 2008, Mobile Telecommu-nications and Health Research Programme, 2007), is raising attention in the field. To this effect, several guidelines and standards have been published in the last decades, with the aim of regulating the use of NIR in both controlled and uncontrolled environments. Broadly, United States (US) and Western Europe re-fer to (IEEE Standards Coordinating Committee on Non-Ionizing Radiation Hazards 1992, ICNRPI
Signal processing for optimisation of low-powered GPR data with
application in transportation engineering (roads and railways)
L. Bianchini Ciampoli, F. D’Amico & A. Calvi
Department of Engineering, Roma Tre University, Rome, Italy
F. Benedetto
Signal processing for Telecommunications and Economics Lab., Roma Tre University
F. Tosti
School of Computing and Engineering, University of West London, London, United Kingdom
ABSTRACT: High-frequency air-coupled ground-penetrating radar (GPR) systems are used in road engineer-ing for achievengineer-ing high-resolution and fast imagengineer-ing of the shallow layers of pavements. Regulatory policies on the permitted radiated power enacted by some international agencies for information and communication tech-nologies, such as, the Federal Communications Commission operating in the United States, have led manufac-turers to market low-powered GPR systems to comply with the standards.
The signal collected by these systems is more unstable than ordinary-powered GPRs, with the interpretation of the raw data being misleading or, mostly, totally subjective or even impossible. Thereby, the use of relevant signal processing techniques combined purposely within procedural schemes may help to reach reliability and effectiveness levels close to those granted by standard systems. In this study, a post-processing scheme aimed at maximising the correlation between signals collected by low-powered and standard 2 GHz antenna systems in railway and road surveys is presented.
1992) whilst Russia, China, and Eastern Europe com-ply with (Sanitary Norms and Regulations. 1996). Typically, these science-based standards set a maxi-mum permissible exposure (MPE) in terms of field strength, power density and time-averaged rate of en-ergy transfer. Particularly, the US Federal Communi-cations Commission (FCC) integrated the most com-mon standards into a regulatory policy (FCC 1997). More specifically in the area of GPR, manufacturers have to comply with different regulations on the power emission limit, and the challenge is mostly in countries like US where the threshold for maximum power emission is very low. As a consequence of a lower radiative power, these types of GPR systems exhibit worst performances in terms of signal-to-noise (SNR) ratio.
This work aims at evaluating the potential of low-powered systems in civil engineering applications. In particular, a dataset of GPR signals have been gath-ered from surveys carried out on different transporta-tion infrastructures with both standard and low-pow-ered systems. In this study, the results coming from the different systems have been compared, and a post-processing scheme for optimizing the information from the low-powered signals is proposed.Getting started
2 THE DATASET
In order to evaluate different conditions that are most likely to be encountered on site in transportation en-gineering applications, both road and railway GPR
surveys have been performed. According to the scope of this study, the same road and railway sections have been surveyed by means of both standard and low-powered systems. Pulsed GPR systems equipped with horn antennas and central frequency of 2000 MHz, were used. They were set to operate suspended in the air at 0.40 m height from the road/railway surface. The systems are manufactured by IDS Georadar and are actually identical in the whole set of components, with the exception of the radiative power. As far as the experimental frameworks are concerned, GPR surveys have been carried out at three different sites. In particular, road surveys have been performed over two different sections, located in the district of Rieti (Italy) and in the district of Guadalajara (Spain). In these surveys, the antenna was mounted onto an in-strumented vehicle, and supported by a wooden framework. A third static data collection for railway engineering applications has been carried out in la-boratory environment at Roma Tre University, over an experimental setup reproducing a ballasted railway track-bed. The data collections from the three survey sites are depicted in Figure 1. For sake of consistency, since the tests collected over the railway track-bed were static and, hence, produced a single A-scan, a single trace was also selected along the scanned sec-tions for both the aforementioned road surveys. To ensure that the A-scans collected with the different
GPR systems, are referred to the same geographical position, GPS coordinates have been matched.
3 DATA POST-PROCESSING
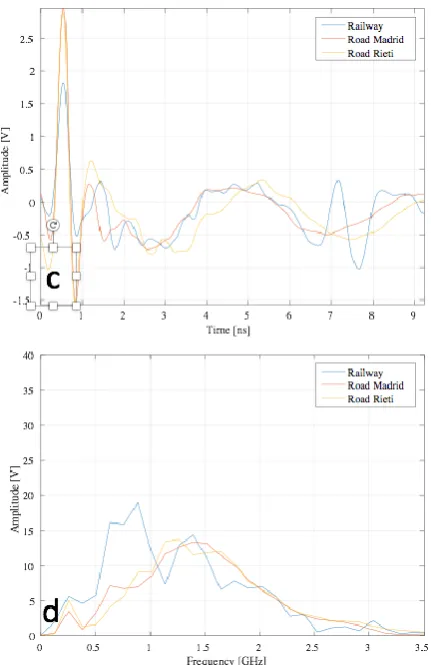
Figure 2 shows the raw GPR traces, collected with the two antennas, both in the time and frequency do-mains. As clearly visible, low-powered signals are
much more affected by noise, to the point that it is almost impossible to recognize the reflection peaks related to the dielectric discontinuities (Figure 2a). In more detail, it is worth noting the peaks of amplitude back-received at approximatively 200 MHz in the low-powered spectra (Figure 2b), which are to be re-lated with noise and tend to “blind” the signal con-tributes.
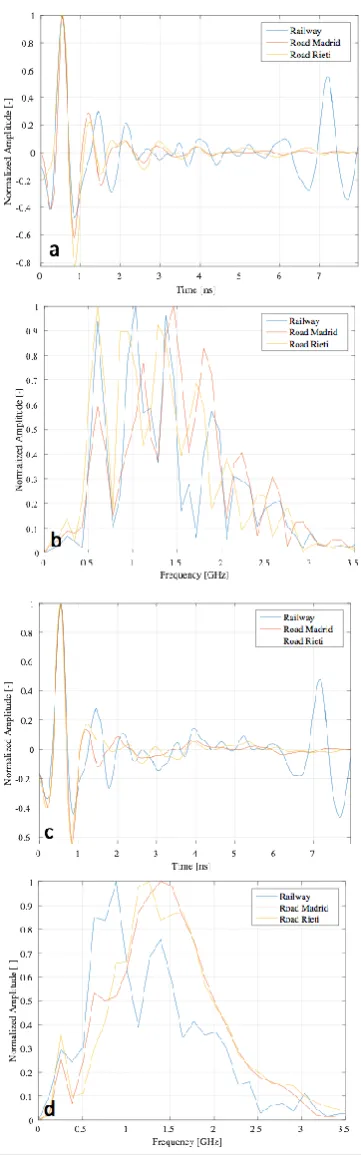
Thereby, the analysis of the raw data suggested that, by filtering out the lower frequency components from the spectra, useful information could have been retrieved. Accordingly, after a preliminary zero- off-set removal, a band-pass filter was applied to the whole dataset. As a common practice (Benedetto et al. 2016), the bandwidth included between the two cut-off frequencies has been set, in both cases, as 1.5 times the nominal frequency. As a result, the high-pass and low-high-pass frequencies have been set as 500 MHz and 3500 MHz, respectively. For sake of com-parison, the amplitude has been normalised. In Figure 3, the effect of the band-pass filtering on the signals is shown. The benefit led by the procedure is clearly noticeable, especially for the low-powered case. It is now possible to recognize different amplitude peaks, deriving from the reflections at the interfaces of lay-ers (Figure 3a). On the other hand, the low- powered spectra appear more chaotic than the regular ones, which is most likely due to the lower SNR ratio. Also, Figure 3b still shows a low-frequency peak at 550 MHz, hardly linkable with informative content. Ac-cordingly, in order to maximise the likelihood be-tween the two systems, a specific high-pass frequency needs to be set when processing low-powered data.
4 POST-PROCESSING OPTIMISATION Using the data collected by GPR with standard radi-ated power as a reference, new band-pass filters were applied to the low-powered signals with differently
Figure 3. – Low-powered (a-b) and standard (b-c) GPR sig-nals, after the standard band-pass filter application.
set high-pass frequency values, in order to reach the
best matching between the data collected by the two systems. In particular, the range spanning between 200 MHz and 700 MHz has been tested, with steps of 100 MHz.
As reference parameter for the maximisation proce-dure, the correlation coefficient (CC) between the sig-nals collected with different systems was taken and calculated as:
CC= σxy
σxσy (1)
with X being the low-powered system signal, Y being the standard system, x and y being their standard deviations, and xybeing their covariance. For each test condition, five correlation rates have been com-puted, with respect to the five tested high-pass fre-quencies. The curves fitting these five values are rep-resentative of the effectiveness of the filter in reducing the discrepancy between the two signals. In order to reach a processing scheme suitable for every conditions that can be tested in the transporta-tion infrastructures surveys, a fourth curve, fitting the average correlation rates calculated for each pro-cessing condition, has been calculated. Accordingly, the frequency related to the maximum of this curve indicates the optimal high-pass frequency required to maximise the effectiveness of the low-powered
sys-tems. The optimisation procedure is depicted in Fig-ure 4, and a maximum band-pass frequency value of 560 MHz is defined. This implies a shrinkage of the bandwidth from 1.5 to 1.45 times the central fre-quency. In Figure 5, instead, the comparison between the low-powered and standard processed signals is shown, for each test. As clearly visible, the applica-tion of such a scheme led to encouraging results.
5 CONCLUSIONS AND FUTURE PERSPECTIVES
This study deals with the performance analysis of low-powered GPR systems, equipped with horn an-tennas with central frequency of 2000 MHz. In order to evaluate the capability of such devices to detect tar-gets in transportation engineering surveys, three ex-perimental activities have been arranged for collect-ing GPR data with low-powered and standard systems, in both railway and road environments. The analysis of the raw data emphasized the need for us-ing bandpass filters, to cut the noise contribution, which was very significant for the utilised low-pow-ered system, especially at lower frequencies. Further-more, the study highlighted that different filter band-widths are required, whether the low-powered or the standard system are considered. Accordingly, by tak-ing the standard signal as a reference, an optimum procedure has been developed for defining the best high-pass frequency to use in low-powered systems. The main purpose of this was to minimize the discrep-ancy between the signals, and maximising the effec-tiveness of low-powered antennas. As a result, an op-timal high-pass frequency value of 560 MHz was defined.
Future efforts in the field are to be focused on a simi-lar identification of the high-pass frequency for GPR systems with different central frequencies, as well as on widening the range of test conditions and reaching a higher statistical significance.
ACKNOWLEDGEMENTS
The authors would like to express their gratitude to Mr Spartaco Cera, from Roma Tre University, for the valuable support given during the field activities. Special thanks to IDS Georadar for the precious collaboration in supplying part of the radar equipment. This work has also benefitted of the activities carried out within the EU funded COST Action TU1208 “Civil Engineering Applications of Ground Penetrating Radar.”
Figure 5. – Comparison between Low-powered and standard
REFERENCES
Benedetto, A., Tosti, F., Bianchini Ciampoli, L., D’Amico, F. 2016. An overview of ground-penetrating radar signal pro-cessing techniques for road inspections, Signal Propro-cessing, In press.
Dimbylow, P. & Bolch, W. 2007. Whole-body-averaged SAR from 50 MHz to 4 GHz in the University of Florida child voxel phantoms. Physics in Medicine and Biology, 52:6639– 6649.
Federal Communications Commission Office of Engineering & Technology. 1997. Evaluating Compliance with FCC Guide-lines for Human Exposure to Radiofrequency Electromag-netic Fields, OET Bulletin 65, Edition 97-01.
Federal Office for Radiation Protection. DMF, German Mobile Telecommunication Research Programme. 2008., health risk assessment of mobile communications. BfS-SG-08/08.
Bremerhaven: Verlag fu ̈r neue Wissenschaft GmbH. Gluszcz, M. 1979. Difficulties in the certification of microwave
disease. Med Przemyslowa, 30:147- 150
Health Protection Agency. 2006. Power frequency electromag-netic fields, melatonin and the risk of breast cancer. Report of an independent Advisory Group on Non-Ionising Radia-tion. Chilton: HPA; Doc HPA, RCE-1.
Health Protection Agency. 2008. Static magnetic fields. Report of an independent Advisory Group on Non Ionising Radia-tion. Chilton: HPA; Doc HPA, RCE-6.
IEEE Standards Coordinating Committee on Non-Ionizing Ra-diation Hazards. 1992. Standard for Safe Levels With Re
spect to Human Exposure to Radio Frequency Electromag-netic Fields, 3 KHz to 300 GHz (ANSI/IEEE, 1999), The In-stitute of Electrical and Electronics Engineers, New York.
Kwan-Hoong, N.g. 2003. Non-Ionizing Radiations–Sources, Bi-ological Effects, Emissions and Exposures, Proceedings of the International Conference on Non-Ionizing Radiation at UNITEN (ICNIR2003), Electromagnetic Fields and Our Health, 20th –22nd October 2003.
International Commission on Non-Ionizing Radiation Protection (ICNRPI). 1996. Health issues related to the use of hand-held radiotelephones and base transmitters. Health Physics 70:587-593
Mobile Telecommunications and Health Research Programme. 2007. Report 2007. Available at: http://www. mthr.org.uk/documents/MTHR_report_2007.pdf.