UC San Diego
UC San Diego Electronic Theses and Dissertations
TitleProfessional Learning Community (PLC) Autonomy & Trust – A Cross Case Study Permalink https://escholarship.org/uc/item/3fd0s8mv Author Casas, Martin Publication Date 2019 Peer reviewed|Thesis/dissertation
eScholarship.org Powered by the California Digital Library
UNIVERSITY OF CALIFORNIA SAN DIEGO CALIFORNIA STATE UNIVERSITY, SAN MARCOS
Professional Learning Community (PLC) Autonomy & Trust – A Cross Case Study
A dissertation submitted in partial satisfaction of the requirements for the degree Doctor of Education in Educational Leadership by Martín Casas Committee in charge:
University of California San Diego Christopher Halter, Chair Elizabeth Simon
California State University, San Marcos Manuel Vargas
Copyright Martín Casas, 2019 All rights reserved.
iii
The Dissertation of Martín Casas is approved, and it is acceptable in quality and form for publication on microfilm and electronically:
Chair
University of California San Diego California State University, San Marcos
iv
DEDICATION
To my kids, Sofia and Diego, this dissertation is dedicated to you. I missed a lot of swim lessons. I missed a lot gymnastics. I missed a lot of art lessons. I missed a lot of tennis. I missed a lot of play dates. I missed a lot of smiles, a lot of frowns, a lot of tears, and a lot of joy. Memories I will never get back. Often, this dissertation seemed impossible to finish, all I needed to continue was to look at the radiant picture of both you on my phone. You have all of me now, I promise. Los Amo!
To my day one, my wife, Perla. Fifteen years ago, we met at San Ysidro High School. Fifteen years ago, I told you on our first date that I would marry you. Fifteen years ago, I told you that one day I would be a doctor. You always believed in me. You always believed in us. You always believed in the vision. You always supported me. Thank you for being an amazing wife. Thank you for being an amazing Mother. You have all of me now, I promise. Te amo!
To my Mother, Lourdes Casas, a perpetual thank you. One of our first projects for this doctoral program was to design our Myography. The Myography presentation was supposed to outline: my background, my past, my culture, my family, what is important to me, my biggest influences in my leadership style. The first slide of the presentation was a picture of you and I when I was just a baby. The only words I got out were “This is my Mom and I, she is my biggest influence” before I started crying. Mom, you have taught me to lead from the heart, not by the numbers. You have taught me that kindness, caring and empathy are the most important leadership traits. Tu He – Man ya es doctor. Te quiero mucho Madre!
To my Father, Francisco Casas, a perpetual thank you. During the second year of this
v
into the intricacies of leadership and leadership behaviors that inspire, motivate, and change teams/organizations. Many of the lessons cited, you taught me from a young age, including the most basic and simple one: eating last. Take care of your family first. Take care of your kids first. Take care of your team first. Take care of others first. In the middle of my office I have a large decorative elephant. Many people think that it is because of what an elephant
symbolizes: longevity, stamina, mental faculties, cooperative spirit, and loyalty. Which I
never dispute, but the real reason is because the elephant reminds me of your elephant
collection. The real reason is because it reminds me of you. I didn’t need a doctorate to learn what a great leader was, because I’ve always had one in front of me. Te quiero mucho Padre! To my siblings, Carlos and Flavia. Love you guys! Thank you for always supporting me. So proud of what both you have become, and of what you will be!
Para mis Abuelos, Samuel Casas y Armando García. Los dos siempre llenos de
alegría y de amor. Los quiero mucho! Que en paz descansen. Para mis Abuelas, Olivia
García y Flavia Casas, las quiero mucho. Dos de las personas más fuertes que he tenido en mi
vida. Los admiro a las dos.
vi
EPIGRAPH
We’ve always defined ourselves by the ability to overcome the impossible. And we count these moments. These moments when we dare to aim higher, to break barriers, to reach for the stars, to make the unknown known. We count these moments as our proudest
achievements. But we have lost all that. Or perhaps we’ve just forgotten that we are still pioneers. And we’ve barely begun. And that our greatest accomplishments cannot be behind us, because our destiny lies above us.
vii
TABLE OF CONTENTS
Signature Page ··· iii
Dedication ··· iv
Epigraph ···v
Table of Contents ··· vii
List of Tables ··· ix
List of Figures ···x
Vita ··· xi
Abstract of Dissertation ··· xiii
CHAPTER 1: INTRODUCTION PLC’s and Program Improvement ···2
Statement of the Problem ···3
Research Questions ···4 Theoretical Framework ···4 Rationale ···5 Overview of Study ···8 Significance of Study ···9 Limitations of Study ···9 Overview of Dissertation ···10
CHAPTER 2: LITERATURE REVIEW Legacy of NCLB ···13
Corrective Action & PLC’s ···16
PLC overview and Participation Benefits ···17
PLC Participation & Student Achievement ···20
School Leadership, Autonomy & Trust ···23
Distributed Leadership ...25
PLC Structure & Organizational systems ···29
Summary ···37
Gaps in Literature ··· 39
Leadership Implications of the Literature ···40
viii CHAPTER 3: METHODS Introduction ···43 Research Questions ···43 Research Design ···44 Participants ···49 Procedures ···49 Measures ···50 Data Collection ···50 Data Analysis ···51 CHAPTER 4: ANALYSIS Demographic Profile of Participants ···53
Data Analysis ···56
Research question one ···56
Finding one ···57
Finding two ···67
Research question two ···75
Finding three ···75
Finding four ···82
Research question three ···88
Finding five ···88
Finding six ···92
Chapter Summary ···95
CHAPTER 5: DISCUSSION Overview of Problem ···97
Review of Theoretical Framework ···98
Review of Methodology ···99 Summary of Findings ···102 Implications ···104 Limitations ···107 References ···110 Appendix ···118
ix
LIST OF TABLES
Table 1: API vs AYP ···15
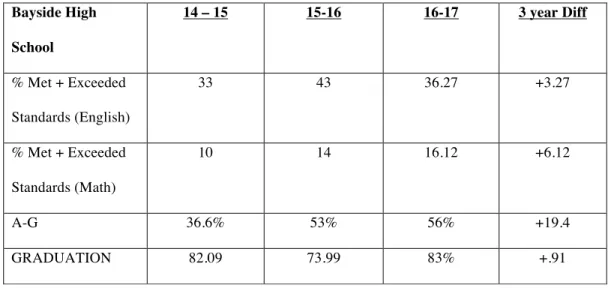
Table 2: Bayside HS Achievement trends ···48
Table 3: Parkview HS Achievement trends ···48
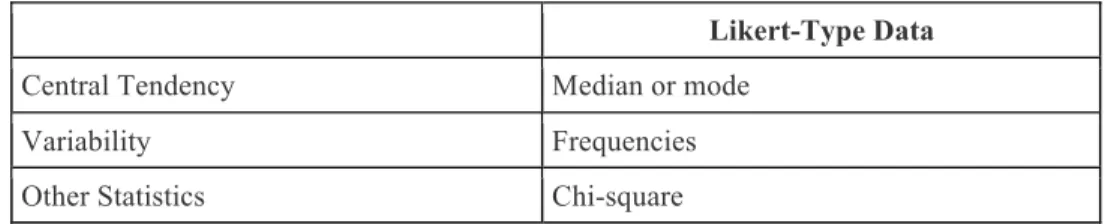
Table 4: Suggested Data Analysis Procedures for Likert-Type Data ···51
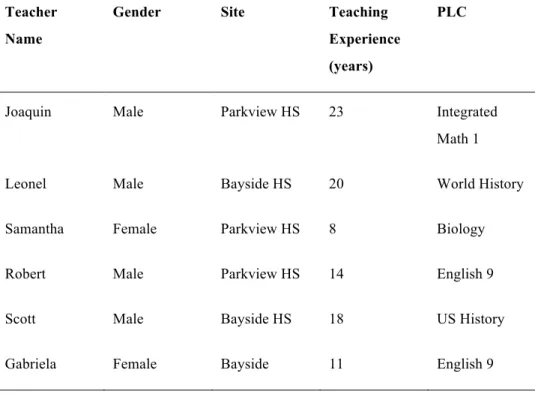
Table 5: Demographical Data of Interview Participants ···55
Table 6: PLC Meeting Observation Participants ···55
Table 7: Autonomy scale item results ···77
x
LIST OF FIGURES
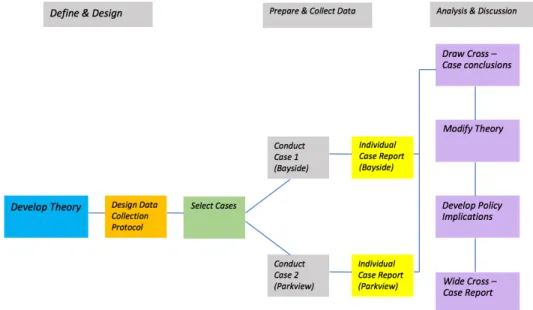
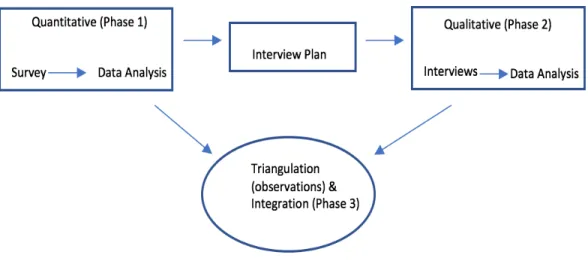
Figure 1: Cross Case Study Research Design ···44 Figure 2: Sequential Explanatory Phases ···45 Figure 3: How many times per month does your PLC team meet? ···58 Figure 4: Our team consistently has an agenda, takes attendance, and writes meeting
minutes/notes? ···60
Figure 5: My PLC works to clarify the criteria by which we will judge student work
and practice applying those criteria consistently ···63
Figure 6: We monitor student learning on essential outcomes through team developed
formative assessments that are aligned with district and state assessments ···64
Figure 7: We provide a system of intervention that guarantees each student receives
additional time and support for learning, if needed ···66
Figure 8: My PLC has developed & follows our norms··· 68
Figure 9: We identify the specific standard or target students must achieve on each of the
essential skills addressed by the formative assessment. ··· 71
Figure 10: We use common assessments to identify students who need additional times
xi
ACKNOWLEDGEMENTS
I vividly remember the words of advice we received from previous JDP Cohorts during our JDP orientation: Don’t buy home. Don’t have a baby. And don’t start a new job. I have never been much of a rule follower, so by the end of the first year of the program I had committed all three deadly doctoral sins. I only survived this journey because of the
incredible support I received from my family, work colleagues, JDP family, dissertation committee (Dr. Halter, Dr. Vargas, and Dr. Simon), and my dissertation chair: Christopher Halter.
Special thanks to my colleague, mentor and friend Dave LeMaster. Thank you for supporting me at the beginning of my administrative and doctoral journey. I am forever indebted to you and Poway Unified.
To my Escondido Union High School District family, thank you for unconditionally supporting my wild ideas. You have let me be curious. You have let me explore. You have let me reimagine high school. To Steve Boyle, April Moore, Olga West, thank you for supporting me throughout this doctoral adventure.
To my JDP family, aka the transformative twelve, aka the historically great cohort. Thank you for always being my support network. I am so proud to call all of you cohort mates, and life-long friends. Let’s live up to our nicknames and truly change the world!
Lastly, I would like to express my deepest gratitude and appreciation to my dissertation chair, Dr. Christopher Halter. Your calm demeanor, authentic feedback, and consistent encouragement have been instrumental to my success.
xii
VITA
2003 Bachelor of Arts in Economics, San Diego State University
2006 BCLAD Single Subject Teaching credential in Social Science, National University 2008 Master of Education Science in Cross – Cultural Education, National University 2011 Educational Administrative Services Credential, Point Loma Nazarene University 2019 Doctor of Education in Educational Leadership, University of California San Diego
and Cal State University San Marcos
PUBLICATIONS “PLC Autonomy & Trust: A Cross – Case Study” Dissertation
FIELDS OF STUDY Major Field: Educational Leadership
xiii
ABSTRACT OF THE DISSERTATION
Professional Learning Community (PLC) Autonomy & Trust – A Cross Case Study
by Martín Casas
University of California San Diego, 2019 California State University San Marcos, 2019
Christopher Halter, Chair
Since the No Child Left Behind (NCLB) era many program improvement schools were prescribed Professional Learning Communities (PLC) professional development as a corrective action by their respective Local Education Agency (LEA). Despite the adoption and implementation of many corrective action measures (including PLC’s) recommended by LEA’s, the achievement gap persists in the majority high school campuses nationwide. Millions of dollars have been invested in the PLC method of collaboration with little systematic success in closing the achievement gap in standardized test scores, A – G
requirements and college admission. There may be plenty of other factors contributing to the lack of improvement (i.e. instruction, grading practices, assessment of learning, interventions, attendance, student discipline, etc.) – but to what degree is the investment in Professional Learning Communities contributing (or not contributing) to this? Dufour & Eaker (1998, 2003, 2008) argue that schools with PLCs that are not improving student achievement is attributed to them not implementing the prescribed methodology with fidelity. However,
xiv
could there be other reasons? A review of the literature identified gaps in the research that could provide other reasons: objective assessment of PLCs, as well as PLC autonomy and PLC trust. This cross - case study used a sequential explanatory mixed-methods design
(Creswell, 2013) to analyze teacher perceptions of PLC fidelity, PLC autonomy and trust from two school sites in San Diego with similar student demographics, from the same school district, but with different trending student achievement results. Survey, interview, and field observation findings from this study suggested that Bayside High School and Parkview High School have similar PLC procedures, logistics and generally follow the Dufour & Eaker (1998; 2004) PLC model with fidelity. However, the findings also suggested that PLCs at Bayside High School have more autonomy and trust than PLCs at Parkview High School. The difference in PLC autonomy and trust could be one explanation for the difference in student performance. Additional findings also suggested that internal relationships, motivation, and vulnerability factors could be impacting PLC performance and student achievement at both sites.
1
CHAPTER 1: INTRODUCTION Introduction
My interest in researching professional learning communities (PLC) began when I transitioned from being a classroom high school teacher to a high school administrator. I started my teaching career at a high school that was part of a Title I school district in Southern California that was in program improvement. I was part of the U.S. History PLC which consisted of a team of four teachers (three veterans, and one novice teacher – myself). We met once a week for one hour to proceed through the cycle of continuous improvement that addressed the four fundamental questions for PLCs: What do we want students to learn? How are we going to teach the content and skills? How do we know if they are learning the content and skills? What are going to do if they did not get it the first time? We were expected to turn in agendas, minutes, and copies of formative assessments – this was our norm.
After seven years of teaching high school, I became an assistant principal at a high school that was part of a school district that was not Title I, or in program improvement. My experience working with PLCs in my new role as assistant principal was very different than my experience working with PLCs as a teacher at my previous site. While some of this difference may be attributed to my different role, most of it was attributed to a difference in PLC culture and the legacy of collaboration at both schools. PLC teams in my new site were not expected to turn – in agendas, minutes, or to create common formative assessments. Most teams met to discuss students, course sequencing and “parking lot” issues – or topics not focused on student learning. Two very different experiences in PLC culture/practice at two different sites.
After four years as an assistant principal, I became the principal at San Pasqual High School – a Title I school. SP High School’s PLC culture/practice was very similar to my first
2
school, however, with added layers of accountability for PLC teams. PLC teams are expected to follow the cycle of continuous improvement, but they are also expected to turn –in their meeting agendas, notes, and minutes – not only to their department administrator, but also to the district learning support office. I began to wonder why the PLC culture/practice at my first school and San Pasqual High School were similar. Moreover, why was the PLC culture/practice at my second school so different from my experience at the other two sites? Could it possibly have something to do with the demographics of each respective site? Title I status versus non – Title I status? Program improvement status versus non – program improvement status? Differences in school leadership? The inspiration for this research comes from my personal work experience, but also from a curiosity to see in what way the phenomenon of difference in PLC culture/practice exists in a micro sense. And why?
This research explored the phenomenon that I experienced at my first school site and at San Pasqual High School by studying the PLC structure, organization and school leadership at two Title I schools. The two sites for this study were both from the Belding Union High School District and have similar demographics, but a difference in student achievement (CAASPP Math, CAASPP English, A-G rate, and graduation rate).
PLC’s and Program Improvement
PLC’s popularity increased dramatically in the early 2000’s coinciding with the adoption of No Child Left Behind (NCLB). NCLB was signed into law by President George W. Bush in 2002 with the intent to reauthorize the Elementary and Secondary Education Act (ESEA) of 1965 and then 1994 with greater emphasis on assessment and accountability. Under NCLB, schools that did not meet Adequate Yearly Progress (AYP) in statistically significant demographic groups for two consecutive years were designated as “program improvement” (PI)
3
schools. Schools labeled “program improvement” were forced into corrective action measures as prescribed by their corresponding local education agency (LEA) – which usually meant their corresponding school district or county office of education.
Corrective action measures often included training around English Language Learner instruction (i.e. SDAIE), student-centered instruction, critical reading strategies, writing strategies, academic/social-emotional interventions, parent engagement, teacher collaboration and many others. While many of the corrective action approaches mentioned contribute to school improvement, few have the organizational liquidity for sustained and substantive school improvement as teacher collaboration (Dufour & Eaker, 1998; Dufour, 2004, Dufour, Dufour & Eaker, 2006; Dufour & Dufour, 2015). Collaboration in public schools follows Dufour & Eaker’s (1998) Professional Learning Communities (PLC) model.
Statement of the problem
The legacy that NCLB has left on program improvement schools has been one of little progress to close the achievement gap – with the exception of improvement in the high school graduation rate. Despite the adoption and implementation of corrective action measures (including PLC’s) recommended by LEA’s, the achievement gap persists in the majority campuses nationwide. Millions of dollars have been invested in the PLC method of
collaboration with little success system – wide in closing the achievement gap. Why? Dufour & Eaker (1998, 2003, 2008) argue that it is because schools are not implementing the prescribed methodology with fidelity. However, could there be other reasons? Are PLC's being implemented and practiced differently at different sites? For what reason? Does it have to do with schools' demographics and the socioeconomic status of the student population? Program improvement status? A review of the literature reveals a gap in objective assessment
4
of PLC’s, as well as a gap in studying PLC autonomy and trust. This cross - case study will look at two schools with similar demographics - within the same district. Bayside High School has experienced an increase in student achievement for three consecutive years. Parkview High School has experienced a decrease in student achievement for three consecutive years.
Research Questions
A mixed – methods approach will be used to answer the following over –arching questions:
1. To what degree is each school (Bayside High School & Parkview High School) following the Dufour & Eaker (1998) PLC model?
• To what extent are the PLC practices similar and different at the two sites?
2. To what extent is PLC autonomy/trust similar and different at the two sites?
• How does administrative autonomy and trust impact the functioning of the
PLC?
3. What other factors could be influencing the PLC’s functioning and impact on student
achievement?
Collaboration as a Theoretical Framework for Improvement
While PLC’s did not become popular until the early 2000’s, using collaboration to increase performance/productivity is not a new concept. In fact, research in the field of business and human relations argues that office and organizational environments that cultivate and promote self-governance and collaboration perform better (Follet, 1924). It took a while for the principles of collaboration to be investigated in a school setting but Chin and Benne’s (1978) work suggests that when teachers are involved in decision-making and are provided
5
time to collaborate they become empowered with problem – solving techniques. Later
research suggests that collaboration can improve school performance if teachers have decision making autonomy and consistent time in their schedule to collaborate and receive
on-going/formative professional development (Knowles, 1979; Little, 1982; Sparks, 1983;
Williams, 2013). Dufour and Eaker’s (1998) seminal work commercialized, trademarked and branded “Professional Learning Communities” or PLCs. This study’s conceptual framework will analyze teacher collaboration using Dufour and Eaker’s (1998) Professional Learning Communities model.
Dufour and Eaker’s (1998) work synthesized previous research on educational collaboration to create a model that advocates for teacher course-a-like teams to have:
decision-making autonomy, weekly time on the schedule to collaborate, and opportunities for on-going/formative professional development. Professional Learning Communities are
course-a-like teams that usually meet once a week to discuss common curriculum, instruction, assessments and interventions. A review of the literature suggests that, if implemented with fidelity, Professional Learning Communities could help close the achievement gap and improve student achievement (Berry et al., 2005; Bolam et al., 2005; Hollins et al., 2004; Louis & Marks, 1998; Phillips, 2003; Strahan, 2003; Supovitz, 2002; Supovitz & Christman, 2003). The Dufour & Eaker (1998) PLC model defines fidelity, as collaboration focused on student learning and a continuous cycle of improvement.
Rationale
Belding Union High School District has grown to more than 40,000 students in grades
7 – 12 and more than 22,000 adult learners (Belding Union High School District, 2018). The district is ethnically and socioeconomically diverse as its student body consists of: 77%
6
Hispanic, 8.24% Filipino 5.72%, White, 2.6% African - American, 1.3% Asian, .15% American Indian, 4.5% two or more races, 60% of the students qualify for free and reduced lunch, 22% are English Learners, and 2% are foster youth (2018). The district has spent a significant amount of dollars, time and resources to train teachers in Solution Trees’
Professional Learning Communities (PLC) curriculum and practices. DuFour, DuFour, Eaker, & Many (2016) define a Professional Learning Communities (PLC) as “educators committed to working collaboratively in on going processes of collective inquiry and action research to achieve better results for the students they serve” (p.11). The average cost for training a teacher is approximately $1,200 ($689 for registration plus $511 for travel, room and board). Since 2005, the school district has spent close to two million dollars on
Professional Learning Community training alone – and to what end? The latest CAASPP (California Assessment of Student Performance and Progress) results show a decrease in the percentage of students who met or exceed standards in both English and Math. In addition, the difference in achievement between student groups has widened. Why has the district not seen improvement in student learner outcomes from the investment in Professional Learning Communities training? There may be plenty of other factors contributing to the lack of improvement (i.e. instruction, grading practices, assessment of learning, interventions, attendance, student discipline, etc.) – but to what degree is the investment in Professional Learning Communities contributing (or not contributing) to this?
In the last decade, nationwide student learner outcomes have reflected the results of
Belding Union High School District. College admission, Advanced Placement (AP)
participation rate, Scholastic Aptitude Test (SAT) and American College Test (ACT) scores, California Assessment of Student Performance and Progress (CAASPP) scores, and A-G
7
completion rate (minimum course requirements for admission to University of California and or to the California State University system schools) have continued to be disproportionally lower for students of color, poverty, and ELL when compared to Caucasian and Asian students (Bradbury, Corak, Waldfogel, & Washbrook, 2015; Duncan & Murnane, 2016; Li, 2016). More recently, the California Department of Education (CDE, 2016) reported the discrepancy in CAASPP scores: 37 percent of Latinos and 31 percent of African-American students met or exceeded English standards, compared to 64 percent of whites and 76 percent of Asians. In addition, the CDE also reported that 34.6% of Latinos and 32.7% of African – Americans graduated High School completing the CSU/UC A – G requirements, compared to 49.7% of whites and 71.4% of Asians. The achievement gap persists nationwide – despite nationwide adoption of corrective action measures – including PLC’s.
The literature review will look deeper into PLC’s and explore the following the questions: How and why did district(s) adopt the PLC method of collaboration? What is the history behind it? What impact did No Child Left Behind have on the adoption of Solution Trees’ PLC model? The literature review will analyze and critique the most current peer reviewed PLC studies and identify gaps in the research. The gaps in the research will be used to inform this cross-case study that will analyze two schools (from the same district) with
similar demographics, and PLC training but with different student achievement outcomes.
This study will explore the following questions: To what extent are the PLCs similar and different at the two sites? To what extent are PLC autonomy and trust similar and
different at the two sites? How does administrative autonomy and trust impact the functioning of the PLC? And, what other factors could be influencing the PLCs functioning and impact on student achievement?
8
Ultimately, this study is needed to understand the potential impact of PLC practice, perceived PLC autonomy/trust, and other leadership behaviors have on school sites that have similar demographics, but have different achievement trajectories.
Overview of Study
This study will use a mixed-method approach to explore the similarities and differences in PLC autonomy and trust between Title 1 Bayside High School (increased performance) versus Title 1 Parkview High School (decreased performance). The study will use a cross – case study analysis (Kahhn, 2008) approach with a sequential explanatory mixed methods design (Creswell, 2003). The methods of data collection will include: quantitative Likert scale surveys, qualitative individual semi - structured interviews and observation of PLC meetings. Interview and observation data will include audio recording, transcribed notes. The study will take place in two Southern California comprehensive – public high schools that are part of the same district, subscribe to the Dufour model of PLC collaboration, have similar demographics, but have a difference in achievement. A total of 60 teachers (30 from each site) will take the trust/autonomy scale surveys – for the quantitative portion. In addition, six teachers (3 per site) will be interviewed – for the qualitative portion. Data will be collected pre/post survey, and from interviews. Additionally, three PLC meetings from each site will be observed to validate survey/interview data. Data analysis will be organized (bundled) in four categories that could provide answers to the research questions: (1)
Similarities and differences in PLC structure, procedures, and features; (2) Similarities and differences in trust; (3) Similarities and differences in autonomy; and (4) Similarities and differences in perceived leadership behaviors.
9
Significance of study
The results of this study could potentially help site level administrators differentiate the management of PLC’s. If the hypothesis that Title I Bayside High School (with increased achievement) has more perceived PLC administrative trust and autonomy than Title I school C holds true, then identifying leadership behaviors that yield a higher level of PLC trust and autonomy could inform administrators how manage a particular PLC, and potentially, help close the achievement gap.
Limitations of the study
Limitations of the study include: (a) inherent limitations of the trust and autonomy scale(s), (b) demographics of teacher subjects, (c) sample size of 180 (total number of teacher for both school sites), (d) timing and context, and (e) demographics of the two sample schools engaging in the study. In addition, my own role as an administrator/researcher may be a limitation as it could bias my interpretation of data.
The trust scale includes a variety of limitations. For example, the survey has been modified from an individual teacher perception of trust, to a PLC perception of trust. Similarly, the autonomy scale has been modified from an individual teacher perception of autonomy, to PLC autonomy. Both surveys are limited in terms of the constraints that quantitative survey data can provide. To address this limitation, three qualitative interviews (from each site) will be conducted – in addition to the survey.
The demographics and backgrounds of the survey and interview subjects could bias their responses to the survey questions. For example, teachers that grew up in a single family household may respond differently to questions about trust than teachers that grew up in a two – parent household. In addition, previous experiences under different administrators and at
10
different school sites could potentially lead to some unaccounted for variance. To address the potential bias limitation of the semi structured interviews, the researcher will conduct
observations of PLC meetings will be conducted. The observation notes will be cross – referenced against survey and semi – structured interview results.
Surveying only two comprehensive sites with approximately 80-90 teachers each may be an additional limitation. The minimum participation from each site should be at least 25-30 teachers, preferably, from core subject PLC teams. In addition, since the survey is about the perceived PLC administrative trust and autonomy, it is vital that the majority of a particular PLC team take the survey. For example, if there are ten teachers on the Biology team, the goal should be that at least half of them participate.
The timing and context under which teachers take the survey is also an important factor to taken into account. For example, one might get different responses from the same group of teachers depending on whether the survey is administered in the beginning versus the end of the year. Events and interactions with administrators throughout the year could affect the results even if they have nothing to do with collaboration. The triangulation and cross – referencing of survey, interview and observation data should minimize most of the mentioned limitations (with the exception of the “time of the year” limitation).
Overview of dissertation
In this chapter, I have introduced the problem, rationale, outlined the proposed study, and have presented the possible limitations of the study. In chapter two, I will review the prominent literature on teacher collaboration and PLC’s: Legacy of NCLB & Corrective Action, PLC Overview and Participation Benefits, PLC Participation & Student Achievement, School Leadership, Autonomy, & Trust, and PLC structure. I will conclude chapter two by
11
identifying the gaps in the literature that suggests that PLC perceived autonomy and trust should be explored. In chapter three, I explain the mixed methods approach to identify whether or not there is a difference between how Title 1 school (Bayside High School) PLC’s perceive their administrative autonomy and trust versus how Title I school (Parkview High School) PLC’s perceive their administrative autonomy and trust.
12
CHAPTER 2: LITERATURE REVIEW
Dufour and Eaker’s (1998) work synthesized previous research on educational collaboration to create a model that advocates for teacher course-a-like teams to have:
decision-making autonomy, weekly time on the schedule to collaborate, and opportunities for on-going/formative professional development. PLC’s are course-a-like teams that usually meet once a week to discuss common curriculum, instruction, assessments and interventions.
My career has given me the opportunity to work in schools that have a
socioeconomically affluent student population, schools that have a high population of students that live in poverty, and schools that have students across the socioeconomic
spectrum. Historically, the general public and media have categorized affluent schools as “high-performing” and schools with a high Title I population as “low-performing” or “failing.” These labels are typically attributed to a school’s corresponding state assessment results, A-G completion rate, and AP participation rate. My experience is that there are high quality teachers at both, and there are poor – low quality teachers at both, but only low-performing schools garner a negative reputation. In addition, low –low-performing schools are less likely to retain and attract high – quality teachers because of the added pressure that normally comes with working at a Title I school, such as program improvement status, more administrative oversight, and less autonomy (Ingersoll, 2003; Cochran –Smith, 2004). On the other hand, affluent schools are less likely to be in program improvement, have less
administrative oversight and are given more autonomy (Ingersoll, 2009). PLC administrative oversight and autonomy in affluent schools and Title I schools are also vastly different. PLC teams in Title I schools are tightly controlled, regulated, monitored, goal oriented, scripted,
13
and without, or little autonomy. The question is, What led to this high degree of accountability and structure?
Evidence exists that tightly controlled PLC’s can help close the achievement gap and increase educational productivity (Dufour, Dufour & Eaker, 2006; Dufour & Dufour, 2015). PLC’s are usually either tightly- controlled (hierarchical) or not controlled at all
(self-organized). Dufour & Eaker’s (1998) recommendation is very prescriptive, hierarchical, and includes department chair/administrative oversight.
The literature review will examined research that analyzed to what degree Professional Learning Communities (PLC’s) have decision-making autonomy & trust to develop their curricular, instructional, assessment decisions – and, what relationship (if any) this has on student achievement. The literature on teacher autonomy and trust will be examined to see how it may relate to PLC autonomy and trust. The literature review will also examine the most current research in the five areas mentioned previously. This is followed by an assessment of the broader implications this research has on issues of social justice and leadership in education.
Legacy of NCLB & Corrective Action
The achievement gap persists nationwide (Bradbury, Corak, Waldfogel, &
Washbrook, 2015; Duncan & Murnane, 2016; Li, 2016). There has been several measures, program, policies, strategies that have had moderate success in closing the achievement gap: growth mind-set, Positive Behavior Intervention and Supports (PBIS), Advancement Via Individual Determination (AVID), Specially Designed Academic Instruction (SDAIE) strategies, Understanding by Design (UbD) lesson and a variety of mentor/intervention
14
programs. None of the measures/strategies has had the educational liquidity to be
implemented as a prescriptive measure to help all schools close the achievement gap. In other words, there is no “one size fits all” measure, program, or policy that is generalizable.
No Child Left Behind (NCLB) mandated a semi-prescriptive approach for school improvement. NCLB was signed into law by President George W. Bush in 2002 with the intent to reauthorize the Elementary and Secondary Education Act (ESEA) of 1965, 1994 with more of an emphasis on assessment and accountability. NCLB measured a schools’ Adequate Yearly Progress (AYP) by evaluating the following four categories: student participation in testing, percentage of students proficient in English Language Arts and Mathematics, academic performance index (API), and high school graduation rate. Schools that did not meet their annual AYP growth goals for all demographic groups had to create and submit improvement plans for their areas of growth. Table 1 explains the difference between API and AYP:
15 Table 1: API vs AYP (California Department of Education, 2012)
API AYP
What is measured? Language Arts, Math Language Arts, Math Science, and Social Studies
Which tests are used?
California Achievement Test California Standards Test California Standards Test California High School Exit
Exam California High School Exit
Exam What is the goal?
A score of at least 800 All students proficient by 2014, The required minimum % proficient increase each year Who is counted?
Total School Total School Total District Total District
Each racial/ethnic group Each racial/ethnic group Economically disadvantaged
students
Economically disadvantaged students
English Learners Special Education students What happens if goals are not
met? Program Improvement
schools School receiving Title funds must offer choice, supplemental that do not show
improvement services and may be restructured or taken over may be sanctioned,
restructured or taken over by state
by the state. Who must be tested? 90% of students (9-12) 95% of students
95% of students (k-8)
Schools that did not meet statistically significant demographic groups for two consecutive years would eventually be labeled as “program improvement” (PI) schools, or districts, as was the case with many of our local schools. Once a school was labeled as a “PI” school, students and parents had to be legally notified that they had the choice to transfer out of the “PI” school at no cost or additional regulation to the parent/student. Schools that did not improve for four or more years (did not meet AYP) were either closed, converted into a charter, taken over by the state, being managed by a private company, identified as a vague
16
“other major restructuring” category, such as reconstitution (Posnick-Goodwin, 2008). Reconstitution is the broad-scale replacement of staff and teachers.
Corrective Action & PLC’s. Schools that were labeled “program improvement” were forced into corrective action measures as prescribed by their corresponding local education agency (LEA) – which usually meant their corresponding school district or county office of education (CDE, 2016). One of the frequently prescribed corrective action measures was PLC training. The work of Bryk (2010) and Noguera (2016) studied the improvement efforts of several low-SES schools across the nation. They identified coherence and
collaboration as key areas to achieve school improvement (Bryk, 2010; Blankstein, Kelly, & Noguera, 2016).
Dufour and Eaker’s (1998) seminal work commercialized, trademarked and branded “Professional Learning Communities” or PLC’s. Dufour and Eaker’s (1998) work
synthesized previous research on educational collaboration to create a model that advocates for teacher course-a-like teams to have: decision-making autonomy, weekly time on the schedule to collaborate, and creates opportunities for on-going/formative professional development. PLC’s are course-a-like teams that usually meet once a week to discuss common curriculum, instruction, assessments and interventions. School District A’s continued designation as a program improvement school district from 2002 -2015 led the district to adopting and subscribing Dufour & Eaker’s (1998) Professional Learning Communities (PLC) model as a form of corrective action that has resulted in little to no “district – wide” increase in student learner outcomes (with the exception of the graduation rate). So why hasn’t the PLC model produced results if evidence exists that tightly controlled PLC’s can help close the achievement gap and increase educational productivity (Dufour,
17
Dufour & Eaker, 2006; Dufour & Dufour, 2015)? Dufour and Eaker would argue that their model has not been followed with fidelity at all the schools in school district A.
PLC Overview and Participation Benefits
This section of the literature review will provide an overview of teacher collaboration under the Professional Learning Community (PLC) model. In particular, the following sub-themes will be addressed: What is a PLC? What are the benefits of PLC participation?
What is a PLC? There is an extensive library of research available on what a Professional Learning Community (PLC) is, and what it is not. Dufour & Eaker’s (1998) describe PLC’s as course-a-like teams that meet once a week to discuss common curriculum, instruction, assessments and interventions. For example, at the high school level, a typical ninth grade PLC team may include 11 ninth grade Biology High School teachers, a
department chair, a guidance counselor, and an administrator. The literature discusses the difference between department team meetings and PLC meetings (Dufour 2004).
Department teams that get together to talk about the logistical aspects of schooling and do not address instruction and student learning are not PLC teams. DuFour (2004) cautions, ‘‘the term has been used so ubiquitously that it is in danger of losing all meaning’’ (p.6). So what are the characteristics of a true PLC? Newmann et al. (1996) describe the five universally accepted characteristics of PLC’s: shared norms and values, collective focus on student learning, engage in reflective dialogue, de-privatize practice, and collaboration (p. 985).
Shared norms and values include the PLC team discussing the following: meeting dates/times, establishing communication protocols, a commitment to respecting each others’ opinion/views, acceptable/unacceptable language, and collective responsibility for the learning of all students. As mentioned previously and by Dufour (2004) a collective focus on
18
teaching and student learning is a key characteristic of a PLC team, discussing things like who is paying for the gallon refill of water or concerns over staff parking are not appropriate for PLC team meetings. Reflective dialogue includes the PLC team having a discussion about a commonly planned lesson and asking the following questions: Did our students meet the instructional objective? How do we know whether or not they met the instructional objective? Which of our students did not meet the instructional objectives? Why or why not?
De-privatizing practice is also a key component of a PLC. A commitment by PLC members to de-privatize practice involves teachers feeling comfortable not only sharing their
ideas/practices, but also empowering other team members to share ideas. Finally, a genuine commitment to collaborating with the PLC involves actively participating in discussions of curriculum, instruction, assessment and interventions (Newmann et al. 1996). Bolam et al. (2005) synthesize these characteristics to define a PLC as a community ‘‘with the capacity to promote and sustain the learning of all professionals in the school community with the collective purpose of enhancing student learning’’ (p. 145).
Benefits of PLC participation. The consensus in the literature that, at minimum, formal teacher collaboration (under the PLC model) has an association with an increase in student achievement and can potentially help close the achievement gap (Dufour & Eaker, 1998; Batten, 2013) will be addressed in depth in the latter portion this literature review. This section will review other residual benefits of teacher collaboration that were revealed by an analysis of arguments for implementation of PLCs, which include increase in teacher inquiry (research), development of teacher leaders, and increase in teacher morale.
Teacher inquiry, as defined by Cochran-Smith & Lytle (1993) is systematic,
19
safe to take risks and by engaging in a reflective dialogue (Dufuor, 2004). Following a typical reflective dialogue such as: “Did students learn the objective of the lesson? Why or why not?” These questions may lead to teachers to engage in creative ways to deliver instruction and assess learning – also known as teacher inquiry.
Historically, teacher leaders have been identified as teachers who take on an extra “leadership” roles typically associated with teaching and learning: athletic coach, club advisor, department chair, union representative, and others. In addition, even when teachers take on leadership roles that are “academic” they usually require the teacher to leave the classroom, such as promotion to administration, instructional coach, teacher on special assignment (TOSA), and others. Dufour & Eaker (1998) argue that the PLC model of collaboration has allowed teacher leaders, who are committed to staying in the classroom to be identified, and most importantly, it has leveraged their expertise to become contagious, or what Dufour (2004) refers as the de-privatization of practice. The PLC model facilitates the emergence of teacher leaders and empowers them to make curricular and professional development decisions. Vescio (2008) refers to this phenomenon as teacher authority: “By teacher authority we mean the ability of teachers to make decisions regarding both the processes of their learning communities and aspects of school governance” (p. 85).
Supovitz’s (2002) work concluded that giving teachers input and the authority to make their own curricular/professional development decisions is crucial to increasing student
achievement.
Several studies indicate that having the time to meet with colleagues during PLC time
increases morale and trust. Morale and trust increase if teachers are given some autonomy and
20
Conversely, if teachers (through their PLC’s) are not heard and do not have a degree of autonomy on school curricular, instructional, and assessment then trust and morale decrease. Fowler’s (2017) work suggests employee morale, motivation and autonomy are related. Her work indicates individuals cannot be motivated without having a sense of agency and
autonomy in the work that they do. She argues that in order to motivate employees,
managers should work on increasing the autonomy, relatedness, and competence (ARC) that they grant to their employees. The more ARC an organization gives its employees, the higher the morale of the organization. In addition, student achievement decreases when morale and trust among teachers decrease (Louis, 2007). Dufour and Eaker (1998) argue that the recommended prescription of PLC norms combined with collaborative administrators would increase morale and trust. The concepts of teacher authority and input are discussed more in the next section.
PLC Participation and Student Achievement
Several studies argue that there is a positive relationship between student achievement and PLC participation (Berry et al., 2005; Bolam et al., 2005; Hollins et al., 2004; Louis & Marks, 1998; Phillips, 2003; Strahan, 2003; Supovitz, 2002; Supovitz & Christman, 2003). More importantly, there is also extensive research that argues that PLC participation helps close the achievement gap. The work of Berry et al. (2005) and Bolam et al. (2005) suggests that underserved populations are more likely to learn in schools that have professional learning communities. The question is how and why does this occur? Research in PLC participation and improving student achievement focuses on three areas: 1. Collective responsibility, 2. Data-driven instruction & intervention, and 3. A focus on instruction.
21
Collective Responsibility. Schools that include teacher voice in policy, curriculum, and professional development are more likely to establish a culture of collective responsibility (Halvorsen, Lee and Andrade, 2008). Lee and Smith (1996) define responsibility as teachers holding themselves accountable for student learning. Lee’s definition counters the age-old paradigm that students are solely responsible for their own learning. In professional learning communities, collective responsibility is a foundational concept that permeates in the culture of a learning community. Evidence of collective responsibility can be found in the language that is used during PLC meetings: when referring to students, all teachers say “our kids” instead saying “my kids.” When members of a PLC buy-in to the culture of collective responsibility, they are more likely to de-privatize and share best-instructional practices, assessments, teach each other, and give constructive feedback (Newmann et al., 1996). Most importantly, when there is collective responsibility there is a high probability of student achievement increasing (Dufour, Dufour & Eaker, 2006; Dufour & Dufour, 2015).
Data – driven instruction & intervention. The use of data to drive instruction and intervention is a crucial reason why PLC participation can increase student achievement and help close the achievement gap. Dufour and Dufour (2015) provide a prescriptive approach to disaggregating common formative assessment data. A common formative assessment is a mutually created, designed, and agreed upon assessment given by members in a PLC. For example, a biology PLC team (consisting of three teachers) creates, designs, and administers an identical assessment on recessive alleles to all fifteen sections of biology during an agreed upon testing window. During the next PLC meeting, all three teachers disaggregate the data by demographic groups collectively. The performance of all fifteen sections is analyzed collectively and individually. All teachers take collective responsibility for the performance
22
of all fifteen sections (not just their five). Areas of strength and growth are discussed and examined. A targeted intervention, remediation, re-teaching and re-assessment plan is created by the PLC for all students.
Interventions are typically tailored to a particular sub-standard that a group of students did not master. For example, if a group of thirty students (among all three teachers- across all fifteen sections) did not master the sub-topic of Punnet squares (sticking with the recessive allele topic), then any of the three Biology teachers can host a review session on Punnet squares before students are re-assessed. The latter can be replicated for underserved populations like English Learners. Any of the three teachers can offer review session that focuses on vocabulary development and reading/writing strategies - pre or post assessment (Dufour, Dufour & Eaker, 2006; Dufour & Dufour, 2015).
The combination of collective responsibility and using data to drive instruction in PLC’s can help increase student achievement and close the achievement gap. However, nothing has a more significant impact on student achievement than effective instruction (Hattie, 2015).
A focus on instruction. PLC participation can organically leverage the instructional expertise of local instructional experts. Vescio (2008) argues: “At its core, the concept of a PLC rests on the premise of improving student learning by improving practice” (p. 84). Research on how PLC participation improves instruction or changes instructional practice is extensive (Dunne, Nave, & Lewis, 2000; Englert & Tarrant, 1995; Hollins, McIntyre, DeBose, Hollins, & Towner, 2004; Louis & Marks, 1998; Strahan, 2003). Most of the work in this area used a mixed-methods approach to examine changes in instructional practice. Instructional practice was analyzed via peer observations, administrative observations and
23
surveys. The findings suggest that PLC lesson studies, PLC peer observations, PLC
professional development and a culture of collective responsibility can yield an increase in universally accepted best instructional practices (Marzano & Pickering, 2013) such as: differentiated instruction, student engagement strategies, student-centered learning, and culturally proficient pedagogy.
School Leadership, Autonomy & Trust
This section will review shared leadership models of transformative and distributive leadership, as well as, the relationship that general teacher autonomy and trust have on PLC autonomy.
When it comes to decision-making associated with school logistics (bell schedule, restrooms, parking, and others) most schools still distribute leadership via the traditional “department chair” model. Similarly, instructional leadership decisions are usually made via PLC leadership teams or instructional leadership teams. Department chairs and PLC leaders are typically democratically elected by members of the PLC or department. PLC leadership team meetings differ from department chair meetings in that the topics of conversation revolve around curriculum, instruction, assessment, intervention and professional development. The degree to which the PLC leadership team influences school-wide instructional/curricular initiatives varies from school to school and from administration to administration. Vescio (2008) argues that one of the foundations of PLC work is that PLC’s feel as if they have a voice in designing and planning their own professional development. The more teachers have input, the more likely they are to take individual and collective responsibility for student learning (Halverson et al, 2008).
24
There is extensive research that examines the positive relationship between school leadership and student achievement (Dumay, Boonen, & Van Damme, 2013; Kelley & Shaw, 2009; Marzano, Water, & McNulty, 2005). According to Leithwood, Louis, Anderson and Wahlstrom (2004) school leadership has the second strongest impact in increasing student achievement behind effective instruction. John Hattie’s (2015) meta – analysis research identified the following instructional leadership traits that have an impact on student
achievement: (1) Believing in evaluating one’s impact as a leader: Effect size .91; (2) Getting
colleagues focused on evaluating their impact: .91; (3) Focusing on high-impact teaching and learning: .84; (4) Being explicit with teachers and students about what success looks like: .77; and (5) Setting appropriate levels of challenge and never retreating to “just do your best”: .57. All of the traits identified by Hattie closely parallel the components of PLC cycle. More importantly, Hattie’s seminal work recognizes the potential impact of strong instructional leadership with collective responsibility of learning: “The high-impact leader creates a school climate in which everybody learns, learning is shared, and critique isn’t just tolerated, but
welcomed” (p.40). If this is the case, how much decision-making autonomy does school
leadership afford PLC’s in affluent area schools versus urban/high-poverty schools? Transformative Leadership. Extensive research has been done in the areas of distributive and transformative leadership that indicates the leaders of schools in
urban/poverty-stricken areas can improve student achievement by adopting a transformative leadership practice (Hallinger, 2003; Sillins, 1994). Transformative leadership, first coined by Burns (1978) for use in political leadership, was adopted and applied to the field of education by Leithwood, Baegley, and Cousins (1994). Leithwood et al. define
25
and/or potential of some phenomenon.” Leithwood (1994) also established the seven characteristics of transformational leaders:
1. Building school vision and establishing goals, 2. Creating a productive school culture,
3. Providing intellectual stimulation, 4. Offering individualized support,
5. Modeling best practices and important values, 6. Demonstrating high-performance expectations, and 7. Developing structures to foster participation.
Leithwood’s seven characteristics of a transformative leader compare quite nicely with Newman et al. (1996) and Dufour & Eaker’s (1998) characteristics of an effective PLC. In particular, characteristics six and seven line up with a focus on student learning, and with collaborative protocols and expectations.
Distributive Leadership. Another leadership model that can be adopted to govern PLC decision-making autonomy is the distributive leadership model. Research suggests there is a positive relationship between distributive leadership and student achievement (Hallinger & Heck, 2009; Leithwood & Mascall, 2008). The distributive leadership model involves delegating decision-making to all stakeholders, working through teams, and promoting collective responsibility (Ritchie &Woods, 2007). Most importantly, the work of Leithwood et al. (2009) suggests one of the differences between high-performing and low-performing schools is that high-performing schools distribute leadership. The latter implies an anticipated finding: high-performing schools afford their teachers more decision-making autonomy. However, Leithwood’s (2009) does address demographic contextual differences. The
26
democratic nature of distributive leadership aligns nicely with the foundational practices of PLC’s (Newmann, 1996; Dufour &Eaker, 1998).
Autonomy and Trust. A variety of key words and combination of phrases were used to examine and review literature related or connected to PLC autonomy: Under – performing schools + PLC’s, Affluent school PLC’s + autonomy, Low –SES school PLC’s + autonomy, PLC independence, PLC autonomy, collaborative autonomy, collaboration + autonomy, collaboration + independence, teacher team independence, teacher independence, teacher autonomy + trust, teacher freedom, teacher autonomy, trust + collaboration, teacher trust in poverty schools, teacher autonomy in poverty schools, and trust + PLC’s. Limited or no research was found that compares the PLC autonomy of Low – SES schools versus the PLC autonomy of affluent schools. In addition, little or no research examines PLC autonomy in any school setting directly. However, after reviewing several related works it became
apparent that teacher trust and general teacher autonomy could be associated with the amount of autonomy a PLC team is afforded.
The vast amount of research on teacher autonomy has produced a variety of
definitions. Pearson and Hall (1993) define teacher autonomy as the perception that teachers have on controlling themselves and their environment. Frase and Sorenson (1992) argue that teacher autonomy is a way for administrators to avoid their duties. Wilner (1990)
differentiates between an older definition of autonomy and a newer one: the old definition of teacher autonomy is based on teacher independence, isolation and alienation, while the new definition of teacher autonomy is based on collaborative decision-making and the freedom to make prescriptive professional choices. Franklin (1988), Fay (1990) and Hanson (1991) all have comparable definitions to Wilners’ (1990) new definition; however, all of them add that
27
teacher autonomy must also include decision-making authority over the “substance” of a school. “Substance” of the school includes authority over the instructional process, the right to implement a set of their own classroom rules, and the right to make flexible decisions in their teams. Farris-Berg & Dirkswager (2012) definition of teacher autonomy includes Wilners’ (1990) collaborative decision-making aspect of the new definition and builds upon
Franklin (1988), Fay (1990) and Hanson’s (1991) authority over the “substance” of the school. Farris-Berg & Dirkswager (2012) argue that teachers have autonomy when they are afforded final decision-making authority, not just input, to areas related to a schools’ success. For example, this would include teachers having final decision-making authority in the
following: selecting colleagues, transferring and/or terminating colleagues, evaluating colleagues, selecting and deselecting leaders, determining budget, determining salaries and benefits, determining learning program and learning materials (curriculum, textbooks, instructional practices, etc.), setting the schedule (length of school-day), bells, and setting of school level policies (Farris-Berg, & Dirkswager, 2012). Finally, Ingersoll (2003; 2009) suggests that teachers in low –SES schools have less teacher autonomy than teachers in affluent area schools. It is important to note that the latest research in teacher autonomy makes an important deviation from teacher independence and instead now associates teacher autonomy to teacher collaborative decision-making. In other words, teacher autonomy is teacher collaborative decision-making authority over policies related to curriculum, instruction, assessment and the school in general.
There are many other residual benefits to teacher autonomy. Pearson & Moomaw (2005) argue that there is an association between teacher autonomy and increased teacher
28
empowerment, job satisfaction and professionalism. In addition, there is a relationship between teacher autonomy and increased trust in the teacher–administrator relationship.
Trust in an educational setting can happen in various relationships: teacher to teacher, teacher to student, teacher to parent, teacher to administrator, administrator to administrator, administrator to parent, staff to teacher, staff to staff, and parent to parent. For the purposes of this review, the relationship(s) between teacher to teacher and teachers to administration will be examined. Zucker (1986) defines trust as the basis for social interaction and as a necessary ingredient for cooperative action. Bryk and Schneider (2003) define relational trust in an educational setting as the product of social interactions that contain respect, personal regard, competence in core responsibilities, and personal integrity. When the four
discernments are met then schools have relational trust, and when there is relational trust, there is an environment that fosters cooperative endeavors (Bryk & Schneider, 2003). Other authors have added facets or subconstructs to relational trust that include: risk,
communication, benevolence, reliability, competence, integrity, openness, and respect (Daly & Chrispeels 2008; Tschannen-Moran & Hoy, 1998). These facets are crucial for the foundation of collaboration, coherence, shared vision and responsibility (Louis, 2004).
Literature in teacher autonomy suggests there is a positive relationship between schools that give their teachers autonomy and an in increase student achievement. Similarly, literature in relational trust notes that there is a positive relationship between institutions with high relational trust and increase in student achievement. Trust and teacher autonomy are foundations for professional learning communities to exist in a school. Yet there is limited evidence that low – SES schools are granted teacher autonomy in their PLC’s or that they are
29
trusted to make collaborative decisions about curriculum, instruction, assessment and interventions.
PLC Structure, Organizational Systems
This section of the literature review will focus on the self-assessment tools to evaluate PLC structure fidelity and will look at how organizations outside of education facilitate and structure collaboration.
PLC Structure. Typical PLC structure follows the sequence recommended by Dufour & Eaker (1998): week 1 -Planning, week 2 -Instruction, week 3 -Curriculum, and week 4 - Intervention. During a planning meeting, it is typical for teams to discuss learning
objectives, essential questions, calendar sequencing, content and common core standards to be covered. Instructional meetings usually revolve around modeling and implementing student engagement strategies, checking for understanding, and reading and writing instructional strategies. Assessment meetings usually discuss the creation and implementation of common assessments. Intervention meetings discuss assessment data results, common interventions, remediation, re-teaching, and lesson redesign for the next time a unit is taught. The examples mentioned bring to life the prescriptive approach recommended by Dufour, however, many self-controlled PLC’s have little to no protocol or oversight.
To address PLC fidelity, Dufour (2006), Schmoker (2006), and Darnell (2015) have designed rubrics and self-assessments to gauge PLC fidelity and implementation. Dufour’s (2006) rubric asks PLC members to self-assess the following areas: overall PLC development, mission, shared vision, shared values, goals, collaborative culture, parent partnerships, action research, continuous improvement, and focus on results. Team members can give themselves the following ratings 1- Pre-initiation, 2- Initiation stage, 3- Developing stage, and 4-
30
Sustaining stage. Schmoker’s (2006) rubric asks PLC members to self-asses in the following areas: reflective dialogue, de-privatization of practice, focus on learning, collaboration, shared norms/values, assessment for learning, openness to improvement, collegial support,
supportive leadership, socialization, regular meeting times, physical proximity,
interdependent teaching roles, communication structures, and teacher empowerment. Team members can give themselves the following ratings: 1- Not at all, 2- In some cases, 3- In many cases, 4- almost always. Darnell’s (2015) rubric asks PLC members to self-asses in the following areas: Expect (purpose, success, support, and high functioning collaborative work); Inspect (study work, and analyze and interpret achievement data); Select (goals, strategies, and plan of action); Act (prepare and implement improvement plan); and Reflect (regarding functioning and progress toward goal). Team members can give themselves the following ratings: 1- yes, 2- not yet.
Schmoker’s (2006) rubric addresses administrative support and teacher autonomy directly: Supportive Leadership: School leadership keeps the school focused on shared purpose, continuous improvement and collaboration. Teacher Empowerment: Teachers have autonomy to make decisions about their work and are encouraged to see themselves as inventive professionals upon whom improvement primarily depends.
Dufour’s rubric (2006) addresses administrative support under the “stage 4- Sustaining stage” column across the collaborative culture row. The rubric describes an effective
administrative relationship with PLCs as one in which: (1) Staff is fully involved in the decision- making processes of the school; (2) Administrators pose questions, delegate authority; (3) Create collaborative decision- making processes; and (4) provide staff with the information, training, and parameters they need to make good decisions.
31
Schmoker’s (2006) rubric is the only one that attempts to directly address decision-making autonomy directly. However, the rubric assesses PLC decision-decision-making autonomy in terms of frequency, not in terms of autonomy. Assessing how frequently PLC’s have the autonomy to make “decisions about their own work” does not gauge how autonomous those decisions are. Furthermore, none of the rubrics takes into account the context of school demographics, student achievement and administrative school leadership. PLC structure fidelity is taken as an absolute value and all of the rubrics (Dufour, 2006; Schmoker, 2006; Darnell, 2015) are used to gauge to what degree PLC’s are following the recommended PLC best practices. The rubrics are not designed to gauge PLC decision-making autonomy, nor are they evaluated in comparison organizational systems (Ticoll, 2004; Scott, 2003).
Graham & Ferriter (2008) developed the most widely utilized PLC self – assessment tool “the 7 seven stages of a PLC.” The tool asks members of a PLC to reflect and self - evaluate to what degree they are following the recommended protocols as prescribed by Solution Tree (Dufour & Eaker, 1998; Dufour, Dufour, Eaker, Many, & Mattos, 2016).
• Stage 1 is described as “Filling in the Time.” In this stage, PLC teams are
unclear what they are supposed to do and why they are meeting. Teams stuck in this stage typically lack norms, an agenda and any structure to their meetings (p. 39).
• Stage 2 is described as “Sharing Personal Practices.” In this stage, PLC
teams begin sharing practices and sequencing. Questions like “What is everyone doing in their class right now?” and “What part of the book is everyone on?” are common for PLC teams in this stage. Teams have difficulty moving beyond this stage because they fail to relate their
32
conversations around student learning, identifying essential standards, sequencing, and coherence (p. 39).
• Stage 3 is described as “The Planning stage.” In this stage, PLC teams
begin to establish common curriculum, lessons, and sequencing. Delegation of responsibilities and a team approach to creating common lessons also happens in this stage. Teams fail to move beyond this stage because they become too comfortable/complacent with the common planning and delegation of responsibilities. The missing piece in this stage is a focus on results, or student learning. While the common planning, sequencing and calibration of lessons should be celebrated – the focus of teams in this stage should be directed to emphasize impact on student learning and creating common assessments (p. 40).
• Stage 4 is described as “Developing Common Assessments.” In this stage,
PLC teams begin to co – create & co – design shared assessments that all agree to administer within a certain time window. Questions like “What should students produce as evidence that they have mastered the content & academic skills associated with this course?” and “What does mastery look – like?” are common for PLC’s in this stage. Teams get stuck in this stage because they skip the foundational/philosophical dialogue that aligns their beliefs about student assessment, or because they cannot come to consensus and actually write a common assessment.
• Stage 5 is described as “Analyzing Student Learning.” In this stage, PLC