Species using Computer Vision
Techniques
J Atanbori
Doctor of Philosophy
AUTOMATIC CLASSIFICATION OF FLYING BIRD SPECIES USING COMPUTER VISION TECHNIQUES
John Atanbori
A thesis submitted in partial fulfilment of the requirements of the University of Lincoln for the degree of Doctor of Philosophy
I declare that no portion of the work contained in this thesis has been submitted in support of an application for a degree or qualification of this or any other university or other institution of learning. All verbatim extracts have been distinguished by quotation marks, and all sources of information have been specifically acknowledged. This research has been documented, in part, within publications listed in Chapter 1 of this thesis.
John Atanbori
Abstract
Bird species are recognised as important biodiversity indicators: they are responsive to changes in sensitive ecosystems, whilst populations-level changes in behaviour are both visible and quantifiable. They are monitored by ecologists to determine factors caus-ing population fluctuation and to help conserve and manage threatened and endangered species. Every five years, the health of bird population found in the UK are reviewed based on data collected from various surveys.
Currently, techniques used in surveying species include manual counting, Bioacous-tics and computer vision. The latter is still under development by researchers. Hitherto, no computer vision technique has fully been deployed in the field for counting species as these techniques use high-quality and detailed images of stationary birds, which make them impractical for deployment in the field, as most species in the field are in-flight and sometimes distant from the cameras field of view. Techniques such as manual and bioa-coustics are the most frequently used but they can also become impractical, particularly when counting densely populated migratory species. Manual techniques are labour inten-sive whilst bioacoustics may be unusable when deployed for species that emit little or no sound.
There is the need for automated systems for identifying species using computer vision and machine learning techniques, specifically for surveying densely populated migratory species. However, currently, most systems are not fully automated and use
only appearance-based features for identification of species. Moreover, in the field,
appearance-based features like colour may fade at a distance whilst motion-based fea-tures will remain discernible. Thus to achieve full automation, existing systems will have
to combine both appearance and motion features. The aim of this thesis is to contribute to this problem by developing computer vision techniques which combine appearance and motion features to robustly classify species, whilst in flight. It is believed that once this is achieved, with additional development, it will be able to support the surveying of species and their behaviour studies.
The first focus of this research was to refine appearance features previously used in other related works for use in automatic classification of species in flight. The bird ap-pearances were described using a group of seven proposed appearance features, which have not previously been used for bird species classification. The proposed features im-proved the classification rate when compared to state-of-the-art systems that were based on appearance features alone (colour features).
The second step was to extract motion features from videos of birds in flight, which were used for automatic classification. The motion of birds was described using a group of six features, which have not previously been used for bird species classification. The proposed motion features, when combined with the appearance features improved classi-fication rates compared with only appearance or motion features.
The classification rates were further improved using feature selection techniques. There was an increase of between 2-6% of correct classification rates across all classifiers, which may be attributable directly to the use of motion features. The only motion features selected are the wing beat frequency and vicinity features irrespective of the method used. This shows how important these groups of features were to species classification. Further analysis also revealed specific improvements in identifying species with similar visual appearance and that using the optimal motion features improve classification accuracy significantly.
We attempt a further improvement in classification accuracy, using majority voting. This was used to aggregate classification results across a set of video sub-sequences, which improved classification rates considerably. The results using the combined features with majority voting outperform those without majority voting by 3% and 6% on the seven species and thirteen classes dataset respectively.
ABSTRACT iv
Finally, a video dataset against which future work can be benchmarked has been collated. This data set enables the evaluation of work against a set of 13 species, en-abling effective evaluation of automated species identification to date and a benchmark for further work in this area of research. The key contribution of this research is that a species classification system was developed, which combines motion and appearance fea-tures and evaluated it against existing appearance-only-based methods. This is not only the first work to combine features in this way but also the first to apply a voting technique to improve classification performance across an entire video sequence.
First of all, I am grateful to the Almighty God for His guidance and protection throughout this research.
I am very grateful to my supervisors Dr. Patrick Dickinson and Dr. Wenting Duan, who have provided inspiring supervision, continued guidance, unconditional support and encouragement throughout this research. I have greatly appreciated their immense wis-dom. I am also grateful to Dr. John Murray for his support and advice when I started this research. This thesis would not be possible without their trust. I have greatly appreciated my colleague, Dr. Kofi Appiah and would like to convey my special thanks to him for his valuable advice on my research.
I am also grateful to my examiners Prof. Bob Fisher and Dr. Bashir Al-Diri for reviewing this work. Their comments and suggestions immensely helped to improve this thesis.
Some special people are not mentioned yet, because they deserve their own part: Edward Shaw, Peter Cowling, Magi and Peter Rayner. I praise the enormous amount of support, ecological input, project guidance and advice provided by Dr. Edward Shaw throughout the past two years. A special acknowledgement goes Magi and Peter Rayner for their valuable time and efforts in editing this thesis.
A very special thanks to Peter Cowling of the Lincolnshire Bat Group. Your initial bat data provided a jump start for this thesis. Sincere thanks to The National Parrot Sanctuary, Lincolnshire, UK, who have enthusiastically supported this work by assisting with the collection of video data of several species used.
ACKNOWLEDGEMENTS vi
of Lincoln. Last but not least, I would like to thank my family (Ivy-Carol, Chaliwen, Wentame and Charles), without their endless support, patience, love and encouragement this thesis simply would not have been possible.
Table of Contents . . . vii
List of Tables . . . xii
List of Figures . . . xvii
1 Introduction 1 1.1 Current Data Collection Techniques . . . 3
1.2 Using Computer Vision to Monitor Bird Species . . . 4
1.3 Aims and Objectives . . . 6
1.4 Challenges . . . 7
1.5 Original Contributions . . . 8
1.6 Publications . . . 9
1.7 Organisation of the Thesis . . . 10
2 Literature Review 13 2.1 Classification of Bird Species using Bio-acoustics . . . 14
2.2 Application of Computer Vision Techniques to Species Classification . . 15
2.2.1 Studies related to Other Species . . . 16
2.2.2 Bird Species Classification using Appearance Features . . . 18
2.2.3 Bird Species Classification using Motion Features . . . 20
2.3 Related Feature Extraction Methods . . . 25
2.3.1 Appearance Features . . . 25
2.3.2 Motion Features . . . 29
CONTENTS viii
2.4.1 Filter Methods . . . 31
2.4.2 Wrapper Methods . . . 35
2.5 Classifying Imbalanced Datasets . . . 37
2.5.1 Resampling Methods . . . 38
2.5.2 Boosting and Bagging Methods . . . 40
2.5.3 Learning Algorithm Modification Methods . . . 42
2.6 Multi-Class classification . . . 43
2.7 Machine Learning Algorithms . . . 44
2.7.1 Support Vector Machines Classifier . . . 45
2.7.2 Naive Bayes Classifier . . . 47
2.7.3 Random Decision Tree Classifier . . . 49
2.7.4 Random Forest Classifier . . . 50
2.7.5 Choice of Classifiers . . . 53
2.7.6 Statistical Significance of Two Classifiers Over K-folds . . . 54
2.8 Brief Overview of a Video Classification System . . . 55
2.9 Summary . . . 60
3 Preliminary Analysis of Wing Beat Frequency 62 3.1 Dataset and Methods . . . 63
3.1.1 Dataset . . . 63
3.1.2 Methods . . . 63
3.2 Experiments . . . 68
3.3 Results . . . 69
3.4 Conclusions . . . 77
4 Classification of Bird Species using Appearance Features 79 4.1 Datasets and Methods . . . 80
4.1.1 Datasets . . . 80
4.1.2 Sample Size Per Category . . . 84
4.1.4 The Statistical Features . . . 88
4.2 Appearance Features Extracted . . . 93
4.2.1 Colour Moments Features . . . 93
4.2.2 Shape Moments Features . . . 94
4.2.3 Grayscale Histogram Features . . . 95
4.2.4 Gabor Wavelet Features . . . 96
4.2.5 Colour Log-Polar Features . . . 97
4.3 Experiments . . . 99
4.4 Results . . . 102
4.4.1 Initial Results Based on the Seven Species Dataset . . . 102
4.4.2 Results Based on the Thirteen Classes Dataset . . . 105
4.4.3 Results Based on Caltech-UCSD Birds-200-2011 Dataset . . . . 110
4.5 Conclusion . . . 111
5 Classification of Bird Species using Motion Features 114 5.1 Datasets, Methods and Preprocessing . . . 115
5.2 Extracting the Motion Features . . . 118
5.2.1 Curvature Scale Space . . . 118
5.2.2 Turn Based Features . . . 121
5.2.3 Wing Beat Frequency Based features . . . 122
5.2.4 Centroid Distance Function (CDF) . . . 124
5.2.5 Vicinity . . . 126
5.2.6 Curvature . . . 129
5.3 Experiments . . . 131
5.4 Results . . . 131
5.4.1 Evaluation of the Motion Feature Set Results . . . 131
5.4.2 Evaluation of the Full Feature Set Results . . . 138
5.4.3 Performance Evaluation . . . 144
CONTENTS x
6 Feature Selection for the Bird Species Problem 148
6.1 Datasets, Methods and Preprocessing . . . 149
6.2 Feature Selection Techniques . . . 150
6.2.1 Classifier-based Feature Selection Method . . . 151
6.2.2 Correlation-based Feature Selection Method . . . 152
6.3 Experimental Setup . . . 155
6.4 Optimal Feature Selection . . . 158
6.5 Discussion of Results . . . 162
6.5.1 Appearance Feature Set Results Revisited . . . 162
6.5.2 Motion Feature Set Results Revisited . . . 164
6.5.3 Combined Feature Set Results Revisited . . . 168
6.5.4 Contribution of the Motion Features . . . 170
6.6 Conclusion . . . 170
7 Improving the Performance of Our Bird Species Classifiers 173 7.1 Dataset and Features Extraction . . . 174
7.2 Majority Voting Experiments . . . 175
7.3 Majority Voting Results . . . 176
7.4 Conclusion . . . 179
8 Conclusions 181 8.1 Main Contributions, Limitations and Future Work . . . 182
8.1.1 Analysis of Wing Beat Frequency . . . 182
8.1.2 Classification using Appearance Features . . . 183
8.1.3 Classification using Appearance and Motion features . . . 185
8.1.4 Classification using the Optimal Feature Set . . . 186
8.1.5 Improving Classification using Other Techniques . . . 186
8.2 Application of this Research . . . 187
Appendix B Motion without Feature Selection 191
Appendix C Combined without Feature Selection 193
Appendix D Appearance Set with Feature Selection 195
Appendix E Motion Set with Feature Selection 197
Appendix F Combined Set with Feature Selection 199
Appendix G Majority Voting Results 201
List of Tables
3.1 Bat wingbeat frequencies in Hz for Sample 1 Part 1 . . . 70
3.2 Bat wingbeat frequencies in Hz for Sample 1 Part 2 . . . 70
3.3 Bat wingbeat frequencies in Hz for Sample 2 . . . 70
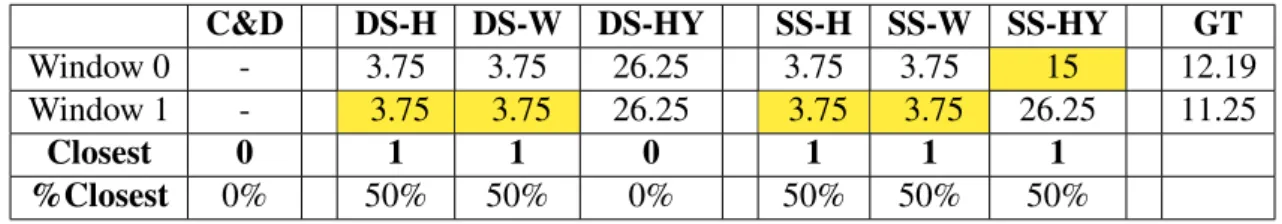
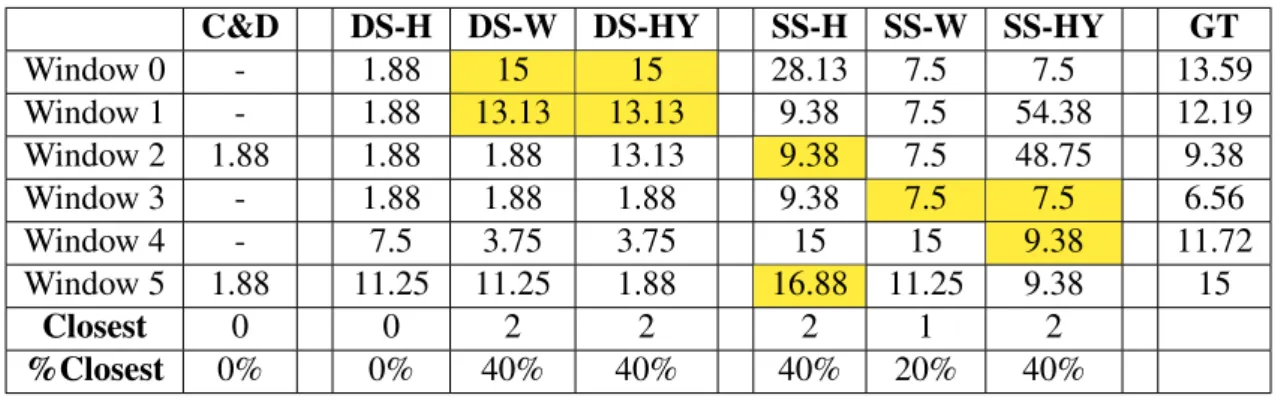
3.4 Bat wingbeat frequencies in Hz for Sample 3. The highlighted values
represents the closest. . . 74
3.5 Bat wingbeat frequency in Hz for Sample 3 using 128 Window size . . . 74
4.1 Table showing the number of videos and images in the seven species dataset 83
4.2 Table showing the number of videos and images in the thirteen classes
dataset . . . 84 4.3 Species used in this thesis, with their distinguishing features. . . 85
4.4 Classification rates based on appearance Feature sets without feature
selection - Dataset #1 . . . 103 4.5 Classification rates based onMarini et al. (2013)’s Featureswithout
fea-ture selection - Dataset #1 . . . 103
4.6 RF classifier’s Confusion matrix usingthe appearance featureswithout
feature selection - Dataset #1 . . . 105
4.7 RF classifier’s Confusion matrix using Marini et al. (2013)’s features
without feature selection - Dataset #1 . . . 106
4.8 Classification rates based on the appearance features without feature
selection - Dataset #2 . . . 107 4.9 Classification rates based onMarini et al.’s featureswithout feature
4.10 RF classifier’s Confusion matrix usingthe appearance featureswithout feature selection - Dataset #2 . . . 109
4.11 RF classifier’s Confusion matrix using Marini et al. (2013)’s features
without feature selection - Dataset #2 . . . 109 4.12 Results of the appearance features versus Marini et al. (2013)’s on
Caltech-UCSD Birds-200-2011 Dataset . . . 111
5.1 Table showing the number of videos and images in the thirteen classes
dataset when features are combined . . . 116 5.2 The correct classification rates based onthe motion featureswithout
fea-ture selection - Dataset #2. . . 133
5.3 RF classifier’s Confusion matrix usingthe motion featureswithout
fea-ture selection - Dataset #2 . . . 133
5.4 Table showing the number of videos and images for four randomly
under-sampled datasets . . . 136 5.5 The correct classification rates based onthe motion featureswithout
fea-ture selection - Re-sampled Dataset #2. . . 137
5.6 RF classifier’s Confusion matrix usingthe motion featureswithout
fea-ture selection - Re-sampled Dataset #2 . . . 138
5.7 The correct classification rates based onthe combined featureswithout
feature selection - Dataset #2 . . . 139
5.8 RF classifier’s Confusion matrix using the combined features without
feature selection - Dataset #2 . . . 141
5.9 The correct classification rates based onthe combined featureswithout
feature selection - Re-sampled Dataset #2. . . 142
5.10 RF classifier’s Confusion matrix using the combined features without
feature selection - Re-sampled Dataset #2 . . . 143 5.11 Classifiers training times in seconds. . . 144 5.12 Classification times for 1,500 birds in seconds and the estimated
LIST OFTABLES xiv
6.1 Example correlation matrix calculated with sample features from dataset
#2. . . 155 6.2 A Best First search using the correlations in 6.1. . . 156
6.3 The number of features remaining in each feature group before and after
applying feature selection . . . 161
6.4 Summary of species correct classification rates based onthe appearance
featuresafter the correlation-based feature selection - Dataset #2. . . 163
6.5 The confusion matrix based on Random Forest classifier with the
se-lected appearance features (49 features) . . . 164 6.6 Summary of species correct classification rates based onthe motion
fea-turesafter the correlation-based feature selection - Dataset #2 . . . 165
6.7 The confusion matrix based on the Random Forest classifier with the
selected motion features (21 features) . . . 166
6.8 The confusion matrix based on the Random Forest classifier with the
se-lected motion features (12 features) . . . 167
6.9 Summary of species correct classification rates based onthe combined
featuresafter the correlation-based feature selection - Dataset #2 . . . 168
6.10 The confusion matrix based on the Random Forest classifier with the
selected combined features (top 70 features). . . 169
7.1 Classification results with and without majority voting based on optimally selected features . . . 177
7.2 The confusion matrix of video classification based on theRandom Forest
classifier with theselected optimal combined features (70 features) . . 179
A.1 NB classifier’s Confusion matrix usingthe appearance featureswithout
feature selection - Dataset #2 . . . 189
A.2 RT classifier’s Confusion matrix usingthe appearance featureswithout
A.3 SVM classifier’s Confusion matrix usingthe appearance features with-out feature selection - Dataset #2 . . . 190
B.1 SVM classifier’s Confusion matrix using the motion features without
feature selection - Dataset #2 . . . 191
B.2 RT classifier’s Confusion matrix usingthe motion featureswithout
fea-ture selection - Dataset #2 . . . 191
B.3 NB classifier’s Confusion matrix usingthe motion featureswithout
fea-ture selection - Dataset #2 . . . 192
C.1 NB classifier’s Confusion matrix using the combined features without
feature selection - Dataset #2 . . . 193
C.2 RT classifier’s Confusion matrix using the combined features without
feature selection - Dataset #2 . . . 193
C.3 SVM classifier’s Confusion matrix usingthe combined featureswithout
feature selection - Dataset #2 . . . 194
D.1 RT classifier’s Confusion matrix using the selected features from the
appearance set- Dataset #2 . . . 195
D.2 NB classifier’s Confusion matrix using the selected features from the
appearance set- Dataset #2 . . . 195
D.3 SVM classifier’s Confusion matrix usingthe selected features from the
appearance set- Dataset #2 . . . 196
E.1 RT classifier’s Confusion matrix using the selected features from the
motion set- Dataset #2 . . . 197
E.2 SVM classifier’s Confusion matrix usingthe selected features from the
motion set- Dataset #2 . . . 197
E.3 NB classifier’s Confusion matrix using the selected features from the
LIST OFTABLES xvi
F.1 RT classifier’s Confusion matrix using the selected features from the
combined set- Dataset #2 . . . 199
F.2 SVM classifier’s Confusion matrix usingthe selected features from the
combined set- Dataset #2 . . . 199
F.3 NB classifier’s Confusion matrix using the selected features from the
combined set- Dataset #2 . . . 200 G.1 Confusion matrix of video classification using our Inflight #2 Dataset with
Naive Bayes Classifier . . . 201 G.2 Confusion matrix of video classification using our Inflight #2 Dataset with
SVM Classifier. . . 201 G.3 Confusion matrix of video classification using our Inflight #2 Dataset with
Random Tree Classifier . . . 202 H.1 Wilcoxon’s sign rank test based on 10 times 5-fold cross validation. This
result is based on dataset #2 using the appearance feature set without fea-ture selection. . . 204 H.2 Wilcoxon’s sign rank test based on 10 times 5-fold cross validation. This
result is based on dataset #2 using the motion feature set without feature selection. . . 205 H.3 Wilcoxon’s sign rank test based on 10 times 5-fold cross validation. This
result is based on dataset #2 using the combined feature set without fea-ture selection. . . 206
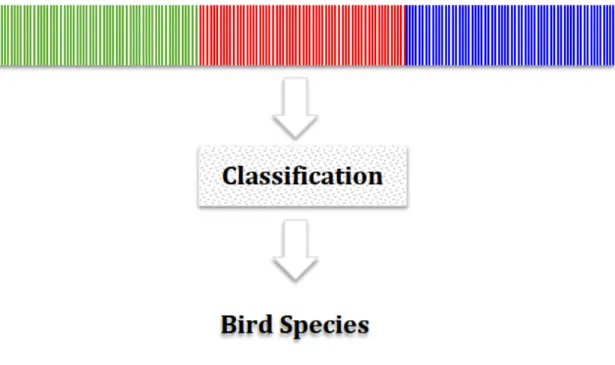
2.1 Classification scheme based on the concatenation of the three color space histogram features . . . 26
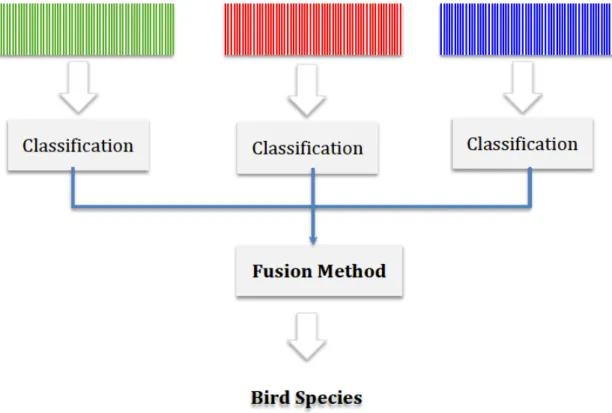
2.2 Classification scheme based on combination of classifiers outputs from
the three colour space separately . . . 27
2.3 SVM - Linear separating hyperplanes for the separable case . . . 46
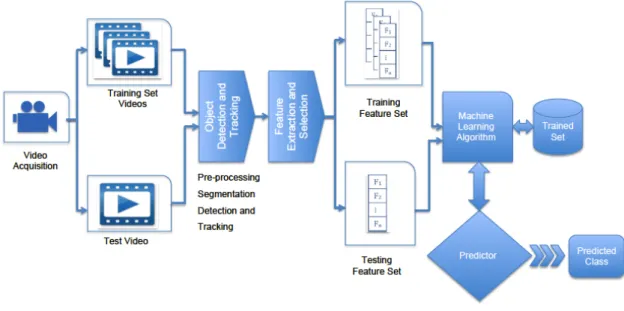
2.4 Overview of a video framework for classifying species . . . 56
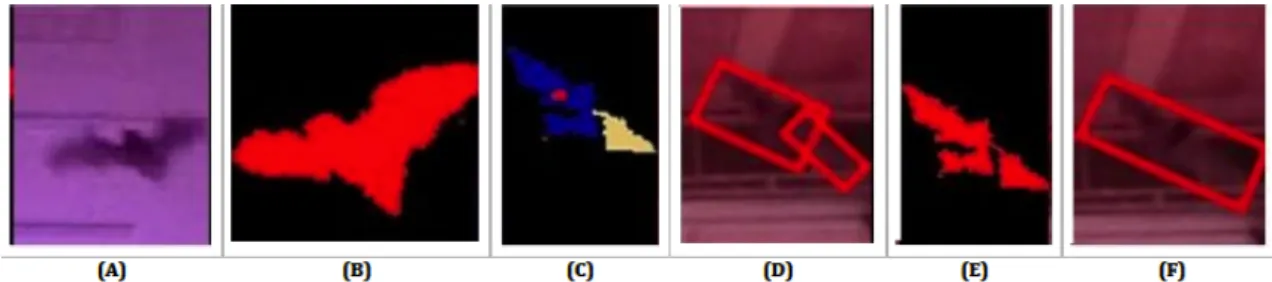
3.1 Foreground images of bats segmented using improved GMM Zivkovic
and van der Heijden (2006). . . 65
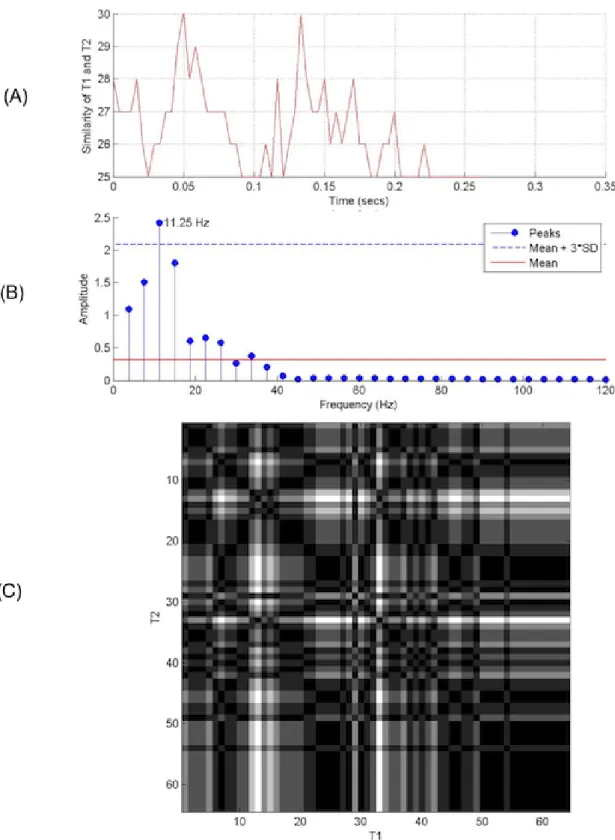
3.2 The original signal, FFT stem plot showing the peak frequencies and
Re-constructed signals from these peaks . . . 67 3.3 The similarity table of the synthetic signal (left) and the similarity plot
(right) . . . 68
3.4 The baseline algorithm’s FFT stem plot for Window 10 . . . 71
3.5 The siginal plot, stem plot and similarity plot for window 2 using the
proposed method . . . 72 3.6 The siginal plot, stem plot and similarity plot for window 2 using Cutler
and Davis (2000)’s method . . . 73
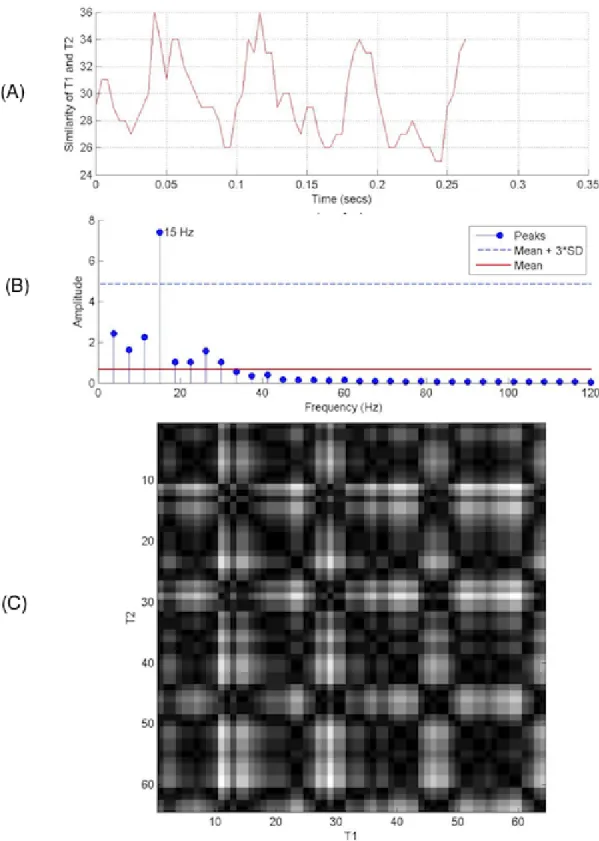
3.7 The siginal plot, stem plot and similarity plot for window 6 using the
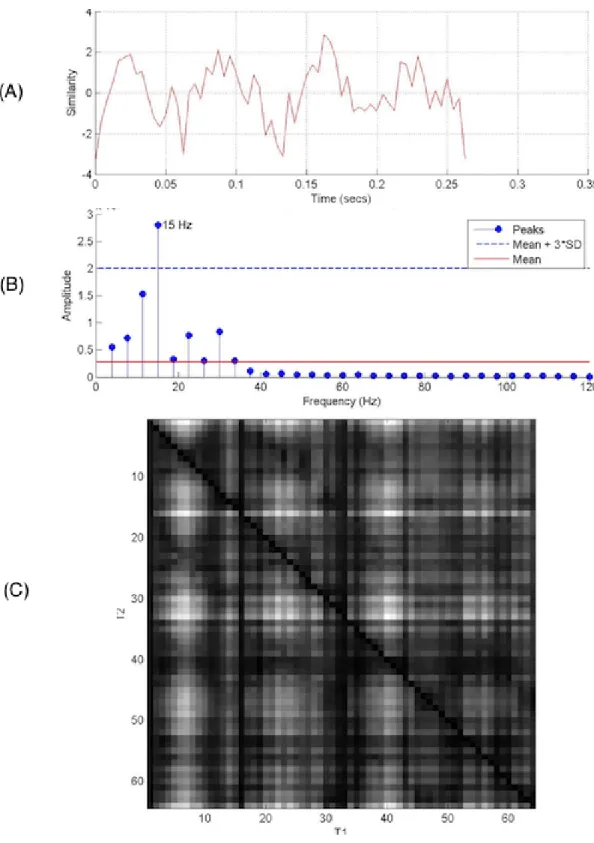
proposed method . . . 75 3.8 The siginal plot, stem plot and similarity plot for window 6 using Cutler
LIST OFFIGURES xviii
4.1 Segmented birds from the dataset #1 . . . 81
4.2 Samples from the dataset of thirteen classes . . . 86
4.3 Sample images taken from the Caltech-UCSD Birds-200-2011 dataset . . 87
4.4 Sample size per category against classification rate (%) . . . 87
4.5 Segmented birds from dataset #2 . . . 88
4.6 Figure showing the original image of a Nanday Parakeet in RGB, the three HSV channels from the original and their histograms in the form of stem plots . . . 94
4.7 Figure showing the original image of a Cockatiel in RGB, the three HSV
channels from the original and their histograms in the form of stem plots . 95
4.8 Hu Moments plots of a segmented Nanday Parakeet . . . 96
4.9 Figure showing the original image of a Cockatiel in RGB, the grayscale
version of the original and it’s histogram . . . 97
4.10 Figure showing the original image of a Cockatiel in RGB, the grayscale version of the original and it’s histogram . . . 98
4.11 Gabor filter features for four orientations. . . 99
4.12 Colour log-polar features obtained by extracting hue, saturation and value log-polars . . . 99
4.13 A sample five-fold cross-validation assuming the thirteen class dataset was used . . . 101
4.14 Segmented Wood Pigeons contaminated with green background. . . 106
5.1 Figure (a) and (b) are sample flight trajectories of Alexandrine Parakeet with (e) and (f) being their corresponding CSS images. Figure (c) and (d) are sample flight trajectories of Nanday Parakeet with (g) and (h) being their corresponding CSS images. Figure (i) and (j) are sample flight tra-jectories of Common starling with (m) and (n) being their corresponding CSS images. Figure (k) and (l) are sample flight trajectories of Budgerigar (wild-type) with (o) and (p) being their corresponding CSS images. The vertical axis of all CSS plots ranges fromσ =1 (top) toσ =13 (bottom) 121
5.2 Figure showing how the slopeθk is measured given the two pointPk and Pk+1. . . 123
5.3 Figure the top nine frequencies in order of magnitude, with the largest first. 125 5.4 Figure of the three points vicinity enclosed by a bounding box. . . 128
5.5 Figure showing how the curvatureθk is measured given the predecessor
and successor points of pointPk. . . 129 5.6 Fine-grained species from dataset #2 . . . 135 5.7 Sample tracks of fine-grained species from dataset #2 . . . 135 6.1 Plot of correct classification rates vs. number of features for the four
standard classifiers when classifier-based selection is applied . . . 159 6.2 Plot of correct classification rates vs. number of features for the four
Chapter 1
Introduction
Bird species are recognised as important biodiversity indicators (Gregory, 2006; Harrison et al., 2014; Buckland et al., 2012): they are responsive to changes in sensitive ecosys-tems, whilst population-level changes in behaviour are both visible and quantifiable. They can be monitored by ecologists to determine factors causing population fluctuation and to help conserve and manage threatened and endangered species. For example, a study by Mikusi´nski et al. (2001) has shown that where Woodpecker (Picidae) species are present there are also other species present. The research therefore suggested that surveying the number of Woodpeckers can serve a proxy for avian diversity if the overall species di-versity in the forest is unknown. Also, a study of butterfly and bird species (Blair, 1999) showed that occurrence of the two were correlated, that is, the number of birds in a partic-ular area could also indicate the likely presence of butterflies. Data about bird populations is therefore an important tool for ecologists in a wide range of environments and contexts, including farmland use, marine settings, and migration behaviour (Hammers et al., 2014; Johnston et al., 2014; Goodenough et al., 2014).
There are a number of regular surveys conducted in the UK which provide data (Baillie et al., 2014; Robinson et al., 2015) used by the government and other organisa-tions to track trends in bird breeding and migration data. This helps to measure progress towards international targets set by the Convention on Biological Diversity in 2010, (Gre-gory et al., 2015). The monitoring of bird species is also a statutory requirement governed by the Wildlife and Countryside Act 1981, the European Union Birds Directive, and the
Ramsar, Bonn and Berne Conventions (Gregory et al., 2000).
These surveys have previously included the Common Birds Census and Nest Record Scheme, which were organised annually by the Joint Nature Conservation Committee (JNCC) and attracted more than 2500 volunteers. These were succeeded in 2001 by the Breeding Bird Survey which is organised jointly by the British Trust for Ornothology (BTO), JNCC and Royal Society for the Protection of Birds (RSPB). This current scheme has over 2,800 volunteers contributing to it anually. The Wetland Bird Survey is also carried out by volunteers at more than 2,200 wetland sites, at monthly intervals, and provides additional information on wintering population trends in species of water birds including ducks, geese, swans, waders, grebes, rails and cormorants (Robinson et al., 2015). Finally the Big Garden Birdwatch attracts well over 312,000 volunteers annually, spotting over 6,295,000 individual birds throughout the year.
All of these surveys provide data, collected by volunteer and staff workers, using manual techniques. However, manual techniques are labour intensive and error-prone. For example in 2015, the BTO reported that"The first Breeding Bird Survey (BBS) volunteers, who surveyed their squares 20 years ago, would have counted twice as many migratory cuckoos and whinchats as they do today."(Hayhow et al., 2014). This was due to the fact that flocks often contain several species and could be very difficult to count by volunteers manually. Another important issue relates to protected bird species (including Barn Owl (Tyto alba), Kingfisher (Alcedines) and Little Tern (Sternula albifrons)), which by law require a handling licence: this places further constraints on monitoring activities and techniques, which are particularly important in these cases as protected species are already in decline.
Every five years, the health of the bird population found in the UK is reviewed by the BTO, based on data gathered about bird populations from these surveys: this has been a key function of the BTO since its formation in 1933 (Robinson et al., 2015). Species are categorised using three lists (Red, Amber and Green), which indicate the strength of their populations, nationally. The last review report (Eaton et al., 2015) included reviews of a total of 244 species, with 20 moving onto the red list and only three leaving it.
1.1. CURRENTDATA COLLECTIONTECHNIQUES 3
Bird species are therefore established as important indicators of national (and global) biodiversity and enviornmental conservation, and a considerable amount of effort is spent in gathering processing data about their populations. However, data collection techniques remain largely dependent on traditional manual observation methods, which is a limiting factor. The work presented in this thesis aims to contribute new technological methods of addressing these limitations.
1.1
Current Data Collection Techniques
A number of more technologically advanced techniques are sometimes used to survey bird species, which includes bioacoustics counting (Lopes et al., 2011; Briggs et al., 2012; Tan et al., 2015; Silla et al., 2013; Joly et al., 2014; Evans and Rosenberg, 2000), Radar for detecting migratory flocks (Gregory et al., 2004), trapping using mist nets (Gregory et al., 2004), and thermal imagery (Matzner et al., 2015; Betke et al., 2008; Ammerman et al., 2009; Hristov et al., 2010; Cullinan et al., 2015).
Bioacoustic methods use specialised equipment such as infrasound, detectors of ul-trasound or laser vibrometer to capture and model the sounds of different bird species. The captured sounds are then processed using signal processing, data mining and ma-chine learning techniques for classification. The disadvantages of these technique are that:
• specialised skills are required to operate expensive equipment.
• some bird species emit little or no sound, and thus monitoring them using these
techniques may become impractical.
• Signals are often noisy and difficult to differentiate. For example mixed-species foraging flock, which may consist of Blue, Great, Coal and Long-tailed Tits, Nuthatches, Goldcrests, Tree Creepers and Lesser Spotted Woodpecker.
Radar is another technology which has been used to estimate size of flocks, their flight direction, speed and wing beat frequencies (Gregory et al., 2004). It makes use of expensive equipment, which is unavailable to most researchers. Bird detection with radar
is also challenging due to noise from electronic components of the radar system (Cullinan et al., 2015), and, in any case, skilled personnel are required to operate these systems.
Thermal imaging technologies have also been used to survey birds (Matzner et al., 2015; Cullinan et al., 2015). The use of thermal imaging to detect species may be limited by excessive humidity which affects the clarity of the image, distance from the camera, field of view and physical obstruction (Cullinan et al., 2015). Even though thermal cam-eras have generally lower resolution than optical, they are suitable for both day and night recordings but are again very expensive. In addition, many features used for species clas-sification are not apparent using thermal imaging.
1.2
Using Computer Vision to Monitor Bird Species
The use of computer vision techniques to automatically identify, classify and monitor bird species in the field is an emerging area of research. Currently, most work in this area focuses on the identification of species from a single image (Marini et al., 2013; Wah et al., 2011a; Duan et al., 2012; Berg and Belhumeur, 2013; Huang et al., 2013; Branson et al., 2014; Wah et al., 2011b; Berg et al., 2014), using features extracted from that image which represent the appearance of the bird, such as colour and shape. Datasets for these works are based on high-quality and detailed images or stationary birds. However, in the field, images taken by biologists, ecologists or camera traps may not be of comparable quality, placing some practical limitations on such approaches in the field.
These type of approaches can be further subdivided into those that make use of infor-mation about the physical structure of individual birds (which is refer to as "part-based") and those which do not. Non part-based methods use colour and shape features of the bird as a whole to classify its species (Marini et al., 2013; Wah et al., 2011a,b). For example the work in Marini et al. (2013) used colour features extracted from the bird to build a Support Vector Machine (SVM) species classifier. Most of these works have been used to classify between relatively small numbers of species but struggle to maintain pefor-mance as the number of species increases. Marini et al. show that in classifying species using colour features alone on the caltech-ucsd birds-200-2011 Dataset, accuracy reduces
1.2. USINGCOMPUTERVISION TOMONITOR BIRD SPECIES 5
from approximately 85% when selecting between 2 species to 20% when differentiating between 17 species, and just 7% accuracy with 200 species.
Part-based methods use features associated with the various parts of the bird, based on colour and/or shape (Wah et al., 2011a; Duan et al., 2012; Berg and Belhumeur, 2013; Huang et al., 2013; Branson et al., 2014; Wah et al., 2011b; Berg et al., 2014). This approach uses prior-knowledge of the birds appearance and can help differentiate between species with high visual correlation. For Example Collared and Turtle Dove (Streptopelia decaoctoandStreptopelia turtur) are species with distinguishing features around the neck and the eyes: Turtle Doves have a black and white striped neck patch, and a bold red eye ring, which are not visible on Collared Doves. Other notable examples are warblers and vireos, which have distictive wing markings, compared with flycatchers and sparrows which have no such markings (Podulka et al., 2004). In such species these methods have achieved good classification accuracy but do require some manual inputs (so are not fully automated) and good-quality images in which all parts are present. Typically the manual inputs are annotations which identify the bird’s parts prior to feature extraction, and this is time consuming and labour intensive, placing some practical limits on the amount of data which can be processed. Gavves et al. (2013) introduced some improvments in the form of automatic parts identification, however their system still requires some manual input being dependent on the grab cut method (Rother et al., 2004a). Techniques based on parts are also less applicable to classificastion of flying birds, which have less well-defined object shapes and in which specific parts (e.g. feet) are typicaly obscured from view.
Flight patterns are known to vary across different species of birds (Briggs et al., 2012). For example woodpeckers generally fly in patterns of moderate rises and falls whereas finches exhibit a steep, roller-coaster flight (Podulka et al., 2004). Flight patterns can sometimes help bird watchers distinguish species with similar colour and shape, for
example Common Raven (Corvus corax) and the American Crow (Corvus
brachyrhyn-chos) (Kilham, 1990). Characteristic flight patterns are particularly helpful to human observers and aid the identification of bird species in flight, especially at distances where
colour tends to attenuate and shape features are too small to distinguish.
As mentioned, existing computer vision based approaches to automated species clas-sification focus on single image inputs and appearance features. The automated classifica-tion of birds in flight has remained largely un-studied, due to problems with image quality and extraction of appearance features. However, the use of video instead of single images presents the opportunity to use motion features. Very little existing work has considered this, and the primary objective of this research is to combine motion features with appear-ance features to provide robust automated classification of birds in flight: a technology which would be immensely useful for deployment in the field. The only existing com-parable works are those presented by Duberstein et al. (2012) which address only broad categorisation (bats, swallows, terns and gulls) and use thermal sensors and also work by Matzner et al. (2015). However, both these works are very limited in that the number of species/categories, the data sets are small, and the species used in the experiment have obviously very different flight patterns. The objective is to build on these preliminaty studies to develop a method which can be used robustly with larger numbers of species and give similar or better results as methods which use single high-quality images.
This thesis presents work which combines motion and an extended set of appearance features to automatically classify birds in flight from video streams. The research shows that robust results across larger numbers of species is possible and that motion and ap-pearance features can be combined effectively to achieve this, providing a robust platform for deployment in the field.
1.3
Aims and Objectives
As mentioned in the last section, the aim of the work presented in this thesis is to develop computer vision techniques which combine appearance and motion features to robustly classify a bird’s species, whilst in flight. More specifically:
Objectives
1.4. CHALLENGES 7
use in automatic classification of species in flight.
• To identify relevant motion features which can be extracted from video of birds in flight and used to classify them automatically.
• To effectively combine appearance and motion features and evaluate whether this
combination gives better results than appearance or motion features alone.
• To eliminate redundant and irrelevant features from this aggregated feature set, to determine if recognition can be further improved.
• To establish a video data set of birds in flight for use by the research community.
• To investigate the further refinement of this technique, using majority voting to aggregate classification results across a set of video sub-sequences.
1.4
Challenges
There are a number of important challenges inherent in these objectives. Specifically:
• Identification of a suitable set of appearance features: Most existing works have used appearance-based features in conjunction with single images of static birds. This research develops an anlogous set of appearance features for use with birds while in flight. Whilst existing works are a useful starting point, such as those used by Marini et al. (2013), there is no comparable work for in-flight birds.
• Identification of suitable motion features: Even though these have been explored for the classification of fish trajectory (Beyan, 2015; Wang et al., 2015) and human motion identification (Cutler and Davis, 2000; Ayyildiz and Conrad, 2011), there is no significant work which considers bird species. The identification of a suitbale set of motion features is an open question and there represents a significant challenge.
• Development of a framework to combine motion and appearance features: Motion
features are extracted from a sequence of image frames while appearance features are extracted from individual images. Determining an effective way to combine them for classification is challenging in the absence of comparable exisitng work.
• Identification of which features (motion and appearance) are most effective: This research starts by combining all potentially useful appearnce and motion features, resulting in a large feature set. Determining how best to reduce and optimise this feature set presented a significant challenge.
• Segmentation of birds in flight: motion features are extracted by fitting a bounded box to a detected bird in flight, based on the bird’s silhouette. Sudden light changes and low video resolution directly affect the motion feature extracted to form the trajectories.
• Collection of an effective dataset: There is no pre-existing standard data set of birds in flight, on which to test the algorithms and methods developed in this research. It has been determined that high frame-rate video would be most useful for extracting motion features and consequently needed to developed data set for this research. It is challenging to find suitable locations to film different species, and produce an effective data set with which to work.
1.5
Original Contributions
The work presented in this thesis makes the following original contributions to this field of research:
1. The development of algorithms for the measurement of wing beat frequencies using Fast Fourier Transform (FFT) which have been evaluated initially on bat species and then on bird species. The techniques used in this research were evaluated with the state-of-the-art, Cutler and Davis (2000) and the results show that they performed significantly better.
2. The development of a new set of appearance features which show improved correct classification rate over the state-of-the-art proposed by Marini et al. (2013) on the dataset of birds in flight. The appearance features outperform Marini et. al. by between 6% and 14% across various datasets.
1.6. PUBLICATIONS 9
3. The development of a species classification scheme which combines motion and appearance features and evaluation of it against existing appearance-only-based methods. This is the first work to combine features in this way. A correct clas-sification rate of 85% was achieved which outperforms the exisiting state of art method (Marini et al. (2013)).
4. Feature reduction techniques were further used to improve classification rate on the combined features and demonstrated the relative importance of motion features within this reduced set. Two feature reduction techniques were evaluated against the full feature set, which have shown approximately a 4% increase in performance.
5. A voting technique was used to improve classification performance across an entire video sequence. This has increased classification rate to between 89% and 98%.
6. A video data set was collated against which future work can be benchmarked. This data set enables the evaluation of the work against a set of 13 species, enabling effective evaluation of automated species identification to date and a benchmark for further work in the field of research.
1.6
Publications
Some of the work described in this thesis has been previously presented in journals and conference papers. Below is a complete list of publications arising from this PhD study so far.
Journal Paper
1. Atanbori, J., Duan, W., Murray, J., Appiah, K., & Dickinson, P. (2016). Auto-matic classification of flying bird species using computer vision techniques. Pattern
Recognition Letters, ISSN: 0167-8655, DOI: http://dx.doi.org/10.1016/j.patrec.2015.08.015. Volume 81, Pages 53-62.
Conference Papers
1. Atanbori J, Cowling P, Murray J, Colston B, Eady P, Hughes D, Nixon I & Dick-inson P. (2013, January). Analysis of bat wing beat frequency using Fourier trans-form. In Computer Analysis of Images and Patterns(pp. 370-377). Springer Berlin Heidelberg.
2. John Atanbori, Wenting Duan, John Murray, Kofi Appiah and Patrick Dickinson.
A Computer Vision Approach to Classification of Birds in Flight from Video Se-quences. In T. Amaral, S. Matthews, T. Plotz, S. McKenna, and R. Fisher, editors,
Proceedings of the Machine Vision of Animals and their Behaviour (MVAB), pages 3.1-3.9. BMVA Press, September 2015.
1.7
Organisation of the Thesis
The remainder of this thesis is structured as follows:
Chapter 2 gives a comprehensive overview and comparison of existing works in the area of automated systems for species classification. This not only includes bird species but also other animal species that have been studied using computer vision techniques. An evaluation of literature based on species identification and classification using bioa-coustics, appearance, and motion features was also presented. Finally, literature on other relevant work in the area of feature selection, evaluation using imbalanced datasets, ma-chine learning and classification techniques were presented.
Chapter 3 presents initial work on extraction of motion features. For this first study video data of bats collected from bat roosts rather than birds were initially used. Bats were initially used for this study partly because the data was readily available but also because bat motion is of a higher frequency and so is more challenging for analysis. The chapter also presents a discussion of low-level image processing techniques for dealing with low-light video data of bats and bird species. A number of techniques were intro-duced for the analysis of bat wing beat frequency and the results from this methods were
1.7. ORGANISATION OF THETHESIS 11
evaluated with state-of-the-art method by Cutler and Davis (2000).
Chapter 4 presents work on the classification of bird species in flight, using only appearance features. In this chapter the dataset used in all evaluations were detailed and statistical features that were used to represent the feature sets used in this research were introduced. The work presented here uses a rich set of appearance features with standard classifiers (Naive Bayes, Support Vector Machine, Random Decision Trees and Random Forest) to classify species. Three datasets (The seven species (Dataset #1), The thirteen classes (Dataset #2) and caltech-ucsd birds-200-2011 Dataset) were used to evaluate the work presented in this chapter. The results from the appearance features presented in this chapter compares favourably with exiting state-of-the-art image-based classifiers used in the work by Marini et al. (2013). This out performs the state-of-the-art (Marini et al., 2013) on all 3 datasets: 9% on caltech-ucsd birds-200-2011, 6% on Dataset #1 and 9% on Dataset #2.
Chapter 5 presents the work on fusing appearance and motion features. A rich set of motion features were used with the appearance features from chapter 4 with standard classifiers (Naive Bayes, Support Vector Machine, Random Decision Trees and Random Forest) to classify bird species. Dataset #2 was used to evaluate the work presented in this chapter. Using only motion features for classification, a classification accuracy of 38% was achieved. Fusing these features with the appearance features in this chapter, a classification accuracy of 85% was achieved. The result was compared with that of using only appearance features, and an initial slight reduction in classification accuracy by ap-proximately 1% was reported, thus, motivating the work in the following chapter.
In Chapter 6 the results of work on feature selection was presented. Combining ap-pearance and motion features in Chapter 5 resulted in a large set of features, which slightly degraded performance. To improve classification, feature selection techniques were ap-plied to remove redundant features. The most important features were identified using
correlation and classifier based feature selection techniques. These were used to clas-sify species using the Dataset #2 with the four standard classifiers (Naive Bayes, Support Vector Machine, Random Decision Trees and Random Forest) and a correct classification accuracy of 89% was attained, which is approximately 4% better than that in Chapter 5. A further experiment was performed to determine the contribution of the selected mo-tion features to overall performance. The conclusion was that the momo-tion features used together with appearance improves classification by approximately 4% across all four standard classifiers.
In Chapter 7, further improvement in the correct classification rates was attempted. The work in chapters 4 - 6 present results based on classification using single frames and subsets of video. This was extended to combine the results of several frames from a sequence using majority voting. It has been established that combining the outputs of several classifications result in a better overall accuracy (Bhattacharya and Chaudhuri, 2003). This is because different classifications can capture different aspects of the input data, while one alone will not usually represent all. The work presented here uses the results in Chapter 6 with majority voting and the four standard classifiers (Naive Bayes, Support Vector Machine, Random Decision Trees and Random Forest) to classify bird species. The datasets used included that with the seven species and the extended thirteen classes dataset.
Finally, Chapter 8 discusses the results and the contributions and limitations of this thesis and outlines future works.
Chapter 2
Literature Review
The previous chapter mentioned the importance of monitoring bird species. In particular, it was discovered that ecologists monitor them to determine the factors causing population fluctuation and to help in conserving and managing threatened and endangered species. The various surveys used in counting bird species including data collection techniques were succinctly reviewed. It was established that a small but growing number of re-searchers have studied the use of computer vision for monitoring species, particularly for counting bat species.
This chapter evaluates reports of studies found in literature that are related to mon-itoring and classification of species. In particular, it focuses on reviewing birds, fish and bats works: techniques used for these species are often similar, and motion features which this research seeks to investigate for classification of birds have been used for both bats and fish. First techniques which perform classification using single images were explored. This was done by reviewing them separately as those that are used for classification of bird species and those for other species, specifically, bats and fish.
The work based on bird species was then splitted into two sections: part-free and part-based models. Feature selection and machine learning techniques, relevant to the classification of these species were separately reviewed. Finally, a brief overview of video classification system using computer vision techniques was presented. This chapter is structured into the following sections:
• The classification of species using computer vision techniques were reviewed in Section 2.2, by first looking at literature related to bat and fish species classification and monitoring, and finally, those related to bird species.
• Section 2.4 and 2.5, review feature selection and reduction methods and imbalanced datasets techniques respectively.
• Finally, machine learning algorithms for classification were reviewed in Section 2.7 and an overview of the video classification system in Section 2.8
2.1
Classification of Bird Species using Bio-acoustics
A number of existing attempts to automate the identification of birds have used audio rather than visual signals, such as Briggs et al. (2012); Neal et al. (2011); Bardeli et al. (2010). In particular, Briggs et al. classified 413 birds songs, each of 30 seconds, using FFT and Nearest Neighbour (NN) classifiers. This achieved a remarkable result (92%), which was due to the Fast Fourier Transforms (FFT) used, filtering out most of the noise in the signal. Neal et al. also proposed a supervised time-frequency audio segmentation to extract syllables of bird calls. They then applied Random Forest (RF) to classify 625 birds songs and achieved a correct classification rate of 83.6%. Even though the number of species used in Neal et al. was larger than that of Briggs et al., the improvement in classification was attributed to the state of the art Random Forest classifier used. Random Forest has a mechanism for boosting results by splitting the dataset into random trees and applying majority voting, which helps improve classification rates.
All the above research have used FFT to improve the quality of the signals, as audio recordings taken in the field are usually buried in noise. It has been demonstrated by Lopes et al. (2011) that when the number of species is increased the classification rate reduces, even with FFT. They performed experiments using 3, 5, 8, 12 and 20 species and by first applying FFT to the signals to reduce the noise and then applying a sound ruler software, with Naive Bayes (NB) classifier to classify species by vocals. Lopes et al. showed that by randomly using 3 species and averaging the results, the classification rate was 61.5% whilst this was 25.4% for 20 species. Other work using vocals did not attempt
2.2. APPLICATION OFCOMPUTERVISIONTECHNIQUES TOSPECIES
CLASSIFICATION 15
classification. For example, Bardeli et al. (2010) developed a real-time bird-counting system using their vocals.
The use of audio signals has some attractive features; species typically have distinc-tive calls and no line of sight is necessary to detect audio. However, there are also a significant disadvantages. Firstly, audio signals are sometimes buried in noise and it be-comes difficult if not impossible to remove the noise. Secondly, audio signals are sparse (an individual may emit no audio at all for extended periods) and it is unrealistic to dif-ferentiate some individuals in this way (e.g. for species-level counting).
Due to the limitations of using the audio signals for classification, one work (Marini et al., 2015) attempted to improve species classification rates by combining appearance features from the CUB200-2011 dataset (Wah et al., 2011b) with audio signals from the Xeno-Canto dataset. This work achieved an improved correct classification rate of be-tween 1.2% to 15.7% for species when compared to using appearance features alone. Even though this has improved classification rates, it was for a limited number of species and recognition rates were not very significant compared to methods that uses appearance features alone (Berg and Belhumeur, 2013; Branson et al., 2014; Berg et al., 2014). The limited number of species used was due to the fact that the CUB200-2011 dataset did not have enough corresponding audio counterparts in the Xeno-Canto dataset.
2.2
Application of Computer Vision Techniques to Species
Classification
Whilst several species recognition systems have used audio, more recently, recognition systems have focused on the application of computer vision techniques. One work that used both computer vision and bio-acoustic processing is the work in Marini et al. (2015) but the results in this case was no different to those that use just computer vision tech-niques (Berg and Belhumeur, 2013; Branson et al., 2014; Berg et al., 2014). Therefore, since this thesis focuses on using only computer vision techniques in the classification of species, the following sections of this chapter have been dedicated to the review of computer vision techniques.
2.2.1
Studies related to Other Species
Whilst computer vision applications to bird species represent the most relevant existing works, there have been a number of other studies which have been applied to bats and which address similar problems and challenges. Unlike birds, bats are predominantly nocturnal and applications of computer vision techniques need to be effective in low-light conditions. In particular, colour features are generally undetectable, and existing approaches have therefore looked more closely at the extraction of motion features.
Existing works, such as Cullinan et al. (2015); Matzner et al. (2015); Hristov et al. (2010); Betke et al. (2008); Lazarevic et al. (2008) have been motivated mainly by au-tomated censusing of large populations, as well as classification of individuals. A small number of these works, such as that by Betke et al. (2008), have attempted to estimate wing beat frequencies of individual bats. Betke et al. used thermal imaging together with pose templates to form a signal which was then analysed using Fast Fourier Transform (FFT) techniques to recover a frequency estimate of signals buried in noise. Hristov et al. also used a thermal camera with computer vision algorithms to detect and track species. Species that were successfully tracked beyond a set threshold value were counted auto-matically to estimate the total number of emerging bats from a cave.
Like Betke et al. the works by Cullinan et al., Matzner et al., and Lazarevic et al. also use thermal imaging, but include some attempts at classification, including broad species of birds. Cullinan et al. attempted to identify four categories (bat, gull, tern, swallow) us-ing flight tracks only. They reported 82% correct classification; however, this represents only a small number of categories, does not consider fine-grained differentiations and is highly contextualised to offshore wind-farms. Similarly, Lazarevic et al. were also moti-vated by studies around wind farms but looked at only coarse classification (bat or bird). Some disadvantages common to all these methods are that thermal imaging for detect-ing species may be limited by excessive humidity which affects the clarity of the image, distance from the camera’s field of view (Cullinan et al., 2015). Recordings from these cameras have generally lower resolution compared to optical counterparts, which makes them more suitable for both day and night recordings, but may again be very expensive.
2.2. APPLICATION OFCOMPUTERVISIONTECHNIQUES TOSPECIES
CLASSIFICATION 17
Finally, many features used for species classification are not apparent using thermal imag-ing.
Unlike bats, which are typically filmed in low-light, the automated monitoring and classification of other species is able to make wider use of appearance features (such as colour). Some recent attempts to automate the classification of fish species have used both appearance and motion features (though not combined). For example, Lee et al. (2003) used shape contour features to discriminate between nine different fish species achieved an overall true positive rate of between 13% and 80%. Spampinato et al. (2010) also developed a fish classification system which used texture and shape features, achieving 92% overall true classification rate; the combination of different appearance features was effective in this case. Another appearance-based technique by Rodrigues et al. (2010) used Scale-Invariant Feature Transform (SIFT) and Principal Component Analysis (PCA) to select effective linear combinations of features; the results of their evaluations were similar to those by Lee et al. and Spampinato et al., achieving an overall true positive rate of 92% across six species. More recently, trajectories (motion) features from video streams have been used to model fish behaviour, and detect outliers; for example, the work of Spampinato et al. (2014), and Beyan (2015).
Fish studies using computer vision techniques have gained some popularity recently. Several datasets have been introduced to support their study (Jager et al., 2015; Fisher et al.; Joly et al., 2015). Jager et al. (2015) introduced an imbalanced dataset for classi-fication of Croatian fish species. This is a fine-grained fish dataset, which contained 12 species of fish, made up of 794 images. The work in Jager et al. then combined convo-lutional Neural Networks (CNN) and SVM to perform a baseline experiment achieving a correct classification rate of 66.78%. The Fish4Knowledge dataset (Fisher et al.) was in-troduced for the classification and study fish behaviour. This large dataset was originally collated for the study of fish behaviour studies but has a great potential for classification, with a potentially large number of species.
A prolific number of datasets for the study of species is an indication of how impor-tant the application of computer vision to animal study is becoming. A butterfly dataset
(Anwar et al., 2015b,a), with some initial investigations into the classification of species has also been developed. Anwar et al., used a bag of visual words to classify 30 species by including spatial information of extracted images. Other butterfly datasets include Lazeb-nik et al. (2004) which is made up of 7 species and the Leeds butterfly dataset Wang et al. (2009) made up of 10 species.
2.2.2
Bird Species Classification using Appearance Features
Whilst Cullinan et al. (2015), and Matzner et al. (2015) mentioned above have attempted to use motion features to differentiate between small numbers of species, all other exist-ing works concerned with the automated classification of birds use appearance features derived from a single image of an individual bird. These type of approaches can be further subdivided into those that make use of information about the physical structure of indi-vidual birds (referred to aspart-based), and those which do not. Non-part-based methods use colour and shape features of the entire bird, without considering the relative posi-tion, to determine its species (Marini et al., 2013; Wah et al., 2011a,b). For example, the work by Marini et al. uses colour features extracted from the bird with a Support Vector Machine (SVM) classifier. Again most of these works have been used to differentiate between relatively small numbers of species and struggle to maintain performance as the number of species increase. Marini et al. showed that when using colour features alone on the Caltech-ucsd birds-200-2011 Dataset, accuracy reduces from approximately 85% when selecting between 2 species to 20% when differentiating between 17 species and just 7% accuracy with 200 species. SIFT and colour features (Wah et al., 2011b) work well for the classification of bird species but again, is only tested for a small number of classes. The work presented in Welinder et al. (2010), classified bird species using size and colour histogram with a bin size of 10 but the classification rate was also low, which was attributed to the fine-grained nature of the dataset.
Part-based methods use features which are associated with specific parts of the bird’s body and use colour and/or shape features (Wah et al., 2011a; Duan et al., 2012; Berg and Belhumeur, 2013; Huang et al., 2013; Branson et al., 2014; Wah et al., 2011b; Berg et al., 2014). This general approach can help differentiate between species with high
2.2. APPLICATION OFCOMPUTERVISIONTECHNIQUES TOSPECIES
CLASSIFICATION 19
visual correlation. For Example Collared and Turtle Doves (Streptopelia decaoctoand
Streptopelia turturrespectively) are species with distinguishing features around the neck and the eyes but Turtle Doves exhibit a black and white striped neck patch and a bold red eye ring, which is not visible on Collared Doves. In such species, these methods have achieved better classification accuracy but almost all require some manual input (so are not fully automated) and also require good-quality images in which body parts are present and identifiable. Typically, the manual inputs are annotations which identify the bird’s parts prior to feature extraction and this is time-consuming and labour intensive, placing some practical limits on the amount of data which can be processed. For example, Branson et al. proposed ahuman in the loopapproach, which is predicated on the idea that a human and computerised system working together classify more efficiently than either alone. The human operator annotates the parts and answers multiple choice questions and the algorithm uses this information to assist with the classification: they were able to achieve a true positive rate of 93%. Berg et al. developed an online application called Birdsnap, which can be used to classify various US bird species; this also requires some manual input to annotate the bird’s parts prior to segmentation and classification.
Krause et al. (2015), and (Gavves et al., 2013, 2015) both developed annotation-free parts-based methods, which automatically identified body parts using co-segmentation and alignment. Their results compared favourably to other states of the art methods: Krause et al. used figure/ground segmentation to determine pose and localise the bird’s parts, while Gavves et al. fitted ellipse to the segmented object to align and then determine sub-parts. Results based on the CUB-2011 dataset show that the true positive rates were 62%, 82% and 67% for the methods in Gavves et al. (2013); Krause et al. (2015); Gavves et al. (2015) respectively. The drawbacks of these methods are that they make use of the Grab-Cut segmentation method Rother et al. (2004b) so still require some manual inputs: decomposing soft-bodied objects with arbitrary poses, remain a challenging problem in computer vision. Another annotation free method was proposed by Zhang et al. (2015), this detects parts using CNN feature representations. The main difference between this and Krause et al. is the method by which the parts are selected. Whereas Krause et al.
align the co-segmented objects before labelling parts, Zhang et al. (2015) uses CNN fea-ture representations to detect parts automatically. The correct classification rate reported by Zhang et al. was (75%) based on the CUB-2011 Dataset and was not a significant improvement on the other methods reported.
The objective of this research is to develop a system which is capable of identifying birds in flight, which can be deployed in the field. Almost all of the part-based methods mentioned above are dependent on manual annotations and whilst many have been suc-cessful, this constraint makes them inherently unsuitable for wide-scale deployment in the field. Further more, they all also require high-quality images. The datasets used have been highly-detailed, high-resolution images which exceed the quality that would be captured automatically from flying birds in real-world settings. In addition, it is asserted that birds furthest from the camera would be less easily classified using appearance features alone (for example, colour features are attenuated). This motivates our approach of combin-ing colour and motion features. Of the other approaches mentioned, it was consider that Marini et al. is most appropriate for this problem domain, being fully automated, non-parts based (so more likely to be robust to reduced image quality) and reporting relatively good results. This method have therefore used as a benchmark for the work presented in this thesis.
2.2.3
Bird Species Classification using Motion Features
All the methods in Section 2.2.2 use single images and appearance-based models for clas-sification; however, bird species also exhibit distinguishing behaviours (flying, moving, poses, etc) which could also be used to help robust automated identification. This is par-ticularly relevant to the identification of birds in flight, especially at a distance where appearance-based features such as colour tend to attenuate, whilst motion-features re-main discernible. In ecological studies, conservation and biology, motion-based vision techniques have been applied to tracking flying species and analysing their kinematics, behaviours, and flight trajectories (Breslav et al., 2012). The analysis of bats motion us-ing computer vision techniques have widely been studied by researchers for application in ecological, conservation and biology. Bats are nocturnal creatures and are active at night
2.2. APPLICATION OFCOMPUTERVISIONTECHNIQUES TOSPECIES
CLASSIFICATION 21
and hence most studies have used thermal cameras for the analyses of their motion. Cur-rently, research concern with bats is mostly focusing on wing beats modelling (Breslav et al., 2012) and counting bats as they emerge from caves (Hristov et al., 2010; Betke et al., 2008).
The most significant relevant studies using motion features with bird species include Duberstein et al. (2012), which explores wing beat frequencies of bird and bats species but does not use these features for classification. Duberstein et al. (2012) like Cullinan et al. (2015), and Matzner et al. (2015) mentioned above have attempted to use motion features to differentiate between small numbers of species. Duberstein et al. (2012) explores the wing beat frequencies and flight patterns of bird and bat species by extracting descrip-tive statistics from flight patterns of four species of birds and bats. The statistics (which included the minimum, maximum, mean, standard deviation, quartiles and interquartile range) were used to cluster species, thus making their classifier perform faster as the number of features were small. This work was redeveloped by Cullinan et al. for broad classification of species of bats, swallows, terns and gulls. However, they only used 48 tracks from a 5 minute video from a thermal camera and these cameras may sometimes be expensive and difficult to deploy in the field. The work in Matzner et al. (2015) increased the dataset in Cullinan et al. (2015) whilst applying the same techniques in Duberstein et al. and Cullinan et al., to classify species into categories such as bats, swallows, terns and gulls.
Hitherto, works concerned with flight pattern have been carried out using recordings from tracking radar (Liechti and Bruderer, 2002; Bruderer et al., 2010; Zaugg et al., 2008) during the migration seasons of bird species while others have been carried out using thermal camera (Duberstein et al., 2012; Cullinan et al., 2015; Matzner et al., 2015). Most of these studies that use thermal cameras were recorded during the evening when species are migrating, and are also very suitable for nocturnal species like bats. Work by Huang et al. (2013) used a graphical model with saliency to classify 9 species of birds, by extracting Scale-Invariant Feature Transform (SIFT) and colour features, which were trained using different Support Vector Machine (SVM) classifiers and achieving 73.8%
classification rate, which is comparable to the results in Cullinan et al. (2015).
Characteristics of Flying Birds
Bird species can be identified by the speed at which they flap their wings, as well as their wing beat patterns. The shape of a bird’s wings determines the way it flies. Smaller-winged birds tend to fly faster to maintain the same lift as those with larger wings (Cochran et al., 2008).
Most birds fly by combining flapping, gliding and soaring. The type of flight pat-tern used produced by a particular bird species depends on its size, weight, wing span and shape. The smaller birds usually fly using a technique of short bursts of flapping, alternated with intervals in which wings are folded against the body. This flight pattern is known as "flap-bounding" flight (Tobalske et al., 2009). They usually abandon the con-ventional flap-glide pattern but still glides only if they have to decelerate during flight. Examples of birds species with this characteristic flight pattern are finches and sparrows.
Some other small birds like the swift, swallow and martin glide most of the time but also occasionally combine flapping to fly faster. Other species like finches and woodpeck-ers have undulating flight pattern, which describes a kind of roller-coaster style where the bird flaps its wings during the rising phase, then glides as it descends.
Budgerigars fly using flap-gliding and have the tendency to fly at only two distinct fixed speeds. They switched between a high speed and a low speed suited to safe ma-noeuvring in a cluttered environment (Schiffner and Srinivasan, 2016). Birds like ravens and hawks have a flap-glide or flap-soar flight characteristics, which usually consist of flapping their wings with some occasional breaks from flapping by soaring or gliding. Interestingly, cockatiels blend the traditional flap-gliding with flap-bounding.
Some birds, like Parakeet, gulls, pigeons and doves have direct flight pattern, which consist of a steady flight with rapid wing beats.