R
ESEARCH
Abstract
Design is a discipline which involves many domains, skills and professions. Design practice in Technology education1
in the Irish second level (high school) context is not a representation of the professional realm of design. Design education in the Irish second level system is generally structured on a linear design process and associated assessment criteria. Both the linear process and assessment criteria are stifling creative design outcomes. In an attempt to improve design teaching and learning, and thus students design ability, consideration of students preferred mode of learning has been investigated. Educators have attempted to improve instruction through the influential adaptation of pedagogy intervention in the context of learning and cognitive styles of students (Cook 2008). This paper addresses the need for a strategic approach to design pedagogy to be established within the Irish second level education system, with reference to student’s preferential learning styles (PLS). The findings of the study identify the test cohort’s preferential learning styles. It also reveals significant differences in school types and contrary to initial hypotheses some surprising findings. The preferential learning styles will be one of the prime considerations in meeting the requirement of best practice design pedagogy, where there is a “compatibility of his or
her learning style and the instructor’s teaching style” (Felder
and Silverman, 1988, p.674).
Key words
Preferential Learning Style (PLS), Pedagogy, Strategy, Design.
Introduction
Background to the current Irish education system
In Ireland, compulsory education exists from six years of age up to sixteen years of age or three years of second level education (Education Welfare Act, 2000). Compulsory education includes primary and secondary level. An additional, optional level of schooling exists, known as third level. The focus group for this paper is second level students.
Second level education catersfor approximately 360,000
students in over 750 schools. Second level education, also
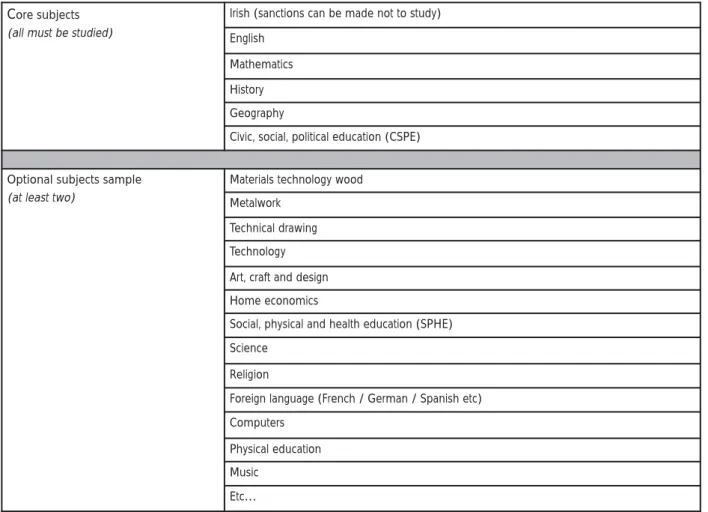
known as post primary education, is divided into two main cycles; junior and senior. Junior cycle involves three years of education, which is completed by a state examination, the Junior Certificate Examination, previously known as the Intermediate certificate. The age of junior cycle students ranges from approximately 12 years old to 15 years old. Students study a minimum of eight subjects in junior cycle (Department of Education and Science 2005). The range of core and optional subjects is outlined in Table 1. The level of study for junior cycle subjects ranges from higher level, ordinary level and foundation level.
The final two years of second level schools is known as senior cycle, which consists of a choice of three programmes – the established Leaving Certificate, the Leaving Certificate Vocational Programme or the Leaving Certificate Applied. Students must participate in one of the senior cycle programmes. Senior cycle students’ age ranges approximately from 15 years old to 18 years old. Prior to the commencement of senior cycle students may partake in an additional optional year of schooling, known as the Transition Year Programme, if it is available in their school. Transition year serves the prime purpose of broadening students’ development on an educational, social and work-based experience.
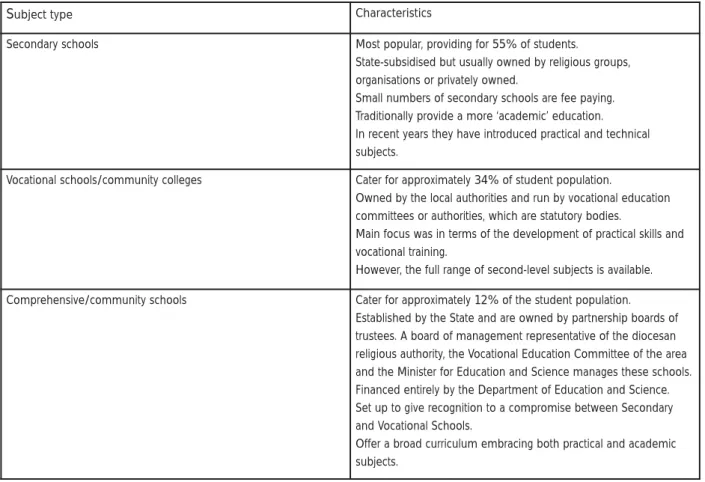
Students must study a minimum of five subjects in senior cycle, however to achieve entry to third level a minimum of six subjects must be undertaken. The Irish third level ‘points system’ has a benchmark of 600 points. Senior cycle subjects are divided into subject departments as outlined in Table 2. The subjects available vary greatly between second level school types due to differing academic foci and socio-economic factors. The three main categories of school types and their characteristics are outlined in Table 3. On completion of senior cycle students complete the Leaving Certificate Examination.
In terms of the management of curriculum and assessment for second level, four main bodies exist:
•Minister of Education:responsibility and ratification of
educational policy and direction.
•The Department of Education and Science (DES):provides
the subject syllabus and oversees its implementation.
1In the Irish context, Technology education includes Materials Technology Wood, Systems Technology, Technical Graphics and Metalwork.
•The National Council for Curriculum and Assessment
(NCCA):under the delegation from the Department of
Education and Science (DES), oversee curriculum development, teacher guidelines, and syllabus production.
• The State Examinations Commissions(SEC):responsible
for examinations in terms of preparing examination scripts, assessment material, corrections and publishing results and statistical data related to second level education. The SEC is a non-departmental body under the guidance of the DES.
On a non-governmental level there are three main associations representing the teachers of technology education subjects:
• Association of Technology Teachers (Lattu). • Techno Teachers Association (TTA).
• Engineering Technology Teachers Association (ETTA).
Description of Technology education in the Irish context. Technology education, in an Irish second level educational context, deals with eight subjects (Table 4).
Initially technology education was only available in junior cycle. However with the change in the junior cycle subjects from industrial practices to a design driven approach, the design thread has followed through to senior cycle to contextualise the materials and processes through the activities of design. Both junior and senior cycle technology education subjects are available in two levels for assessment purposes; higher level (HL) and ordinary level (OL), and some at foundation level (FL).
Outlining the study.
This paper discusses a study which sets out to determine students’ preferred learning styles in establishing a design pedagogy in Technology education in the Irish context. Design is an activity which requires a higher cognition skill set. Creative design is only possible if the designer is ‘thinking’ and applying the skill set to the issue under enquiry. Ability and style, both of which can be nurtured, (Owen-Jackson 2002) are two crucial factors which affect one’s design ability and creativity. As Sternberg noted “[Teachers] are failing to recognise the variety of thinking and learning styles they [students] bring to the classroom,
Core subjects
(all must be studied)
Irish (sanctions can be made not to study) English
Mathematics History Geography
Civic, social, political education (CSPE)
Optional subjects sample
(at least two)
Materials technology wood Metalwork
Technical drawing Technology Art, craft and design Home economics
Social, physical and health education (SPHE) Science
Religion
Foreign language (French / German / Spanish etc) Computers
Physical education Music
Etc… Table 1: Junior cycle subjects
R
and teaching them in ways that don’t fit them well”
(Sternberg, 1999, p.17). The issue also exists that many believe design ability cannot be taught, however Nigel Cross outlines that “all of us possess the ability to design, at some level, and that this can be developed through
education”(Owen-Jackson, 2002 p.124).
This paper examines the preferential learning style of 525 students (age bracket 12-16 years) within Technology education or design subjects from a range of nine second level schools. To determine the subjects’ preferential learning style the Felder-Silverman Index of Learning Styles
(ILS) (Felder 2005) was the preferred tool applied to the project. The ILS was created in 1991 by Richard M. Felder and Barbara A. Soloman. The four learning style
dimensions (comprised of 44-sub items) of the instrument were adapted from a model developed in 1987 by Felder and Silverman. The ILS was proven for reliability and validity in 2005 (Zywno 2003; Felder and Spurlin 2005)
Change in education through the eras
Schools should reflect the culture and values of its society (Vygotsky and Cole 1978). It is one’s culture that provides
Table 2: Senior cycle subjects
Subject department Subject
Applied Science Architectural technology
Engineering technology Technology
Design and Communication graphics Agricultural Science
Home Economics
Languages English (compulsory pass)
Irish
Foreign language (French, German, Spanish, etc)
Business Economics Accountancy Business studies Sciences Mathematics Applied mathematics Physics Chemistry Biology
Physics and Chemistry
Social studies History
Geography Classical studies Music Art Home Economics
R
ESEARCH
the tools to develop what to think and how to think (Kristinsdóttir 2000). Technological changes have progressed through society however the educational system to a large extent remains unchanged (Kristinsdóttir 2000).
Design activity involves both procedural and conceptual activity, requiring innovative thinking skills, which the current Irish education system does not sufficiently facilitate. The acquisition of technical and manipulative skills is important for design activity, however conceptual skills are important in the development of students innovative thinking skills which is currently not occurring in the current education system (Kimbell 1982).
A shift needs to occur in the current second level education from an ‘information era’ of knowledge acquisition, a lower cognition activity, to knowledge application, a higher cognition activity. It is not sufficient to store knowledge; one must know when, how and why this knowledge is relevant for design activity (Caban and Wilson 2004; Atman, Kilgore et al. 2008) as we are progressing into a ‘conceptual era’ (Pink 2006). Applying knowledge correctly is a critical factor of design activity, especially when broad sources of information are readily available. Another obstacle is that “most current
approaches to curriculum, instruction, and assessment are based on theories and models that have not kept pace with modern knowledge of how people learn” (Redish and Smith, 2008, p.3).
Table 3: Second level school types and characteristics (OECD and Gallagher 2003)
Subject type Characteristics
Secondary schools Most popular, providing for 55% of students.
State-subsidised but usually owned by religious groups, organisations or privately owned.
Small numbers of secondary schools are fee paying. Traditionally provide a more ‘academic’ education. In recent years they have introduced practical and technical subjects.
Vocational schools/community colleges Cater for approximately 34% of student population.
Owned by the local authorities and run by vocational education committees or authorities, which are statutory bodies.
Main focus was in terms of the development of practical skills and vocational training.
However, the full range of second-level subjects is available. Comprehensive/community schools Cater for approximately 12% of the student population.
Established by the State and are owned by partnership boards of trustees. A board of management representative of the diocesan religious authority, the Vocational Education Committee of the area and the Minister for Education and Science manages these schools. Financed entirely by the Department of Education and Science. Set up to give recognition to a compromise between Secondary and Vocational Schools.
Offer a broad curriculum embracing both practical and academic subjects.
Table 4: Technology education subjects
Junior cycle Senior cycle
Materials technology wood Architectural technology
Metalwork Engineering technology
Technology Technology
Technical drawing Design and communication graphics
R
The use of computer technology in education
In a society which is dominated by technology this trend should also exist in the second level education system. There is a progression from the information age, where there is a reform from knowledge acquisition to
knowledge application. The use of technology in education will aid design activity through a greater use of
presentation media thus appealing to a greater range of students. From a motivational perspective, the use of computers improves the climate for learning especially in subjects that use computers (Valdez et al., 1999). Technology aids the learner in a conceptual era through the availability of knowledge, transmission of knowledge and the production of new knowledge. With access to knowledge, at the touch of a button, it is becoming less important to build up knowledge, and more important to know were to find and how to use the information (Salomon, 2000). Computer technology allows easy access to information. How a student uses and transforms this information is under their command.
However not all schools and students have sufficient access to computer technology thus it should not be the sole means of providing students with information. Though, if used there are some important factors which must be considered (Kristinsdóttir 2000);
• Suit student’s learning style.
• Adaptive to the needs of each student (levels and abilities).
• Interactive. • Subject specific.
• Apply current knowledge for creative learning.
• Learning material structured on first thought and problem solving.
• Develops flexible learning: can occur anywhere and any time.
• Peer learning will be encouraged.
In second level education the use of computer technology should be used to promote students information, which can be further applied to a specific context (Suh 1990). Information acquisition is no longer sufficient in today’s society. To meet the needs of students in Technology education, a context must be established in developing student’s conceptual skills. To better meet student’s needs, student styles for learning should to be investigated.
Student styles
Learning, thinking and cognitive styles are all important characteristics of a student in terms of education. A learning style is how a student prefersto learn, for example by actively doing. A thinking style is the way a student thinks about the information they had learned. Cognitive style is the application or joining of the
information learned in various ways. Thinking and learning styles can often be taken as one style. For the purpose of this paper the focus is on preferential learning styles (PLS).
Practices in design activity
Design activity is multi-faceted activity, evident in many disciplines, which is causing ad hoc practices in a second level context. For example, there is a concentration of focus on assessment criteria for design activity, due to a misunderstanding of design activity, which was due to the fact that the goals for Technology education differed from the assessment criteria (Kimbell and Perry 2001; Barlex 2002). Thus education has become greatly dependant on assessment. This is resulting in pupils focusing on a
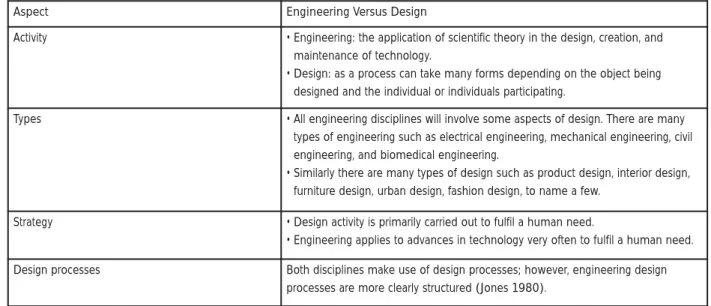
Aspect Engineering Versus Design
Activity • Engineering: the application of scientific theory in the design, creation, and maintenance of technology.
• Design: as a process can take many forms depending on the object being designed and the individual or individuals participating.
Types • All engineering disciplines will involve some aspects of design. There are many types of engineering such as electrical engineering, mechanical engineering, civil engineering, and biomedical engineering.
• Similarly there are many types of design such as product design, interior design, furniture design, urban design, fashion design, to name a few.
Strategy • Design activity is primarily carried out to fulfil a human need.
• Engineering applies to advances in technology very often to fulfil a human need. Design processes Both disciplines make use of design processes; however, engineering design
processes are more clearly structured (Jones 1980). Table 5: Engineering versus Design
R
“single, best, ‘correct’ answer to a standard problem in the shortest time” rather than encouraging divergent, creative thinking (Fry, 2006, p.3). The aim should be to achieve examination success along with creative thinking abilities. Creative thinking abilities though, can cause difficulty for teachers as they involve students carrying out activities in a ‘legislative’ nature, which primarily represents sovereignty and self-choice with respect to doing things (Sternberg 1999; Coffield, Moseley et al. 2004). Students will have a style preference established after their first year in second level education. However the school environment may not be facilitating or promoting students style necessary to achieve to the best of their ability.
Also the cause for the hindrance in the effectiveness of practicing design is due to preferential learning styles (PLS) not being accommodated or even considered in most education systems’ pedagogies. Nor are ‘universal design practices’ in place, which are adaptable to industry, education and other professions. In comparing design and engineering there are many similarities (Table 5). Design activity is carried out in both disciplines in varying degrees of complexity. However practices in engineering are far more documented and researched, especially in the context of learning styles, which have proven to aid students (Felder, Felder et al. 1995; Seery, Gaughran et al. 2003).
Preferential Learning Styles
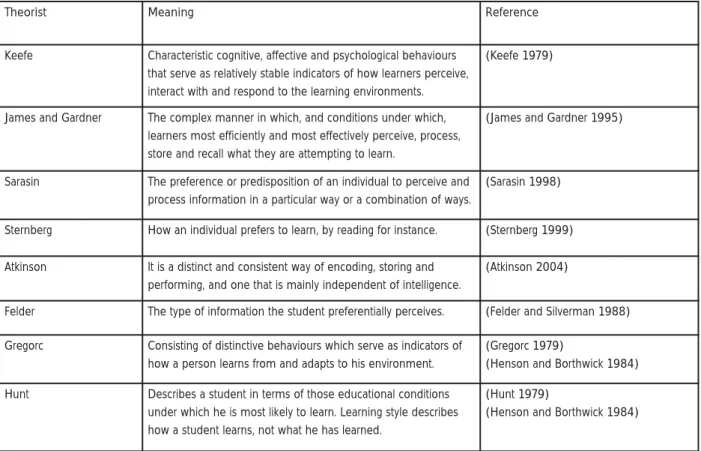
Everyone has their own preferred way of learning, it could be by reading, listening, acting or watching to suggest a few modes. The way in which one learns, receives information, uses it and retains it, is known as a learning style. Table 6 outlines definitions for learning styles from a number of theorists.
Awareness to learning styles is beneficial in education systems for many reasons. One important reason is that if the learning and teaching styles are not compatible, it usually results in unproductive learning. This is highlighted by Felder “how much a student learns in class in governed in part… by the compatibility of the students attributes as a
learner and the instructor’s teaching style”(Felder and
Brent, 2005, p.57). Another important reason is that students are not being shown how to learn effectively. Recognising how to learn effectively can be achieved by understanding learning styles, as highlighted by Caban and Wilson in the statement “to become independent and
effective learners is to help them[students] to understand
their own learning styles”(Caban and Wilson, 2004,
p.131). However it is important not to highlight individual students’ personal preferential learning style as this may result in students concentrating their learning environment solely to this domain.
Table 6: Preferential Learning Styles meaning
Theorist Meaning Reference
Keefe Characteristic cognitive, affective and psychological behaviours that serve as relatively stable indicators of how learners perceive, interact with and respond to the learning environments.
(Keefe 1979)
James and Gardner The complex manner in which, and conditions under which, learners most efficiently and most effectively perceive, process, store and recall what they are attempting to learn.
(James and Gardner 1995)
Sarasin The preference or predisposition of an individual to perceive and process information in a particular way or a combination of ways.
(Sarasin 1998)
Sternberg How an individual prefers to learn, by reading for instance. (Sternberg 1999) Atkinson It is a distinct and consistent way of encoding, storing and
performing, and one that is mainly independent of intelligence.
(Atkinson 2004)
Felder The type of information the student preferentially perceives. (Felder and Silverman 1988) Gregorc Consisting of distinctive behaviours which serve as indicators of
how a person learns from and adapts to his environment.
(Gregorc 1979)
(Henson and Borthwick 1984) Hunt Describes a student in terms of those educational conditions
under which he is most likely to learn. Learning style describes how a student learns, not what he has learned.
(Hunt 1979)
(Henson and Borthwick 1984)
R
There are almost fifty different theories regarding learning and teaching styles. Many learning and teaching styles practiced and tested for years have proven reliable and victorious. However, are these teaching and learning styles compatible with design pedagogy? One problem with the subject matter of design is that there is no ‘universal learning theory’ associated with the activity. Unfortunately the same theory is not present for design practice within second level schools. A “universal design theory”(Lossack and Grabowski, 2000, p.1) is fundamentally required within our education system. A universal design theory is one which can be adaptable to the various design circumstances. It should also suit the various PLS’s of design students insofar as creativity and ‘designerly ways of thinking’ can be developed and nurtured in students.
Relevance of learning styles for design activity
At regular intervals a teacher will carry out assessment to determine the level of understanding by students. This should consequently, if required, result in adjustments in teaching style by the teacher to meet the needs of their students. Students, as a group, can be informed of learning styles, thus increasing their ability to develop skills which will improve and increase their learning. Much research has occurred in the area of learning styles over the past four decades. Learning style research has broadened to a variety of disciplines. However design activity is one area that learning styles are quite novel. Similarly design activity in Technology education is a relatively new area. Engineering is a discipline in which design activity may be a major element and has been greatly researched (Cross 1989; Seery, Gaughran et al. 2003; Atman, Kilgore et al. 2008). Engineering disciplines in third level institutions have gained many developments due to the discovery of the learning style profiles of its students (Felder and Spurlin 2005; Seery 2005). This benefit could be applied to developing design activity in the Irish second level education system through the development of a strategic approach to education and training with reference to preferential learning styles. Thus the main reason is to improve understanding and learning of students participating in design activity in Technology education.
Investigating and identifying learning styles provides the opportunity for the teacher to match the design activity instruction to the preferred style of learning of the student, thus enriching the learning experience.
Selecting the optimum learning style inventory
Consequently what do schools have that will promote the required skills for successful design? Primarily, knowledge is a necessity and schools are the best facility to obtain
and access knowledge, provided it is presented correctly. However, in attempting to increase knowledge and understanding, different learning styles are not being facilitated. This is highlighted by Zywno et al, when it was stated “It is also generally agreed that the conventional teaching style prevalent in schools and universities does not accommodate the preferences of all students equally”
(Zywno and Waalen, 2002, p.36). Studies have shown that greater than fifty-percent of knowledge is lost
immediately after a lesson unless some action is occurring using this new knowledge. This is reinforced by Cubitt, Hodgson and Norman; “The proportion of key information which students remember immediately after a lecture
[lesson] vary from about 50% downwards”(Cubitt, Hodgson and Norman, 1993, p.172).
Information is also lost if the learning style is not
compatible with the methods by which the information is presented. As Felder described “information routinely
comes in both forms,[visual and verbal] and much of it will
be lost to someone who cannot function well in both of
these modes”(Felder, 1996, p.18). The best way
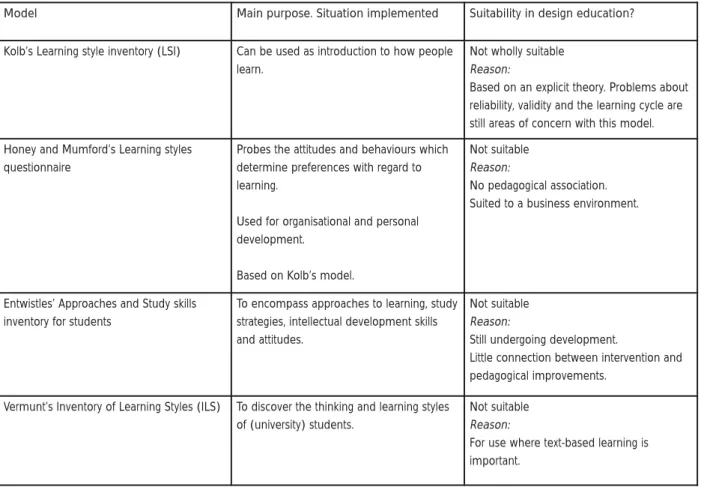
something can be presented is to ensure it appeals to all the audience, which in a school situation is to ensure the knowledge, is presented via the dominant teaching styles, which will reach all students and their multiple learning styles. All of the learning style models have the aspect of giving a positive affirmation of the learning potential of students, based on the belief that anyone can benefit from education if their preferences are catered for. As there is not sufficient research in terms of learning style models within the technology education, Table 7 distinguishes the characteristics and suitability of some popular learning style models.
Numerous studies of the learning style inventories have occurred, however there is no general consensus in terms of the inventory best suited to web based learning. Web based learning along with design activity requires adaptability to various design activity, learner differences and individual needs (Kuljis and Liu 2005). Thus it may be observed from the analysis of the various learning style tools/models, the Felder-Silverman model is the only model which has been tried and testing in a cognate activity. Therefore for the purpose of this research the Felder-Silverman model was adopted.
Current Pedagogy
Felder and others have shown that when and if the teaching style is harmonised with the corresponding learning style, improvement in learning and understanding for the student at all levels is evident (Felder, Felder et al. 1995). To further aid learning, it was outlined by Kolb, that
R
Model Main purpose. Situation implemented Suitability in design education? Gregorc Style Delineator.
(Ballone & Czerniak, 2001)
To identify and quantify the mind qualities and their respective style characteristics. Used for helping individuals gain a better understanding of self and others.
Not suitable
Reason:
Instrument for adults.
Sternberg’s thinking styles inventory (TSI) (Sternberg 2001)
Derived from the theory of self-government. Not a theory of thinking and learning styles but a metaphor, undergoing research stimulating research and in changing practice.
Not suitable
Reason:
In need of independent evaluation.
Herrmann’s Brain Dominance Instrument (HBDI)
To promote change and growth by identifying mental preference or thinking styles.
Personal, interpersonal, staff and organisational implementation.
Not suitable
Reason:
Well established in the ‘business’ world. Pedagogical implications of the ‘whole brain’ model have not yet been fully explored and tested.
Dunn and Dunn (Dunn 2003b) To improve attainment through matching instruction, environment and resources to students’ high preferences; many of which a teacher has little control over.
Some of the sub-domains are not supported by scientific evidence.
Not suitable
Reason:
Promotes self-limiting behaviour and beliefs by students working only with their strong preferences rather than openness to new styles and preferences.
Myers-Briggs Type Indicator Provides a view of the whole personality including learning, though not specifically about learning.
Often used in career counselling to steer students toward appropriate areas of study.
Not suitable
Reason:
It is still not clear which of the personality types of the MBTI are relevant for education
Carl Jung’s Psychological Topology From these ones preferential learning style or cognitive style can be determined. The Jung types (dichotomies) were used in the Myers-Briggs Type Indicator which differs from standardised tests and others measuring traits, such as intelligence, instead classifying people’s preferred types.
Not suitable.
Reason:
More suited to determining traits such as intelligence
Felder-Silverman Index of Learning Styles model
To establish a persons preferred learning style.
Used in engineering and computer based subjects.
Suitable
Reason:
Engineering has a sub-structure similar to design. This instrument has been successfully implemented and proven in reliability and validity.
ILS often used in technology enhanced learning.
R
it is effective to start with one’s dominant learning style (Thieme and Boeijen 2008). Similarly Felder has also outlined that the use of any learning style model should result in a similar style of teaching; "which model
educators choose is almost immaterial"(Felder, 1996,
p.23). Varying the teaching style, aids students development of additional learning styles, that should benefit them further on in life.
“Students whose learning styles are compatible with the teaching style of a course instructor tend to retain
information longer, apply it more effectively, and have more positive post-course attitudes toward the subject.”
(Felder, 1993, p.286)
A PLS approach in teaching design within Technology education would not only benefit the students acquisition of design capabilities, but would also enhance their technological literacy.
Design of Experiment Rationale-PLS ILS
Motivation for investigating PLS:
• Students have unique needs especially in the practical design subjects of the technologies.
• Students may have difficulty learning when the learning style does not match the teaching style implemented. • Learning style has a significant role in second level
education as students are still developing and also being exposed to a greater range of interactive presentation media, such as drawing programs, internet and interactive board.
• Understanding learning styles aids learning and improves retention.
Participants-PLS
For validity, in relation to the second level cohort, an initial pilot test and pre-pilot test were carried out for the ILS survey. The initial pilot test was carried out on postgraduate students, most of who graduated with Materials and Technology Engineering/Construction Education Degrees, and the remainder completed Engineering based degree courses. Undergraduate
Model Main purpose. Situation implemented Suitability in design education? Kolb’s Learning style inventory (LSI) Can be used as introduction to how people
learn.
Not wholly suitable
Reason:
Based on an explicit theory. Problems about reliability, validity and the learning cycle are still areas of concern with this model. Honey and Mumford’s Learning styles
questionnaire
Probes the attitudes and behaviours which determine preferences with regard to learning.
Used for organisational and personal development.
Based on Kolb’s model.
Not suitable
Reason:
No pedagogical association. Suited to a business environment.
Entwistles’ Approaches and Study skills inventory for students
To encompass approaches to learning, study strategies, intellectual development skills and attitudes.
Not suitable
Reason:
Still undergoing development.
Little connection between intervention and pedagogical improvements.
Vermunt’s Inventory of Learning Styles (ILS) To discover the thinking and learning styles of (university) students.
Not suitable
Reason:
For use where text-based learning is important.
Table 7: Characteristics of learning style models (Coffielda, Moseley et al. 2004; Coffieldb, Moseley et al. 2004)
R
Bachelor of Technology Courses and BSc, Product Design students participated in the pre-test of the amended surveys. The aspiring teachers served the purpose of checking the survey for soundness of language for second level students. The ILS tool was finally tested with a small cohort (15) of second level students.
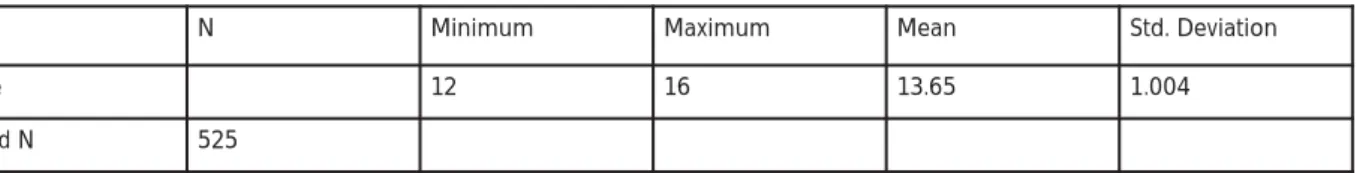
The main focus group participants consisted of approximately 530 students from the technologies, consisting of 146 female and 379 male. The students’ age ranged from 12-16 with a mean age of 13.65 and standard deviation of 1.004 (Table 8)
Two criteria determined the mechanism for school selection:
• Geographical location:Schools were selected from
urban, suburban and rural regions throughout Ireland.
• School type:was an influential factor. The schools
selected comprised of a Vocational School, Secondary School, Community College/School, and
Comprehensive, which are a representational sample of the four types of second level schools in the Irish education system as illustrated in Figure 1.
Table 8: Student participants PLS and Design impression survey
Table 9: Gender distribution from the various school types
N Minimum Maximum Mean Std. Deviation
Age 12 16 13.65 1.004
Valid N 525
Figure 1: Second level school type breakdown
60 55 29 50 40 30 20 10 0 %
Secondary Vocational Comprehensive Community School type
5
11
School type Demographics Gender Percent of total (n=525) study
participants
Secondary school Sub Urban town Female 8.7% (n=46)
Secondary school Sub Urban town Male 8.7% (n=46)
Secondary school Sub Urban town Co-educational 54.6% (n=287)
Secondary school Rural village Co-educational
Secondary school Sub Urban town Co-educational
Secondary school Sub Urban town Co-educational
Comprehensive school Sub Urban city Co-educational 12.6% (n=66)
Vocational school Sub Urban town Co-educational 13.2% (n=69)
Community school Rural village Co-educational 2% (n=11)
R
The gender profile of the school cohort being surveyed was also divided (Table 9). One school was single sex-male, another single sex-female and the remainder were co-educational. One of the schools is fee-paying private. All these factors would affect the individual student learning styles. However the PLS was determined as a whole group rather than on an individual level. Informing students of individual learning style may result in sole concentration on their personal learning style rather than developing a greater range of learning styles.
Design-PLS
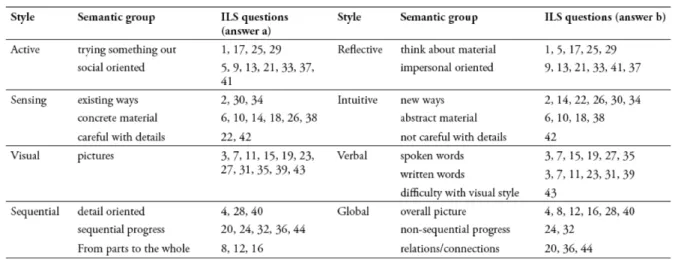
Preferential learning styles were assessed using the Felder-Silverman Index of Learning Styles. Initially Felder and Soloman devised an indicator to try and establish ones preferential learning style. Felder and Silverman designed the Index of Learning Styles (ILS), which has now been proven in relation to the four dimensions of the Felder-Silverman learning style model in a third level context in engineering education (Felder et al, 2005). The Felder Silverman ILS was used to determine the PLS for second level students in technology education. The Index of Learning Styles is broken up so that every fourth question is related to one of the four learning styles: Active-Reflective, Sensing-Intuitive, Visual-Verbal, and Sequential-Global.
Overview of the ILS: • 44 questions.
• 11 questions for each dimension.
• Each question allows two possible answers indicating a preference for either the one or the other pole of the learning style dimension (Figure 2); e.g. active (+1) or reflective (-1).
• Result: a value between +11 and -11 for each dimension (Figure 3).
Procedure-PLS
For the ILS survey each question was read aloud to ensure no ambiguities in relation to word diction or meaning, along with a supporting keyword meaning sheet. The following instructions were given to all participants before commencing:
• All questions must be answered.
• If both answers apply select the one that applies most
frequently.
• Clearly tick one selected answer.
• Each question was then read aloud and repeated.
• Ten minutes of additional time was then allocated on
completion, to allow each student read over and contemplate selected answers.
Figure 2: PLS Dimension’s meaning representation (Graf, Viola et al. 2007)
Figure 3: ILS scale
-11 -9 -7 -5 -3 -1 0 1 3 5 7 9 11
Very Strong
Strong Moderate Mild Neutral Mild Moderate Strong Very
Strong
R
Results Raw Data
All questionnaires were collected and firstly screened for signs of apathetic participation; those questionnaires (approximately one-percent) were eliminated after consultation with each class teacher. The raw data was then tabulated trends and practices began to emerge.
For the ILS survey the results were recorded against a six point scale (Figure 3) where ‘1’ represents a mild preference while ‘11’ of the scale represents a very strong preference for each particular style mode. All test scores were recorded (Table 10) and subjected to statistical analyses. The data was checked to see if it was normally distributed, the normality tests used where the
Kolmogorov-Smirnov and the Shapiro-Wilk. Both tests indicated that the data was not normal.
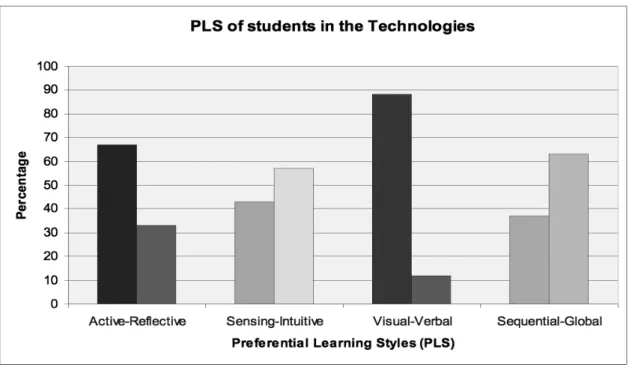
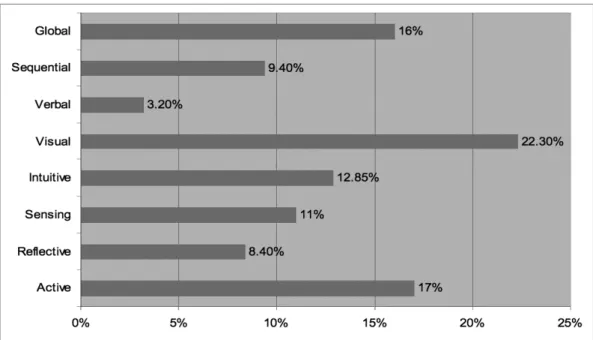
The raw data displayed in Table 10 clearly illustrates a strong preference for Active, Visualwhich is illustrated in Figure 4.
However the results for Sensing(11%)/Intuitive(13%)
and Sequential(10%)/Global(16%) are not significant
enough to draw any real conclusions and therefore warrant further investigation (Figure 4, Figure 5).
Table 11 (abridged), composed by Felder and Brent, (Felder et al, 2005) consists of all the reported PLS studies. Table 11 is used as a comparison for the results gained as a result of the study (Table 12). Approximately 530 students participated and Table 12 represents the findings from the study completed in May 2006, where A is active (reflective), S is sensing (intuitive), Vs is visual (verbal) and Sq is sequential (global).
Table 10: Learning Style Data
Figure 4: PLS of students in the Irish Second Level Technology education system
Scale Active/Reflective Sensing/Intuitive Visual/Verbal Sequential/Global
1 99 88 67 88 60 29 87 106 2 106 59 67 86 81 21 57 125 3 73 21 42 48 97 12 32 73 4 54 6 31 45 104 3 16 24 5 20 2 14 30 90 1 3 5 6 4 0 8 6 34 0 2 2
R
ESEARCH
Figure 5: Learning Style Preference in Technology/Design Education
Table 11: Reported Learning Style Preferences (abridged) (Felder et al, 2005)
Population A S Vs Sq Reference
Iowa State Materials Engr. 63% 67% 85% 58% Constant (1997)
Michigan Tech, Env, Engr 56% 63% 74% 53% Paterson (1999)
Ryanson Univ., Elec. Engr. Students (2000) Students (2001) Students (2002) 53% 60% 63% 38% 66% 66% 63% 42% 86% 89% 89% 94% 72% 59% 58% 35% Zywno (2001) Zywno (2002) Zywno (2003) Tulane, Engr.
Second Year Students First Year Students
62% 56% 60% 46% 88% 83% 48% 56% Livestay (2002)
Univ. of Limerick, Mfg. Engr. 70% 78% 91% 58% Seery (2003)
Univ. of Michigan, Chem. Engr. 67% 57% 69% 71% Montgomery
(1995) Univ. of Sao Paulo, Engr.a
Civil Engr. Elec. Engr. Mech. Engr. Indust. Engr. 60% 69% 57% 53% 66% 74% 86% 68% 67% 70% 79% 76% 80% 84% 73% 50% 54% 51% 45% 50% Kuri (2002) Univ. of Technology Kingston, Jamaica 55% 60% 70% 55% Smith (2002)
aData collected with Version 1 of the ILS (All other studies used Version 2.)
R
From comparing the findings on Table 10 and the results from Table 12, (the identified PLS), and as illustrated in Figure 4, it may be concluded that students in Technology education conform to the other engineering studies. In terms of the test cohort average (Table 12) two figures do not conform to the “norm”. However, the students involved have yet to complete their post-primary
education, which should cause further developments and advancements in their present PLS (Price 1980; Dunn and Griggs 1995) .
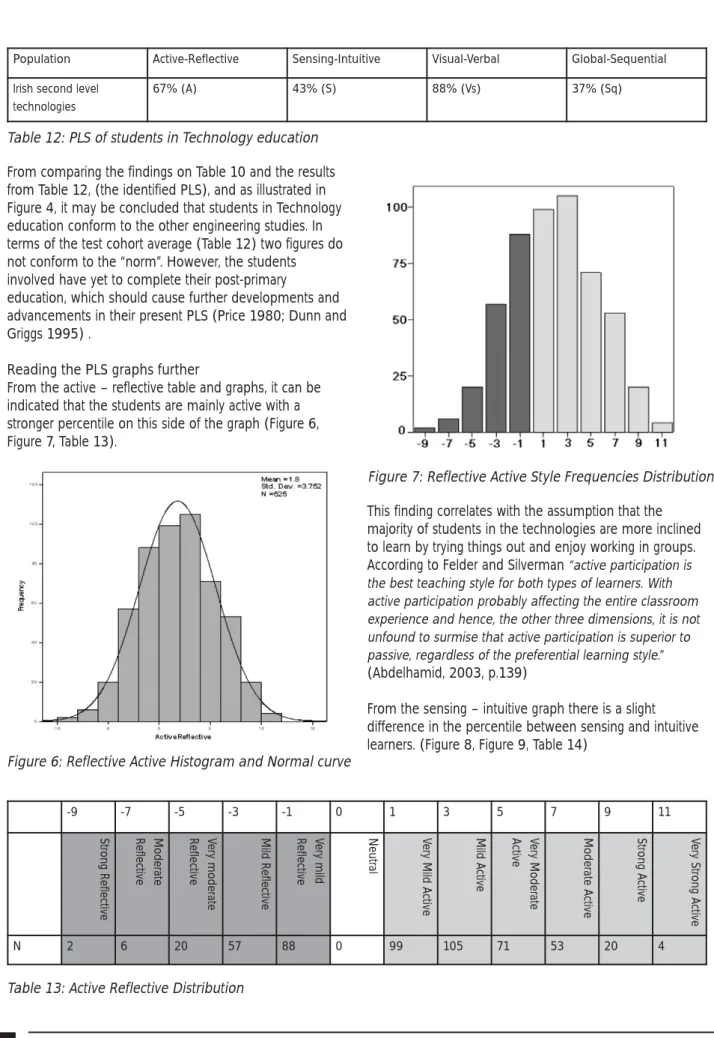
Reading the PLS graphs further
From the active – reflective table and graphs, it can be indicated that the students are mainly active with a stronger percentile on this side of the graph (Figure 6, Figure 7, Table 13).
This finding correlates with the assumption that the majority of students in the technologies are more inclined to learn by trying things out and enjoy working in groups. According to Felder and Silverman “active participation is the best teaching style for both types of learners. With active participation probably affecting the entire classroom experience and hence, the other three dimensions, it is not unfound to surmise that active participation is superior to passive, regardless of the preferential learning style.”
(Abdelhamid, 2003, p.139)
From the sensing – intuitive graph there is a slight difference in the percentile between sensing and intuitive learners. (Figure 8, Figure 9, Table 14)
Table 13: Active Reflective Distribution
Figure 6: Reflective Active Histogram and Normal curve
Figure 7: Reflective Active Style Frequencies Distribution. Table 12: PLS of students in Technology education
Population Active-Reflective Sensing-Intuitive Visual-Verbal Global-Sequential Irish second level
technologies
67% (A) 43% (S) 88% (Vs) 37% (Sq)
-9 -7 -5 -3 -1 0 1 3 5 7 9 11
Strong Reflective Reflective Moderate Ve
ry moderate
Reflective Mild Reflective Ve
ry mild
Reflective Neutral Ve
ry Mild Active Mild Active Active Very Moderate Moderate Active Strong Active Very Strong Active
N 2 6 20 57 88 0 99 105 71 53 20 4
R
However the slight difference is seen in terms of the greater number of mild intuitive learners, which are more abstract thinkers, innovative and oriented toward theories
and underlying meanings. As noted by Felder “that sensors are likely to think sequentially while intuitors may favour either sequential learning or global learning (if they are
perceivers).”(Richard M. Felder, 2005, p.109).
There is a very clear distinction in terms of the difference between verbal – visual learners. (Figure 10, Figure 11, Table 15)
Table 14: Sensing Intuitive Distribution
Figure 8: Sensing-Intuitive Histogram and Normal curve
Figure 10: Verbal-Visual Histogram and Normal curve
Figure 9: Sensing Intuitive Style Frequencies Distribution
-11 -9 -7 -5 -3 -1 0 1 3 5 7 9 11
Ve
ry strong
Sensing Strong Sensing Moderate Sensing Ve
ry moderate
Sensing Mild Sensing Ve
ry mild
Sensing Neutral Ve
ry Mild Intuitive Mild Intuitive Intuitive Very Moderate Moderate Intuitive Strong Intuitive Intuitive Very Strong
N 8 14 31 41 67 65 0 87 86 48 43 30 5
Figure 11: Verbal Visual Style Frequencies
R
Visual learners are the stronger of the two domains as illustrated by the high peak and the presence of “very strong visual” learners.
The sequential – global learners are linked to the visual – verbal learners in the fact that sequential learners are more inclined to be verbal processors and global learners are more inclined to be visual processors.
Graphically (Figure 12, Figure 13, Table 16) the cohort is globally stronger, which also correlates with the previous
visual-verbal graph. Global learners should also be more intuitive perceivers. Global learners normally have a non-linear thinking process and acquire understanding.
Overall the findings correlate with Felder when he noted
“that the active-reflective, sensing-intuitive, and visual – verbal scales may be considered independent but the sequential-global and sensing-intuitive scales show a moderate degree of association, confirming the conclusion
drawn from the interscale correlations”(Felder, 2005,
p.108).
Table 15: Verbal Visual Distribution
-9 -7 -5 -3 --1 0 1 3 5 7 9 11 Strong V e rbal Moderate V e rbal Ve ry Moderate Ve rbal Mild V e rbal Ve ry mild V e rbal Neutral Ve ry Mild V isual Mild V isual Ve ry Moderate V isual Moderate V isual Strong V isual Ve ry Strong V isual N 1 3 12 19 28 0 60 81 97 102 89 33
Table 16: Sequential Global Distribution
-11 -9 -7 -5 -3 -1 0 1 3 5 7 9 11
Ve
ry strong
Sequential Strong Sequential Sequential Moderate Ve
ry moderate
Sequential Mild Sequential Ve
ry mild
Sequential Neutral Ve
ry Mild Global Mild Global Global Very Moderate Moderate Global Strong Global Very Strong Global
N 2 3 16 32 57 85 0 104 124 72 23 5 2
Figure 12: Sequential Global Histogram and Normal curve.
Figure 13: Sequential Global Style Frequencies
R
From the findings, in relation to PLS, one can observe the preferential learning style of students in the technologies is primarily active and visual. Also there is evidence of a correlation between sequential-global and sensing-intuitive. These findings show corresponding reinforcement with findings of Felder et al when he noted “factor analyses conducted as part of the same studies supported the conclusion that the active-reflective, sensing – intuitive, and visual-verbal scales are orthogonal but the sequential-global and sensing-intuitive scales show some association. That association is consistent with the theory that underlies the Index of Learning Styles and does not compromise that validity of the instrument for its principal intended purpose
of designing balanced instruction”(Felder, 2005, p.110).
The findings of Richard M. Felder show a mismatch occurring between learning styles and teaching styles,
“a mismatch thus exists between the learning styles of most engineering students and the teaching style to which they
are almost invariably exposed”(Richard, M. Felder, 1988,
p.677). This is either a disadvantage for the weak student or an advantage for the stronger student as they are getting a more diverse education. However “irrespective of the extent of the mismatch, presentations that use both visual and auditory modalities reinforce learning for all students”
(Richard, M. Felder, 1988, p.677). In addition Felder and Silverman suggest “that instructors can effectively engage students in the learning process by adopting a multi-style approach in instruction such that no one dimension of
learning and teaching is favoured” (Abdelhamid, 2003,
p.127).
Another aspect to look at it is the environment and conditions one is learning in. As Felder once said “a student’s preference on a given scale may be strong, moderate or almost non existent may change from one
subject or learning environment to another”(Felder, 1993,
p.286).
Analysis of Disparity in PLS
According to Petroski “numerous other factors (that) affect design including aesthetics, cultural, economics, egotistical,
ethical, historical, political and psychological”(Petroski,
2006, p.9). Similarly these factors can affect ones learning style(s). The influential factors affecting a students learning
style must be taken into consideration to determine the consequential affects. Determining the affects is important as they must be taken into consideration in developing a strategic approach to design pedagogy.
The main factors selected for analysis were school type, school gender and student gender (Table 17). As the data was proven to be of non-parametric nature and the experimental design was unrelated, the Mann-Whitney U Test and Kruskal-Wallis H Test were chosen to analyse the differences between the independent and dependent variables. Table 17 illustrates the influence between student gender, school type and school gender for each learning style domain.
For the Mann-Whitney Test results (P-values) which are not less than or equal to 0.05 are not significant. Therefore there is no significant difference in the PLS of males and females from the ‘Student Gender’ (Table 17). However for the Kruskal-Wallis Test, if the significance level is a value less than 0.05 then one can conclude that there is a statistically significant difference in the continuous variable (PLS) across the groups for ‘School Gender’.
In the Kruskal-Wallis Test for the significant difference between PLS and School Type, two PLS showed a significant difference (Table 17). These PLS were ‘A’ and ‘S’ and inspecting the mean ranks for the school types suggests that the Community School had the highest ‘A’ scores, which signifies the preference for the activeand
sensingstyle of learning. Whereas the Vocational School
reporting the lowest ranking shows its significant preference for the reflectiveand intuitivelearning styles, which runs contrary to expectations for this type of school which has a technical or practical based ethos. In the other PLS there is no significant difference in the PLS of the Comprehensive School and the Secondary School. The significant difference between PLS and school gender, three PLS showed no significant difference and ‘A’ showed a significant difference (Table 17). In terms of the mean ranking the female school showed the highest ‘A’ scores, which shows the significant preference for the reflective style of learning. On the other hand the co-educational school reporting the lowest mean ranking, highlighting the significant preference for the activelearning style.
Active/Reflective Sensing/Intuitive Visual/Verbal Sequential/Global
Student GenderA 0.84 0.237 .054 0.925
School TypeB 0.032 0.043 0.258 0.509
School GenderB 0.011 0.097 0.285 0.291
Table 17: Influence of Student Gender, School Type and School Gender on PLS
AMann-Whitney U Test BKruskal-Wallis H Test
R
Discussion.
As the findings of the study shows that learning style differences are evident between the various school types and gender. As a result the need for varied strategies in terms of the implementation of suitable design
pedagogies further highlights the need for reform in order to redress the current pedagogical practices of design education in Technology education with respect to the PLS.
The PLS study has revealed that:
• The predominant preferential learning styles of students in Technology education are active and visual, which correlate with other studies (Felder and Spurlin 2005). This finding provides a further similarity between engineering and design in terms of similar learning preference of students. The other two domains; sensing-intuitive and sequential-global are not significant in difference. Therefore this warrants further research which was similarly discovered by Felder.
“The correlation between the sensing-intuitive and
sequential-global scales is not unexpected.”(Richard M.
Felder, 2005, p.108)
• PLS were analysed from a series of perspectives; gender and school type (Table 18).
• There was no significant difference between males and females in terms of PLS.
• In terms of the school type differences did occur. These differences contradict the ‘norm’ stereotype for the various school types.
• There was a difference also between gender for the various types; single sex male, single sex female and co-educational.
Conclusion
In the context of an improved pedagogy for design activity in relation to technology education in the Irish second level education system a number of impacting factors were considered. For the cognate area of engineering
practical and theoretical, at third level, consideration of preferential learning styles proves to be beneficial. Design of instructional media which catered for preferential learning styles at this level reflected a significant improvement in students performance (Felder, Felder et al. 1995; Seery, Gaughran et al. 2003). As part of devising an appropriate design activities pedagogy it was felt that establishing the dominant PLS of the student cohort could contribute significantly to an improved pedagogy. The findings revealed that for a representative cross-section of participants in design activity in technology education that a dominant style has emerged. This learning style, active and visual, is now being used to inform the development of a best-practice pedagogy in the context of design problem solving and creative activity, where compatibility between instructional media and methodologies, and how the participating students prefer to learn is a prime consideration. The development and application of the strategic tutorial intervention tool is expected to significantly enhance the learning experience of the participants, particularly in the cognitive processing associated with ‘designerly ways of thinking’.
References
Atkinson, S. (2004). A Comparison of the Relationship Between Creativity, Learning Style Preference and Achievement at GCSE and Degree Level in the Context of
Design and Technology Project Work. DATA International
Research Creativity and Innovation Conference 2004
Atman, C. J., D. Kilgore, et al.(2008). "A mixed-methods study of engineering designers' use of language." Journal
Of Engineering Education97(3): 309-326.
Barlex, D. (2002). Questioning the design and technology
paradigm. Design & Technology Association International
Research Conference.
Caban, G. and J. Wilson (2004). Understanding learning styles: implications for design education in external settings.
Table 18: Differences between various variables and PLS Difference in values for PLS
PLS Male & Female School Gender Co-ed & single sex male
Co-ed & Single sex female
School Type
A-R No Difference Difference No Difference Difference Difference
S-I No Difference No Difference No Difference No Difference Difference
V-V Difference No Difference Difference Difference No Difference
S-G No Difference No Difference No Difference No Difference No Difference
R
Coffield, F., D. Moseley, et al. (2004). Learning styles and pedagogy in post-16 learning. A systematic and critical review, Learning and Skills Research Centre supported by the Learning and Skills Council and the Department for Education and Skills.
Coffielda, F., D. Moseley, et al. (2004). Learning styles and
pedagogy in post-16 learning. A systematic and critical review, Learning and Skills Research Centre supported by the Learning and Skills Council and the Department for Education and Skills.
Coffieldb, F., D. Moseley, et al. (2004). Should we be using
learning styles? What research has to say to practice, Learning and Skills Research Centre supported by the Learning and Skills Council and the Department for Education and Skills.
Cook, D. A. (2008). "Scores From Riding’s Cognitive Styles Analysis Have Poor Test–Retest Reliability." Teaching and
Learning in Medicine20(3): 225 – 229.
Cross, N. (1989). Engineering Design Methods, John Wiley & Sons Ltd.
Department of Education and Science, I. (2005). Looking at Irish at Junior Cycle. Teaching and Learning in Post-Primary Schools. DES, Inspectorate.
Dunn, R. (2003b). The Dunn and Dunn Learning Style Model: Theoretical Cornerstone, Research and Practical Applications in S. Armstrong, S. Rayner, M. Graff, E. Sadler-Smith, C. Lashley, M. Schiering E. Peterson & D. Spencer
(eds.). ELSIN 2003-Bridging Theory and Practice, The
University of Hull, Hull.
Dunn, R. and S. A. Griggs (1995). Multiculturalism and
Learning Style: Teaching and Counseling Adolescents,
Greenwood Press
Felder, R., M., and Brent, R., (2005). "Understanding Student Differences." Journal of Engineering Education
94(1): 57-72
Felder, R. M., G. N. Felder, et al. (1995). "A Longitudinal Study of Engineering Student Performance and Retention. III. Gender Differences in Student Performance and Attitudes." Journal of Engineering Education84(2): 151-163
Felder, R. M. and L. K. Silverman (1988). "Learning and Teaching Styles in Engineering Education." Engineering
Education78(7): 674-681.
Felder, R. M. and J. Spurlin (2005). "Application, Reliability and Validity of the Index of Learning Styles." International
Journal of Engineering Education21(1): 103-112.
Graf, S., S. R. Viola, et al. (2007). "In-Depth Analysis of the Felder-Silverman Learning Style Dimensions." Journal of
Research on Technology in Education40(1).
Gregorc, A. F. (1979). "Learning/teaching styles: Potent forces behind them." Educational Leadership36(4): 234-236.
Henson, K. T. and P. Borthwick (1984). "Matching Styles: A Historical Look." Theory into Practice23(1): 3-9.
Hunt, D. E. (1979). Learning style and student needs: An introduction to conceptual level Student learning styles:
Diagnosing and prescribing programs. , Reston, VA.:
National Association of Secondary School Principles.: 87-91.
James, W. B. and D. L. Gardner (1995). "Learning Styles: Implications for Distance Learning." New Directions for
Adult and Continuing Education67: 19-31.
Jones, J. C. (1980 ). Design Methods: Seeds of Human
Futures, John Wiley & Sons. New York Toronto Chichester
Brisbane.
Keefe, J. W. (1979). Learning Style: An Overview.
Kimbell, R. (1982). Design Education: the foundation years
London: Routledge and Kegan Paul.
Kimbell, R. and D. Perry (2001). Design and Technology in a knowledge society. Design and technology a distinctive
model of teaching and learning. . London, Engineering
Council.
Kristinsdóttir, S. B. (2000). Technology in Education. Media, Social Factors and the Future of Learning. Degree
of M.A, The University of Hull: 70.
Kuljis, J. and F. Liu (2005). A Comparison of Learning Style
Theories on the Suitability for elearning.Web Technologies,
Applications, and Services, Calgary, Alberta, Canada.
Lattu, M. (2000). The Nature of Finnish Technology Education, University of Helsinki, Department of Teacher Education.
R
OECD and N. Gallagher (2003). Education at a Glance. Teacher Education, Organisation for Economic Cooperation and Development
Owen-Jackson, G. (2002). Teaching Design and Technology in Secondary Schools.
Pink, D. H. (2006). A whole new mind. Why right brainers
will rule the future, Penguin Books Ltd.
Price, G. E. (1980). Which learning style elements are stable and which tend to change over time? Learning
Styles Network Newsletter. 1 (3): pp: 1.
Sarasin, L. C. (1998).Learning style perspectives: impact in
the classroomMadison, WI: Atwood Pub.
SEC (2006). Junior Certificate Examination – Metalwork. Ordinary Level and Higher Level Chief Examiner's Report., State Examinations Commission.
Seery, D. N. (2005). An innovative computer assisted learning intervention based on students preferential learning styles in a practical engineering environment.
Manufacturing and Operations Engineering Department.
Limerick, University of Limerick. Doctor of Philosophy.
Seery, N., W. F. Gaughran, et al. (2003). Multi-Modal Learning in Engineering Education. American Society for Engineering Education Annual Conference and Exposition., Nashville, TN.
Sternberg, R. (1999). Thinking Styles.
Sternberg, R. (2001). Perspectives on Thinking, Learning
and Cognitive Styles, Lawrence Erlbaum Associates,
Publishers, Mahwah, NJ. London. .
Suh, N. P. (1990). The Principles of DesignNew York: Oxford University Press.
Thieme, H. and A. G. C. V. Boeijen (2008). Some students
are more different than others. New Perspectives in Design
Education, Universitat Politecnica de Catalunya, Barcelona, Spain.
Vygotsky, L. S. and M. Cole (1978). Mind in society the
development of higher psychological processes.,
Cambridge, MA: Harvard University Press.
Zywno, M. S. (2003).A contribution to validation of score meaning for Felder-Solomon's index of learning styles.
American Society for Engineering Education Annual Conference & Exposition, American Society for Engineering Education.
Acknowledgement
This research is funded by IRCSET, The Irish Research Council for Science, Engineering and Technology.
[email protected] [email protected] [email protected]