PLEASE SCROLL DOWN FOR ARTICLE
This article was downloaded by: [Lin, Ching-Chung]On: 11 November 2008
Access details: Access Details: [subscription number 905244314] Publisher Routledge
Informa Ltd Registered in England and Wales Registered Number: 1072954 Registered office: Mortimer House, 37-41 Mortimer Street, London W1T 3JH, UK
Applied Financial Economics
Publication details, including instructions for authors and subscription information:
http://www.informaworld.com/smpp/title~content=t713684415
The impact of lifting the short-sale price restriction on volatility and liquidity in
Taiwan
Ching-Chung Lin a
a Kao Yuan University, Department of Business Administration,, Kaohsiung, Taiwan First Published:November2008
To cite this Article Lin, Ching-Chung(2008)'The impact of lifting the short-sale price restriction on volatility and liquidity in Taiwan',Applied Financial Economics,18:20,1657 — 1665
To link to this Article: DOI: 10.1080/09603100701720401 URL: http://dx.doi.org/10.1080/09603100701720401
Full terms and conditions of use: http://www.informaworld.com/terms-and-conditions-of-access.pdf
This article may be used for research, teaching and private study purposes. Any substantial or systematic reproduction, re-distribution, re-selling, loan or sub-licensing, systematic supply or distribution in any form to anyone is expressly forbidden.
The publisher does not give any warranty express or implied or make any representation that the contents will be complete or accurate or up to date. The accuracy of any instructions, formulae and drug doses should be independently verified with primary sources. The publisher shall not be liable for any loss, actions, claims, proceedings, demand or costs or damages whatsoever or howsoever caused arising directly or indirectly in connection with or arising out of the use of this material.
The impact of lifting the short-sale
price restriction on volatility and
liquidity in Taiwan
Ching-Chung Lin
Department of Business Administration, Kao Yuan University, Kaohsiung, Taiwan
E-mail: [email protected]
The restriction of short-sale prices, which states that short-sale prices must not be lower than the closing price of the previous trading day, no longer applies to the constituent stocks of the Taiwan Top 50 Index. This study investigates the impact of restriction lifting on the trading activities and volatilities of those component stocks. The empirical results show that while the trading activities of those component stocks do not change, their volatilities increase significantly. Moreover, stocks with a lower percentage of margin transactions experience higher volatility.
I. Introduction
According to the information presented on the Taiwan Stock Exchange Corporation (TSEC) web-site, the percentage of margin transactions (including margin purchases and short sales) to the double trading value of Taiwan’s stock market was as high as 33.4% by May 2007. This figure indicates that margin transactions play a very important role in the trading activity of the Taiwanese market. However, because margin transactions involve a higher financial lever-age risk, they are often highly regulated by margin requirements, maintenance margins, maximum loan value and short-selling restrictions.
Because the economic environment fluctuates, the authority also adjusts those margin transaction policies or restrictions to keep the stock market working smoothly. Margin requirements are adjusted more frequently than other regulations; thus, many studies investigate the impact of margin requirement adjustments on market volatility. However, the empirical results of previous studies have not arrived at a consistent conclusion. For example, Hardouvelis (1990) finds a negative correlation between margin requirements and market volatility, while Hsieh and
Miller (1990) claim that a higher margin requirement does not result in lower market volatility. Besides, some works focus on the policy effects of short-selling restrictions. Lamba and Ariff (2006) analyse the effects of short-selling restrictions on the price formation process, and Hueng (2006) shows evidence that heavier trading predicts a more negatively skewed return.
This study focuses on regulation in the form of short-sale price restriction. In order to stabilize the Taiwanese stock market during the Asian financial crisis in 1998, the Ministry of Finance in Taiwan announced the restriction of short-sale prices on 4 September 1998. Although this policy effectively reduced the short-selling pressure during a bear market, it also weakened the ability of the trading mechanism to reflect market situations. To increase the liberalization and internationalization of Taiwan’s financial market, many regulations have been adjusted. Since 16 May 2005, the constraint of short-sale prices no longer applies to the constituent stocks of the TSEC Taiwan Top 50 Index (hereafter Taiwan 50 Index). When the list of the component stocks changes, the new policy automatically applies to the updated constituents.
Applied Financial EconomicsISSN 0960–3107 print/ISSN 1466–4305 onlineß2008 Taylor & Francis 1657 http://www.informaworld.com
DOI: 10.1080/09603100701720401
The Taiwan 50 Index was launched on 29 October 2002, and was developed under the collaboration of the TSEC and the Financial Times Stock Exchange (FTSE) International Limited. The Taiwan 50 Index covers 50 of the most highly capitalized blue chip stocks, which represent nearly 70% of the Taiwanese stock market value. The TSEC Taiwan Index Series Advisory Committee manages and reviews the Taiwan 50 Index. Although the Index is comprised of a fixed number of stocks, the TSEC readjusts these constituent stocks every quarter to closely monitor and track the pulse of the market; thus, the 50 stocks are not themselves permanently fixed. Whenever the top 50 stocks in terms of market value are changed, constituent changes are implemented.
Changing economic environments and situations may result in different investing strategies and price behaviours. Therefore, one of the major concerns of empirical studies is exploring the impact of changed policies, events or new financial instruments on current markets.1Because investors are now allowed to short-sell constituent stocks when prices are lower than the previous day’s closing price, this study analyses whether the trading activities and volatilities of component stocks change with the restriction lifting of short-sale prices. This issue is worth investigating because of the importance of margin transactions to the Taiwanese stock market.
According to the statistics provided by the TSEC, individual investors contributed as much as 90% of the trading value of the Taiwanese stock market at the end of 2000. Although this percentage has been decreasing over the past few years, it remained at 64.9% as of May 2007. Under the current regulation of maximum loan value of margin trade, individual investors become the major users of margin transac-tions. Therefore, a close relationship exists between the activity of margin transactions and the perfor-mance of Taiwan’s stock market. Technical analysts often use the balances of margin purchases and short sales to forecast market trends. By not making it utterly convenient for investors to short-sell stocks, regulators have reduced the impact of the 1998 Asian financial crisis. However, this policy restricts the investing strategies of the most important investor group, creating asymmetrical trading mechanisms for bull and bear investors and possibly upsetting the price-making mechanism.
Although it applies only to the constituent stocks of the Taiwan 50 Index, the lifting of short-selling price constraints on 16 May 2005 revealed that the
Taiwanese stock market was becoming a more liberal-ized market. This study investigates changes in the trading activity and volatility of the constituent stocks of the Taiwan 50 Index after deregulation. The empirical result of volatility has an important implication for future policy-making. Conventionally speaking, many policy-makers treat volatility as risk, while some researchers argue that higher volatility represents increased information flow (Ross, 1989). If the deregulation of short-sale prices does not significantly increase volatility or following the pre-vious Ross’s argument, regulators should consider allowing more stocks, e.g. the constituent stocks of the TSEC Taiwan Top 100 Index, to be included in future policies. On the contrary, if the volatilities of component stocks increase significantly and increased volatility is undesirable, regulators should cautiously choose both the timing and the companies for future policies to reduce the possible impact.
The remainder of this study is organized as follows. Section II reviews some literature concerning the impact of margin transaction policy and the relation between volatility and information. Section III presents the data and outlines the volatility measure and research steps. Section IV discusses the empirical results, and the last section provides some concluding remarks.
II. Impact of Margin Transaction Policy
Many studies concerning margin transaction policies have focused on the impact of margin requirement adjustment on the volatility of the stock market. Studies concerning short-selling price restrictions are rare. Some researchers believe there is a negative relation between margin requirements and stock volatility. Hardouvelis (1990) reports that higher or rising margin requirements are associated with lower stock price volatility in the US stock market. He concludes that margin requirements are an effective policy tool for curbing speculation. Hardouvelis and Peristiani (1992) documented that an increase in margin requirements is followed by a decline in the conditional volatility of daily returns in the Tokyo Stock Exchange.
Hardouvelis and Theodossiou (2002) examine the asymmetric relation between margin requirements and stock market volatility across bull and bear
1
For example, Edwards (1988) investigates the impact of S&P 500 index futures on the volatility of index spot. Chakravarty
et al. (2004), Hegde and McDermott (2004) and Mun (2005) deal with the issues of tick-size change, introduction of exchange-traded funds and the 9/11 attack.
1658
C.-C. Lin
markets and find that higher margin requirements are associated with lower stock market volatility during normal and bull periods. They conclude that, to enhance liquidity and avoid an inverse pyramid effect in stock prices, margin requirements should be lowered in sharply declining markets.
Contrary to the empirical results of previous studies, Hsieh and Miller (1990) find no reliable evidence that margin changes affect market volatility in the short or long term. They argue that margin requirements are not an effective tool for dampening stock market volatility. Seguin and Jarrell (1993) present a similar argument. Because of the variety of credit sources available, restrictions and limits on the use of margin trade would encourage substitution into other sources of credit. Seguin and Jarrell (1993) conclude that, although reducing volatility through higher margin requirements is simple, it is probably unwise.
Among local researchers, Yaoet al. (1999) present evidence that margin requirements create a liquidity effect; that is, higher margin requirements increase rational investors’ transaction costs and result in lower liquidity and higher volatility. On the contrary, using Initial Pricing Offering (IPO) stocks in the over-the-counter market, Gong and Wu (2000) found that the stock prices and volatility of most IPOs do not significantly change after becoming eligible for margin trades in the Taiwanese stock market.
In summary, the empirical results of studies concerning the relationship between margin require-ments and price volatility have not arrived at a consistent conclusion. However, many financial studies imply that, because it represents risk, volatil-ity is not desirable. Is this a fair characterization? Some researchers have argued that the relation between information and volatility should be con-sidered. Because available information decides stock prices, the change in information flow would affect price volatility.
Assuming a no-arbitrage situation, Ross (1989) derives a model to explore the relation between information flow and price volatility. His model shows that
p2¼2s ð1Þ
wherepandsrepresent the SDs of stock price and
information flow, respectively. Equation 1, which is Theorem 2 in Ross (1989), states that the price variance should equal the rate of information flow. The implication of this argument is that the volatility
of prices increases as the rate of information flow increases. If this is not the case, arbitrage is possible. Therefore, while some studies view volatility negatively, Ross (1989) argues that the volatility of prices is directly related to the rate of information flow to the market.
III. Methodology Data
The study period is from 1 January 2005 to 29 July 2005. Because the new policy of short-sale prices was implemented on 16 May 2005, the pre-period is from 1 January 2005 to 15 May 2005, and the post-period is from 16 May 2005 to 29 July 2005. The main reason for this study period is as follows. The TSEC changed the tick sizes on 1 March 2005.2Because the change in tick sizes might have affected stock prices, the study may have revealed biases if the sample period had included the adjustment of tick sizes. To control the possible effect of tick-size change, this study only uses trading data collected after the tick-size adjustment.
The sample companies are the constituent stocks of the Taiwan 50 Index. As mentioned in Section I, these stocks are not permanently fixed because of the change in market values. During the study period, 46 stocks remained on the list of constituent stocks. Because of the restriction lifting of short-sale prices applied to those 46 companies during the study period, they serve as the sample companies.
The study employs daily trading values and intra-day 5 min prices to evaluate the trading activity and the volatility of stock, respectively. Stock specifica-tions and daily trading values are downloaded from the TSEC website and the database of Taiwan Economic Journal. The tick-by-tick trading informa-tion bought from the TSEC is reorganized into the intraday 5 min price series for volatility measure. Because the daily trading time is from 9:30 a.m. to 1:30 p.m., 54 5 min observations are conducted each day. Because there are 106 trading days and 54 5 min prices per day, the sample size for each company is 5724 (¼10654).
Researching method
This study uses daily trading value,Value, to evaluate the trading activity. The methodology proposed by
2
Before 1 March 2005, the matches of stock pricep and tick size were (p55, 0.01), (5p515, 0.05), (15p550, 0.1), (50p5150, 0.5), (150p51000, 1) and (1000p, 5). Now, the relations are adjusted as (p510, 0.01), (10p550, 0.05), (50p5100, 0.1), (100p5500, 0.5), (500p51000, 1) and (1000p, 5).
Andersen, Bollerslev, Diebold and Labys (ABDL 2001b; hereafter) is used to measure the daily volatility of stock. The changes in trading activity and price volatility after the restriction lifting are investigated by difference ratios, while a cross-sectional analysis is used to determine whether the change patterns are similar among stock groups with different specifications.
Volatility measure. Some early works sum the daily
squared returns to estimate monthly volatilities, for example, French et al. (1987), Schwert (1989) and Schwert and Seguin (1990). Because of the recent availability of high-frequency data, Taylor and Xu (1997) use intraday 5 min squared returns to estimate daily volatility. However, no formal justification has been provided for using this simple method of summing squared returns (Andersenet al., 2001b).
Andersen et al. (2001b) develop realized volatility to measure volatility over the interval of interest. In theory, the diffusion parameters for a continuous time diffusion process can be accurately estimated with sufficiently finely sampled observations. By sampling intraday returns sufficiently frequently, the realized volatility can closely approximate the under-lying integrated volatility, which is the integral of instantaneous volatility over the subject interval. Assuming that the log price p follows continuous time stochastic volatility diffusion and applying the theory of quadratic variation, Andersenet al. (2001b) shows that X ½h= j¼1 r2tþj Zh 0 t2þd!0 ð2Þ
wherertþj¼ptþjptþðj1Þ,represents the fixed
interval between two observations in periodh, [h/] is the number of sampled observations for periodhand the integrated volatility, R0h2
tþd, indicates the true
latent h-period volatility. Given sufficiently frequent sampling, or when !0, then the squared returns can be summed to constructex postrealized volatility for the integrated latent volatilities.
In theory, the sample frequency should be maximized in the model. However, Andersen et al. (2001a, b) use 5 min intraday data to compute the realized volatilities. Andersen et al. (2001b) claim that sampling at 5 min intervals is sufficient to ensure that there is minimal measurement error in the daily realized volatilities, while also preventing microstructure biases from becoming a concern. Following the argument of Andersen et al. (2001b), this study also uses 5 min data to estimate the daily
volatility of the constituent stock of the Taiwan Top 50 Index.
The computation of ABDL volatility is as follows. First, the intraday 5 min return is defined as
ri,t,m¼pi,t,mpi,t,m1 ð3Þ
wherepi,t,mrepresents them-th natural logarithm 5 min
price of stockiat dayt,ri,t,mindicates them-th 5 min
return of stockiat dayt,t2(1, 106) andm2(1, 54).3 The realized volatility proposed by Andersenet al. (2001b) used in this study to measure the volatility of stockiat timetis
ABDLi,t¼ X54
m¼1
r2i,t,m ð4Þ
That is, this study constructs estimates of daily volatility by summing 54 squares of intraday 5 min returns.
Change analysis. Liquidity Difference Ratio (LDR)
and Volatility Difference Ratio (VDR) are defined to examine changes in trading value and price volatility, respectively. The LDR and VDR of stock i are calculated as LDRi¼ln Valuepost,i Valuepre,i ! and VDRi¼ln ABDLpost,i ABDLpre,i ! ð5Þ
where Valuepre,iand Valuepost,irepresent the average
daily trading values of stock i before and after the policy adjustment, ABDLpre,iand ABDLpost,iare the
Andersenet al. (2001b) volatilities for two subperiods and ln(.) denotes the natural logarithm function. A positive LDRi(VDRi) indicates that the trading value
(volatility) of stock i increased after the restriction lifting.
If the restriction adjustment of short-sale prices does not systematically affect the trading values and volatilities of the constituents, the average LDR or VDR of all stocks should equal zero. This work employs aZ-test to test the null hypothesis that the average LDR (VDR) equals zero. When the average LDR (VDR) is significantly positive, the overall trading value (volatility) of the constituents of the Taiwan 50 Index increases. This study also uses a sign test to prove the null hypothesis that the percentage of companies with increased volatility is 50%.
Cross-sectional analysis. Because the constituent
companies of the Taiwan Top 50 Index differ in
3There are 54 5 min intraday data for each trading day in Taiwan.
1660
C.-C. Lin
terms of sector and margin trade behaviour, the effects of lifted price restrictions may not be consistent from one stock to another. By grouping stocks based on margin transaction behaviour and sector, cross-sectional analysis can be used to examine the impact patterns of various categories.
Based on the average daily margin ratio from March 2005 to July 2005, the 46 sample stocks are equally divided into three groups. The categories of high, medium and low percentage contain stocks with margin transaction ratios above 27.14%, 11.9– 25.27% and below 11.3%, respectively. The number of companies in each group is 15, 16 and 15. The electronic and the financial sectors are the most active industries in Taiwan, and they contribute around 70 and 10% of trading value of the TSEC, respectively. Therefore, sector categories are established as elec-tronic, financial and mixed (including food, auto-mobiles, chemicals, etc.) sectors, containing 21, 13 and 12 companies, respectively.
Analysis of Variance (ANOVA) is used to inves-tigate any differences among the average LDRs (VDRs) of stocks in different categories. Additionally, this study uses the 2-test on the null hypothesis that the percentages of companies with increased trading value (volatility) are equal among different groups.
IV. Empirical Results Preliminary statistics
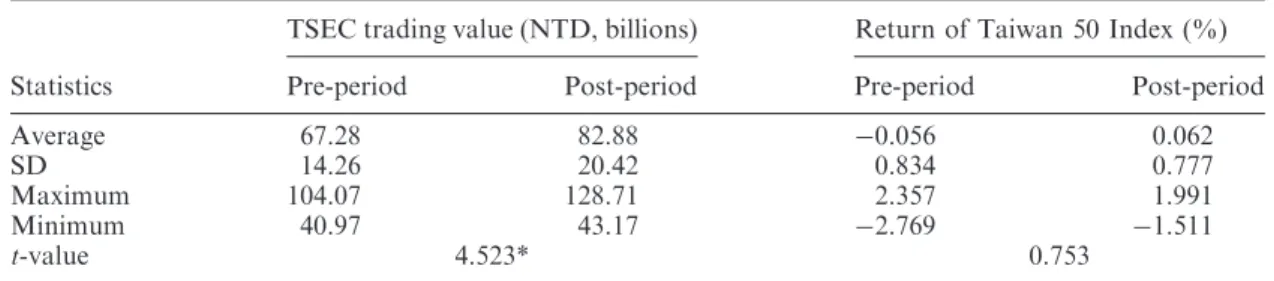
The left column of Table 1 shows the preliminary statistics of daily trading value of the TSEC market. Both the maximum and the minimum daily trading values are higher in the post-period. The average daily trading value during post-period is 82.88 billion, which is significantly higher than the pre-period trading value of 67.28 (t-value¼4.523). This result
indicates that the TSEC trading is more active in the post-period than in the pre–post period. However, this evidence does not indicate that the deregulation of short-sale prices would have a positive effect on the trading activity of individual stocks. Rather, when a market is going up, the trading activity of individual stock often follows the trend. An observed increased trading value in the post-period may have been caused by the market trend, not deregulation. Therefore, the market factor may need to be considered when investigating the effect of lifting the short-selling price restriction on individual stocks.
The right column of Table 1 lists the daily return of the Taiwan 50 Index. Based on the figures of SD, maximum and minimum, the Taiwan 50 Index fluctuates more widely in the pre-period than in the post-period. Meanwhile, the difference of average daily return is not significant (t-value¼0.753). Thus, the new policy of short-selling prices does not significantly change the daily volatility of the portfolio of sample stocks. However, the effect on the intraday price behaviours of individual stocks could be cancelled out when observing only the daily performance of the Taiwan 50 Index. The following subsection of impact on volatility discusses using the intraday data for individual stocks.
Impact on trading activity
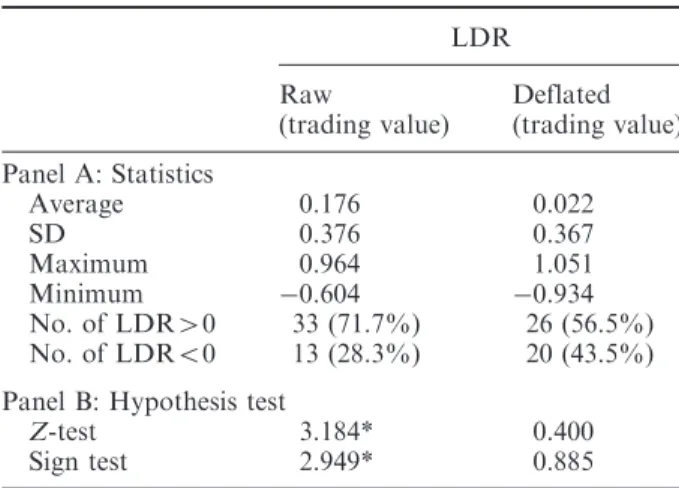
Table 2 reports the statistics of LDR. As defined in Equation 5, a positive (negative) LDR represents an increased (decreased) daily trading value in the post-period. The left column of Table 2 uses the raw trading value to evaluate the trading activity of sample stocks. The maximum increase in trading value is 96.4%, and the maximum decrease is 60.4%. The average LDR is 0.176, indicating that the trading value in the post-period increased by an average of 17.6%. During the post-period, 33 (71.7%) compa-nies have more trading values than they do during the
Table 1. Preliminary statistics of daily trading
TSEC trading value (NTD, billions) Return of Taiwan 50 Index (%)
Statistics Pre-period Post-period Pre-period Post-period
Average 67.28 82.88 0.056 0.062
SD 14.26 20.42 0.834 0.777
Maximum 104.07 128.71 2.357 1.991
Minimum 40.97 43.17 2.769 1.511
t-value 4.523* 0.753
Notes: The pre-period is from 1 March 2005 to 13 May 2005 and the post-period is from 16 May 2005 to 29 July 2005. Thet-value is to test the hypothesis that the averages of pre- and post-periods are the same. NTD: New Taiwan Dollar.
*Significant at the 1% level.
pre-period, while only 13 (28.3%) stocks decrease in value. The Z-value of 3.184 means the average trading value increases significantly. The sign test reveals that there are far more companies with increased rather than decreased trading values in the post-period.
When using the raw trading value to measure the trading activity of stock, the liquidity of sample stocks increased significantly following the deregulation of short-sale prices. However, this conclusion does not take into consideration the market situation. The market trading value also increased sharply during the post-period; hence, the increased trading value may have been due to the market atmosphere, not the restriction lifting. To eliminate the market factor, the deflated trading value, which is the raw trading value deflated by the TSEC trading value, is used.
The right column of Table 2 lists the LDR result of deflated daily trading value. Usage of the deflated trading value results in a higher maximum of 1.051, as well as a lower minimum of 0.934. The number of companies experiencing increased trading activity during the post-period decreases to 26 (56.5%), while that of stocks having decreased liquidity increases to 20 (43.5%). Neither the Z-test nor the sign test is significant, showing that, after considering the market factor the liquidity of the Taiwan 50 Index did not increase during the post-period.
Although the average liquidity of sample stocks changed little after the short-selling price deregulation, it is possible that the liquidity changes of companies with different characteristics are different. The follow-ing cross-sectional analysis explores this possibility. Table 3 represents the ANOVA result for the trading activity of different categories. Panel A shows the ANOVA analysis comparing the average LDRs of the three-sector categories. Only the average LDR of electronic category is positive, indicating that the liquidity of electronic stocks increases.
However, because the ANOVA F-value of 0.391 is not significant, LDR does not differ significantly among the three-sector categories. The ANOVA result of margin transaction category shown in Panel B of Table 3 is also insignificant. Statistically speaking, liquidity change does not differ significantly among the three-margin transaction categories. However, one interesting pattern deserves a closer look. The average LDRs of high-, medium- and low-margin transaction categories are 0.072, 0.038 and 0.025, respectively. The higher the ratio of margin transaction value to double trading value, the higher the increase in liquidity after the price restriction was lifted. If the
Table 3. ANOVA analysis for trading activity
Category
Panel A: Sector Electronic (21) Financial (13) Mixed (12)
Average LDR 0.082 0.010 0.022
ANOVAF-value 0.391
Panel B: Margin transaction High (15) Medium (16) Low (15)
Average LDR 0.072 0.038 0.025
ANOVAF-value 0.258
Note: The figures in parentheses indicates the number of companies in each category. The mixed group includes food, automobile, chemical companies and so on. The high, medium and low groups contain stocks with percentages of margin transaction of total trading value above 27.14%, 11.9–25.27% and below 11.3%, respectively.
Table 2. Statistics of changes in trading activity
LDR Raw (trading value) Deflated (trading value) Panel A: Statistics Average 0.176 0.022 SD 0.376 0.367 Maximum 0.964 1.051 Minimum 0.604 0.934 No. of LDR40 33 (71.7%) 26 (56.5%) No. of LDR50 13 (28.3%) 20 (43.5%)
Panel B: Hypothesis test
Z-test 3.184* 0.400
Sign test 2.949* 0.885
Notes: The LDR of stockiis defined as the average daily raw (deflated) trading value ($) of post-period divided by that of pre-period. The pre-period is from 1 March 2005 to 13 May 2005 and the post-period is from 16 May 2005 to 29 July 2005. The daily deflated value of stockiis deflated by the trading value of TSEC. LDR40 represents the trading value of stockiincreased following the adjustment of short-sale price restriction, while LDR50 indicates decreased trading activity. The null hypothesis ofZ-test is that the average LDR equals zero, and that of sign test is that the percentage of stocks with increased trading value is 50%. *Significant at the 1% level.
1662
C.-C. Lin
adjusted policy of short-sale prices is applied to more stocks in the future, the study provides evidence that the policy would have stronger positive effects on stocks with more margin transactions.
Impact on volatility
Before analysing the volatility change for individual stocks, the market volatility has to be examined first to investigate the possible market effect. The daily realized volatilities of the Taiwanese stock market in the pre- and post-periods are 5.88105
and 5.31105, respectively. The difference between these two figures is not significant (t-value¼0.533). The daily realized volatilities of the Taiwan 50 Index in the pre- and post-periods are 4.86105 and 5.78105, respectively. Thet-statistic of the differ-ence is also an insignificant value of0.622. Because neither the Taiwanese market nor the Taiwan 50 Index demonstrates a sizeable volatility change, no significant market-wide factor influences the behav-iour of stock prices during the study period. Therefore, the impact of the market factor on the volatility of individual stocks is not considered in the following investigation.
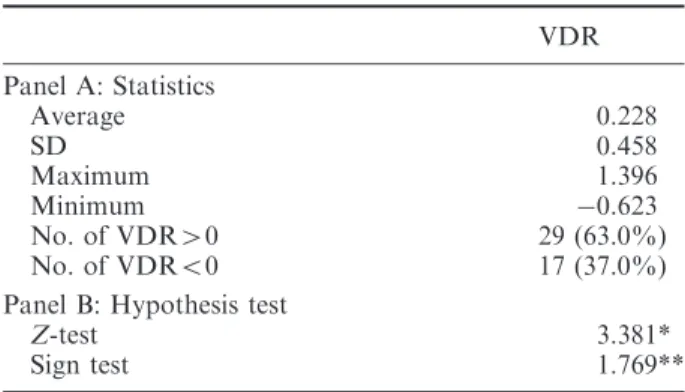
Table 4 lists the statistics of VDR. According to the definition in Equation 5, a positive (negative) VDR represents an increased (decreased) daily realized volatility in the post-period. The maximum increase
in daily volatility is 139.6%, and the maximum decrease is 62.3%. The average VDR is 0.228, indicating that the realized volatility of sample stocks in the post-period increases by an average of 22.8%. During the post-period, 29 (63%) companies experience greater volatility, while only 17 (37%) stocks experience decreased volatility. The significant
Z-value of 3.381 reveals that on the average, volatility significantly increases. The sign test indicates that the number of companies with increased volatility is also significantly higher in the post-period.
The above analysis demonstrates that, on average, the volatilities of the constituents of the Taiwan 50 Index increased after the restriction on short-sale prices was lifted. In Table 1, the daily price changes during the post-period are statistically the same as those from the pre-period. However, Table 4 shows that the intraday price behaviour in the post-period differs from that of the pre-period. The VDR analysis supports the finding that the intraday price move-ment is more volatile in the pre-period. Following Ross’s (1989) argument, because investors are allowed to short sell the constituents of the Taiwan 50 Index, intraday prices reflect all available, and particularly the negative information. Therefore, although the difference between the daily returns of pre- and post-periods is not significant, investors experience a higher intraday volatility in the post-period.
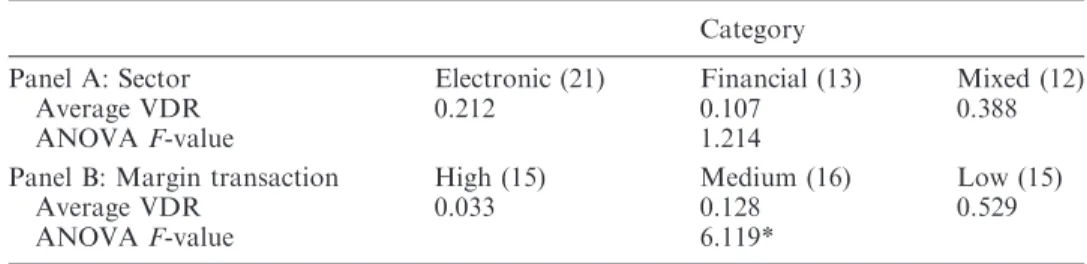
After a significant volatility change, change pat-terns among sectors and margin trade behaviour are investigated further. Table 5 lists the ANOVA analysis of comparing the average VDRs of those categories. The average VDRs of electronic, financial and mixed sectors in Panel A of Table 5 are 0.212, 0.107 and 0.388, respectively. All three sectors are similarly more volatile after the adjustment, as represented by the insignificant ANOVA F-value of 1.214. In other words, lifting the restriction of short-sale prices had a similar effect on different stocks.
Panel B in Table 5 presents the volatility changes of the margin transaction category. The average VDRs of high, medium and low categories are 0.033, 0.128 and 0.529, respectively. These figures reveal that stocks with a lower ratio of margin transaction to total trading value are more volatile. The ANOVA
F-statistic of 6.119 indicates that the volatility changes among the three categories are significantly different. Thus, a stock with more margin transac-tions was less affected by the lifting of short-sale price restrictions. For those stocks with fewer margin transactions, investors’ short-selling behaviour was stimulated by the restriction lifting; thus, the stocks with low margin transactions experienced higher volatility changes.
Table 4. Statistics of changes in volatility
VDR Panel A: Statistics Average 0.228 SD 0.458 Maximum 1.396 Minimum 0.623 No. of VDR40 29 (63.0%) No. of VDR50 17 (37.0%)
Panel B: Hypothesis test
Z-test 3.381*
Sign test 1.769**
Notes: The VDR of stockiis defined as the average daily ABDL volatility of post-period divided by that of pre-period. The daily ABDL volatility of stock i is calculated as the summation of squared 5 min intraday returns (Equation 3). The pre-period is from 1 January 2005 to 13 May 2005 and the post-period is from 16 May 2005 to 29 July 2005. VDR40 represents the volatility of stock i increased following the adjustment of short-sale price restriction, while VDR50 indicates decreased volatility. The null hypothesis ofZ-test is that the average VDR equals zero, and that of sign test is that the percentage of stocks with increased volatility is 50%. * and ** denote significance at the 1 and 5% levels, respectively.
V. Conclusions
The ratio of margin transactions to the double trading value of Taiwan’s stock market was as high as 33.4% by the end of May 2007. This figure indicates that margin transactions play a very important role in the trading activity of the Taiwanese market. However, because margin trans-actions involve a higher financial leverage risk, various regulations have been established. The restriction of short-sale prices, stating that the short-sale prices cannot be lower than the closing price of the previous trading day, is one such regulation. Since 16 May 2005, the constraint no longer applies to the constituent stocks of the Taiwan 50 Index.
By investigating the daily trading value and the Andersenet al.’s (2001b) realized volatility, this study examines changes in the trading activities and volatilities of the constituent stocks of the Taiwan 50 Index following deregulation. The empirical evidence indicates that the daily price changes and trading values of sample stocks did not change significantly during the post-period, while the realized volatilities computed by the 5 min intraday data significantly increased.
The result of cross-sectional analysis illustrates that, either in terms of trading value or volatility, no significant difference exists for the stocks from different sectors. This study finds minimal evidence that the trading value for the stocks with a higher margin transaction percentage increased in post-period. Moreover, these stocks experienced less volatility. In other words, for those stocks with lower margin transaction percentages, investors’ short-selling behaviour was stimulated by the restric-tion lifting, resulting in higher volatility changes.
The study has an important implication for policy-makers in the future, namely, allowing more stocks, e.g. the constituent stocks of the TSEC Taiwan Top
100 Index, to be included in this new policy. Following Ross’s (1989) argument, allowing short-selling prices to be lower than the previous closing price will increase the rate of information flow, and thus, the volatility of prices. Furthermore, for stocks with a higher level of margin transactions, the new policy would have a stronger effect on trading activity and a weaker effect on volatility than on those stocks with a lower percentage of margin trades.
Acknowledgement
The financial support was from the National Science Council in Taiwan (Project No. NSC 95-2416-H-244-003).
References
Andersen, T. G., Bollerslev, T., Diebold, F. X. and Ebens, H. (2001a) The distribution of realized stock volatility, Journal of Financial Economics, 61, 43–76.
Andersen, T. G., Bollerslev, T., Diebold, F. X. and Labys, P. (2001b) The distribution of realized exchange rate volatility, Journal of the American Statistical Association,96, 42–55.
Chakravarty, S., Wood, R. A. and Van Ness, R. A. (2004) Decimals and liquidity: a study of the NYSE,Journal of Financial Research,27, 75–94.
Edwards, F. R. (1988) Does futures trading increase stock market volatility?,Financial Analysts Journal,44, 63–9. French, K. R., Schwert, G. W. and Stambaugh, R. F. (1987) Expected stock returns and volatility,Journal of Financial Economics,19, 3–29.
Gong, S. C. and Wu, C. C. (2000) The impact of margin trade on price volatility and efficiency of Taiwan OTC market, Fu Jen Management Review, 7, 161–81 [in Chinese].
Hardouvelis, G. A. (1990) Margin requirements, volatility, and the transitory component of stock prices,
The American Economic Review,80, 736–62.
Table 5. ANOVA analysis for volatility
Category
Panel A: Sector Electronic (21) Financial (13) Mixed (12)
Average VDR 0.212 0.107 0.388
ANOVAF-value 1.214
Panel B: Margin transaction High (15) Medium (16) Low (15)
Average VDR 0.033 0.128 0.529
ANOVAF-value 6.119*
Notes: The figures in parentheses indicates the number of companies in each category. The mixed group includes food, automobile, chemical companies and so on. The high, medium and low groups contain stocks with percentages of margin transaction of total trading value above 27.14%, 11.9–25.27% and below 11.3%, respectively.
*Significant at the 1% level.
1664
C.-C. Lin
Hardouvelis, G. A. and Peristiani, S. (1992) Margin requirements, speculative trading, and stock price fluctuations: the case of Japan, Quarterly Journal of Economics,107, 1333–70.
Hardouvelis, G. A. and Theodossiou, P. (2002) The asymmetric relation between initial margin require-ments and stock market volatility across bull and bear markets,Review of Financial Studies,15, 1525–59. Hegde, S. P. and McDermott, J. B. (2004) The market
liquidity of diamonds, Q’s, and their underlying stocks,
Journal of Banking and Finance,28, 1043–67.
Hsieh, D. A. and Miller, M. H. (1990) Margin regulation and stock market volatility, Journal of Finance, 45, 3–29.
Hueng, J. C. (2006) Short-sales constraints and stock return asymmetry: evidence from the Chinese stock markets,
Applied Financial Economics,16, 707–16.
Lamba, A. S. and Ariff, M. (2006) Short selling restrictions and market completeness: the Malaysian experience,
Applied Financial Economics,16, 385–93.
Mun, K. C. (2005) Contagion and impulse response of international stock markets around the 9/11 terrorist attacks,Global Finance Journal,16, 48–68.
Ross, S. A. (1989) Information and volatility: the no-arbitrage martingale approach to timing and resolution irrelevancy,Journal of Finance,44, 1–17. Schwert, G. W. (1989) Why does stock market volatility
change over time?,Journal of Finance,44, 1115–53. Schwert, G. W. and Seguin, P. J. (1990) Heteroskedasticity
in stock returns,Journal of Finance,45, 1129–55. Seguin, P. J. and Jarrell, G. A. (1993) The irrelevance of
margin: evidence from the Crash of 87, Journal of Finance,48, 1457–73.
Taylor, S. J. and Xu, X. (1997) The incremental volatility information in one million foreign exchange quota-tions,Journal of Empirical Finance,4, 317–40. Yao, H. C., Tu, A. H. and Chen, S. Y. (1999) Margin
adjustment and stock price volatility: evidence from Taiwan,Review of Securities and Futures Markets,11, 129–54 [in Chinese].