MODELING OF MEASURED SELF-SIMILAR NETWORK
TRAFFIC IN OPNET SIMULATION TOOL
M. Fras
1, J. Mohorko
2, Ž. Čučej
21
Margento R&D, Maribor, Slovenia
2
University of Maribor, Faculty of Electrical Engineering and Computer Science,
Maribor, Slovenia
Key words: network traffic, self-similarity, Hurst parameter, long-range dependence
Abstract: The Modeling, analysis and simulation of self-similar traffic has become the main goal of much research work around the world, over the last 15 years. In our research we measured many different types of real traffic in different networks and classified it on the basis of analysis in the sense of self-similarity and long-range dependence. We used estimated statistical parameters for measured network traffic in order to model this traffic in simulation tool OPNET. We used the following statistical criteria for successful modeling: average bit rate, average packet rate, Hurst parameter, and histograms of statistical network traffic processes. During measurements and simulations we discovered that the shape parameter of Pareto distribution has a great impact on simulated traffic, and also that classical estimation usually leads to significant discrepancies between measured and simulated traffic in the sense of average bit rate and also bursts, which are characteristic of self-similar traffic. So, we developed a novel method for estimating the shape parameter of Pareto distribution which shows successful results regarding the chosen criteria, during the testing process.
Modeliranje izmerjenega samopodobnega omrežnega
prometa v simulacijskem orodju OPNET
Kjučne besede: omrežni promet, samopodobnost, Hurstov parameter, dolgo območje odvisnosti
Izvleček: Modeliranje, analiza in simuliranje samopodobnega omrežnega prometa predstavlja osrednji cilj mnogih raziskovalnih del v zadnjih petnajstih letih. V našem članku smo se osredotočili na merjenje različnih tipov samopodobnega omrežnega prometa v različnih omrežjih, z namenom klasifikacije omrežnega prometa na osnovi analize samopodobnosti in dolgega območja odvisnosti. Model izmerjenega samopodobnega omrežnega prometa smo izvedli na osnovi ocenjenih statističnih parametrov porazdelitev naključnih procesov omrežnega prometa v simulacijskem okolju OPNET. Prav tako smo definirali kriterije ujemanja izmerjenega in simuliranega omrežnega prometa kot so povprečna bitna in paketna hitrost, Hurstov parameter ter histograme naključnih procesov omrežnega prometa. Skozi meritve in eksperimente smo ugotovili, da ima parameter oblike Paretove porazdelitve naključnih proces-ov omrežnega prometa velik vpliv na celoten modeliran promet. Pri tem smo prav tako ugotproces-ovili, da že majhna odstopanja v vrednosti omenjenega parametra vodijo do velikih odstopanj med izmerjenim in simuliranim prometom v kriterijih bitne in paketne hitrosti ter izbruhih, ki so značilni za samopodo-bni omrežni promet v današnjih omrežjih. Predlagali smo novo ocenjevalno metodo parametra oblike Paretove porazdelitve, ki ponuja zadovoljive rezultate glede na izbrane kriterije ujemanja izmerjenega in modeliranega prometa.
1.
Introduction
Over 15 years, new models of network traffic have been developed, which have replaced traditional models, such as Poisson and Markov. This self-similar model is based on fractal theory, and can be described using the Hurst parameter and long-range dependence (LRD). The pio-neers on this field are Leland, Willinger, and many others /1/, who introduced the new description of network traf-fic in 1994. The new description appeared as an alterna-tive to traditional models, as were Poisson and Markov /2/. It was shown, that heavy tailed distributions are more suita-ble for describing inter-arrival time and packet-size proc-ess than exponential. So Pareto’s and Weibull’s heavy-tailed distributions became the most frequently used distributions for describing self-similar network traffic /3, 4, 5, 6/. Another aspect of self-similarity and long-range depend-ence appeared with the Hurst parameter. The Hurst pa-rameter represents the measurement of self-similarity and variability of packet arrival rate /3, 7, 8/. There are several different methods for estimating the Hurst parameter which can lead to diverse results /9, 10/.
Over the last decade several studies have been carried-out regarding the analysis of measured traffic. Research-ers found, that network traffic can be best described by self-similarity and long-range dependence /11, 12, 13, 14, 15/. There are research properties of measured traffic for different protocols and applications (HTTP), and video and P2P traffic /6, 17, 29/.
Measuring, analyses and the modeling of self-similar traf-fic has still been one of the main research challenges over recent years. One of the important researchers’ goals is also self similar traffic modeling by simulation communica-tions’ environments, such as OPNET /18, 19, 20, 21/. Many models for generating self-similar traffic are based on fractal models /22, 23/. A lot of research work has also existed, where interest is focused on estimating self-similar network traffic parameters /4, 9, 10, 25/, such are Hurst and distributions, but without verification in simula-tions tools. In such cases there are no possibilities for eval-uating the successful for estimated parameters for simula-tion purposes. In our research we paid exact attensimula-tion to this area of network traffic analysis and modeling. For meas-urement of the similarity between measured and modeled
traffics we chose different criteria, such as average bit rate, packet rate, Hurst parameter (traffic bursts), and also his-tograms of measured and modeled traffic. We also tried to show how well-chosen distribution has an impact on suc-cess of traffic modeling and which properties of network traffic (i.e. H parameter, LRD or SRD) help us to choose the right distribution (heavy or light-tailed) for describing self-similar network traffic.
During analysis and simulations we discovered that classi-cal estimation of packets’ size distribution parameters give parameters which cause significant discrepancy between measured and simulated traffic. This large impact regard-ing discrepancies, between measured histogram and cho-sen distribution, brings maximal packets (MTU) in the pack-ets size process, which is a consequence of the fragmen-tation mechanism of a TCP/IP stack. So we developed a novel method for decreasing these discrepancies. The presented paper is organized as follows. The second section describes the mathematical background of self-similarity and long-range dependence. The next section describes the analytical methods for stochastic self-similar processes such as estimation of Hurst parameter for self-similar processes, and the probability distribution and its parameters. The fourth section describes the modeling of self-similar traffic in the simulation environment OPNET, using different communication devices, using different traf-fic generators mechanisms. In the fifth section, we present novel methods for estimating distributions’ parameters. The sixth section contains the simulation results with compari-son between measured and modeled traffics by OPNET. Finally, we complete this paper with the conclusions.
2.
Self similarity and long range
dependence
The self-similarity model replaced the traditional traffic models, such as the Poisson and Markov traffic models, in many areas. The Poisson process provide good approxi-mation for telephone networks (PSNT networks) when describing the process for the durations of the calls and time between calls. It was widely-used in the past. But these models do not allow for descriptions of bursts which are distinctive in today’s network traffic. Such bursts can be described by a self-similarity model, because it shows bursts over wide-range of time scales. This is in contrast to the traditional traffic model (Poisson model), which became very smooth during the aggregation process.
The most often used definition for self-similarity in many books /3, 7, 24/ intend to the standard time series: Let X = (Xt, t = 0, 1, 2, …) be a covariant stationary sto-chastic process; that is, a process with constant mean, finite variance σ2 = E/(Xt– μ)2/, autocovariance function
γ(k) = E/(Xt– μ)(Xt+k– μ)/, that depends only on k, auto-correlations function r(k):
(1)
Assume X has an autocorrelation function form (≈ means »asymptotic to«)
(2)
where L1(k) is slowly var ying at infinit y, that is
for all x > 0 (i.e., L1(t) = const, L1(t) =
log(t)) .
The measure of self-similarity is the Hurst parameter (H), which is in a relationship with parameter βin equation(3).
(3)
Let’s define the aggregation process for the time series: For each m = 1, 2, 3, … let X(m) = (Xk(m), k = 1,2,..m) denote a new time series obtained by averaging the origi-nal series X over a non-overlapping block of size m. That is, for m=1, 2, 3, …, X(m) is given by /13/:
(4)
Xk(m) is the process with average mean and autocorrela-tion funcautocorrela-tion r(m)(k) /3/.
The process X is called exactly second order with param-eter H, representing measure of self-similarity if the corre-sponding aggregated X(m) has the same correlation struc-tures as X and for all m = 1, 2, … :
for all (5)
The process X is called asymptotically second order with parameter H = 1 – β/2, if for all k it islarge enough,
(6)
From definition 4, it follow that the process is second order self-similar in the exact or asymptotical sense, if their corre-sponding aggregated process X (m) are the same as X or become indistinguishable from X-at least with respect to their autocorrelation function. The most striking property in both cases, exact and asymptotical self-similar processes, is that their aggregated processes X(m) possess a no degenerate correlation structure as m →∝. This is in contrast to the Poisson stochastic models, where their aggregated proc-esses tend to second order pure noise as m →∝:
(7)
Network traffic with bursts is self-similar, if show bursts over many time scales or we can also say over a wide-range of time scales. This is in contrast to traditional models such as Poisson and Markov, where their aggregation process-es become very smooth.
Another property of this process that satisfies relationship (1) is described as long-range dependence (LRD). Let us define second order-self similarity and its autocovariance
γ(k) /1/. Let r(k) = γ(k)/σ2 denote the autocorrelation func-tion. For 0 < H < 1, H ≠ 0.5 it holds that
(8) For values 0.5 < H < 1 autocorrelation function r(k) behaves in asymptotic mean as ck-β for values 0 < β < 1, where c is constant c > 0, β = 2 - 2H, and we have
(9)
The long range dependence of the process is character-ized by slowly decaying autocorrelation function and not summable autocorrelation function. Autocorrelation func-tion decays hyperbolically, as the k increases. This is op-posite to the property of short-range dependence (SRD), where the autocorrelation function decays exponentially and the equation (9) has a finite value. Short and long-range dependence a have a common relationship with the value of the Hurst parameter of the self-similar process /3/, /24/:
- 0 < H < 0.5 →SRD - Short Range Dependence - 0.5 < H < 1 →LRD - Long Range Dependence Self-similarity and long-range dependences’ (LRD) prop-erties are described using heavy-tailed distributions. The shapes of the heavy-tailed distributions (Pareto, Weibull) are hyperbolic, which is in contrast to the light-tailed distri-butions where distridistri-butions decay exponentially.
Pareto is the simplest heavy tailed distribution and has hy-perbolic decay over its entire range. The probability densi-ty function of the Pareto distribution is given by:
(10)
Parameter α is shape parameter, k is the local parameter, which represents the minimum possible positive value for the random variable x. Another very important heavy-tailed distribution is Weibull distribution, which is described by the next-probability density function:
(11)
3.
Analysis methods of the stochastic
self-similar process
3.1
Hurst parameter
Hurst parameter represents the measure of self-similarity and it is estimated for the arrival process of a packet-rate. Exact methods for calculating the value of Hurst parame-ter do not exist, so we can only estimate. There are sever-al methods for estimating Hurst parameter (H) of stochas-tic self-similar processes. But there is no criteria as to which method gives the best results. The most often used meth-ods for Hurst parameters’ estimation are /3, 9, 24, 25/: - Variance method is a graphical method, which is
based on the property of slowly decaying variance. In a log-log scale plot, we draw sample variance versus a non-overlapping block of size m for each
aggrega-tion level. From the line with slope â we can estimate Hurst parameter as a relationship, from equation (3). - R/S method is also a graphical method. It is based on a range of partial sums regarding data series ations from mean value, rescaled by its standard devi-ation. The slope in the log-log plot of the R/S statistic versus aggregated points is the estimation for Hurst parameter.
- Periodogram method plots spectral density in loga-rithm scale versus frequency and also in logaloga-rithm scale. The slope in periodogram allows the estima-tion of parameter H.
Variance and R/S methods represent estimators within the time-domain, which are based on a relationship between a specific statistical data series’ properties and the aggre-gation process with an overlapping block of size m (4).
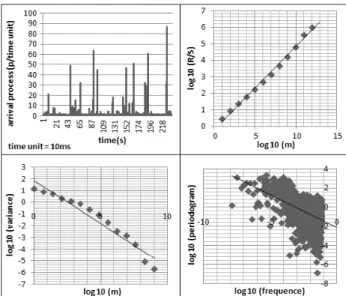
The periodogram method represents the estimator within frequency domain. Every method gives a different estimat-ed value of parameter H. In our experiments we used the average value of these three estimated parameters. This method of obtaining parameters H, we also used as classi-fication criteria for self similar traffic. If H is within the range 0.5 and 1, such network traffic is classified as self-similar. Figure 1 present a example of test traffic, and estimations of Hurst parameter by different methods.
3.2
Probability distributions
Network traffic can be described by two stochastic proc-esses, one for packet sizes and one for inter-arrival time. Both processes are described by probability distributions. Self-similar process can be described by heavy tailed dis-tributions. The main task for modeling the stochastic proc-ess with probability distribution is to choose the right
distri-Fig. 1: Estimating parameter H for self similar traffic (upper-left) with the variances method (lower left), R/S method (upper-right) and periodogram method (lower-right)
bution, which would be a good representation of our net-work traffic stochastic process. We used mathematical fit-ting tools (EasyFit) which allowed us to automatically in-clude the fit distribution of the stochastic process, and also estimate parameters of distribution from the captured traf-fic /9/.
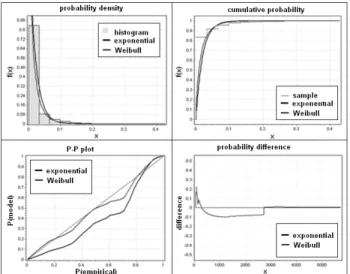
Fig. 2: For the stochastic process of inter-arrival time we chose distribution and estimate parameters of these distributions based on the histogram (upper left), and cumulative distribution function (upper right). Differences between empirical and theoretical distributions in P-P plot (lower left), and deferential distribution (lower right).
3.3
Long-range dependence
Long range dependence describes the memory effect of a stochastic process and it is characterized by its autocor-relation function (5, 6), as defined in the second section. Figure 3 shows an example of the autocorrelations func-tion of the process with long-range dependence property.
Fig. 3: An example of autocorrelation function for the stochastic process, with LRD property
There does not exist a systematic and definitive way to estimate the property of long-range dependence. One of the ways of defining long-range dependence is estimation of Hurst parameter. But different estimation methods offer different estimated values H, which can also vary. This
es-timation is especially difficult around the value 0.5, which represents the boundary between long and short-range dependence. Thomas Karagianis /9, 10/ suggest an ad-ditional test called “bucket-shuffling” for confirmation of long-range dependence. This method can be described as a mixing of captured data. A method is based on ran-dom partitioning of the data series (buckets) of length b. This intuitive method confirms long range dependence, when the autocorrelation functions of the original process and the internal shuffling process, are almost the same.
4.
Modeling and simulation of self
similar traffic in OPNET
OPNET Modeler is one of the leading industrial environ-ments for the simulations of various communication tech-nologies. Different approaches are possible for generat-ing self-similar traffic in OPNET. In our case we used two standard node models (stations) from the OPNET library: - Raw Packet Generator (RPG)
- IP station
Raw Packet Generator (RPG) is a traffic source model /11, 19/ implemented specially for generating self-similar traffic, which is based on different fractal point processes (FPP) /22, 23/. Self similar traffic is modeled with an ar-rival process, which is described by Hurst parameter and the distribution probability for packet sizes. This arrival proc-ess can be based on many different parameters, such as Hurst parameter, average arrival rate, fractal onset time scale, source activity ratio and peak to mean ratio /11/. There are several different fractal point processes (FPP). In our case we used the superposition of the fractal re-newal process (Sub-FRP) model, which is defined as the superposition of M independent and probably identical renewal fractal processes. Each FRP stream is a point re-newal processes and M numbers of independent sources compose the Sub-FRP model. Common inter-arrival prob-ability density function p(ô) of this process is:
(12)
where 1 < γ< 2. Process FRP can be defined as Sup-FRP process, when the number of independent identical re-newal processes (M) is equal to 1. A model Sub-FRP is described by three parameters: γ, A and M. γrepresent the fractal exponent, A is the location parameter, and M is the number of sources. These three parameters are in relationship with three OPNET parameters. These param-eters are Hurst parameter, average arrival rateλ, and frac-tal onset time-scale (FOTS). The relationships between these three parameters of Sub-FRP and parameters in OPNET model are:
where γ= 2 – β. Hurst parameter H is defined by equation (3). In the Sub-FRP model from OPNET, we can set Hurst parameter (H), average arrival-rate (λ) and fractal onset time-scale (FOTS) in seconds. The recommended value for the parameter FOTS in OPNET is 1 second.
The IP station /11/ can contain an arbitrary number of in-dependent simultaneous working-traffic generators. Each generator enables the use of heavy-tailed distributions such as Pareto or Weibull, for the generation of self-similar net-work traffic by two distributions, one for packet size proc-ess and another for packet inter-arrival time procproc-ess. In our case, we used a traffic generator contained in the IP station. The traffic generator is placed above the IP en-capsulation layer, which takes care of the packets’ forma-tion and fragmentaforma-tion. This means, that we can model packets before the fragmentation process. The process of fragmentation radically changes the histogram of the packet-size process, because a lot of MTU length size packets appear. These also impact on the arrival process, because fragmentation causes new packets. All these facts must be considered when modeling network traffic’s proc-ess.
5.
Proposed method
Traffic was captured by a Wireshark sniffer which provides information about captured traffic in the network. Network traffic modeling is often based on modeling the sizes of files transmitted through the network /4/. But we do not usually have information about files’ sizes when measuring network traffic with sniffers, which only provide informa-tion about captured packets
Fig. 4: A histogram of captured packet sizes (left) and transformed captured packets using novel method (right) and estimated parameters of Pareto distributions for both cases.
From the first histogram of captured packets, in Figure 4, we can see that there are a lot of packets with minimal sizes or close to minimal sizes, but there are also many packets with maximal size (MTU). In a case where a light or heavy-tailed distribution is chosen we must bear in mind, that the tail of a distribution has a great impact on the gen-erated traffic, which is a consequence of the mechanism described at the end of Section 4.
For this reason we, developed a new method for estimat-ing the parameters regardestimat-ing Pareto distribution for pack-et size process. This most important parampack-eter is shape parameter α of Pareto distribution. The local parameter k
of Pareto distribution is equal to minimal packets size in captured traffic. The developed method is based on pack-et defragmentation where all maximal packpack-ets in the se-quence including the first packet, which is shorter then maximal size from the same source, combined in the new packets. This operation corresponds to estimating the orig-inal file sizes transmitted over the network. This way of trans-forming captured traffic is then used for estimating Pareto distribution parameters by EasyFit fitting tool, which is shown in the right histogram of Figure 4. Before transfor-mation, we also subtract 20 bytes from each captured packet, which represent the IP headers’ sites. These head-ers will later be automatically added in to the process of fragmentation by OPNET simulations. The new estimated parameters provide a very good description for packet size process (in simulation tool) in the sense of traffic bursts and also in the sense of bit and packet rates. This method was verified by simulation in OPNET tool.
6.
Simulations results
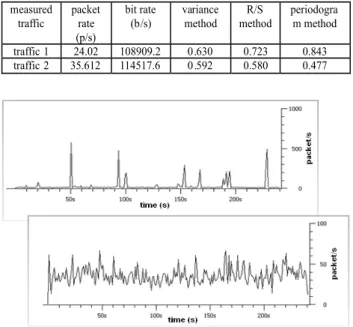
With the help of a sniffer Wireshark, we captured different network traffic in different networks. Here we present two typical captured networks’ traffic, which are even different at the first look. We used these two traffics for analysis, modeling and simulation purposes with the presented methods. Table 1 shows the main properties of these test traffics, which are shown in Figure 5.
Table 1: The main properties of captured traffic and Hurst parameter estimated using different methods for both test traffics.
Fig. 5: Measured test traffic 1 and 2 captured by Wireshark sniffer
We used three different methods for estimating Hurst pa-rameters for these two traffics, which were described in Section 3.The Hurst parameters for both cases are bigger than 0.5, so we can classify these test traffic as self-simi-lar network traffic. Table 1 contains the estimated parame-ters H for both test traffics, which were estimated by vari-ance, R/S and periodogram methods. We also conduct-ed tests about short and long-range dependence. In the case of the first test traffic, the autocorrelation function decayed hyperbolically, which means from Equation (9), that this traffic could have the property of long-range de-pendence. In this case, we can finally confirm long-range dependence using the »bucket shuffling« method, as de-scribed in Section 3.3. For the second test traffic autocor-relation function decayed exponentially towards 0. For this case Equation (9) has finite results and, therefore, the test traffic 2 has the property of short-range dependence. We must also define distribution for inter-arrival time and pack-et size process. Distributions and parampack-eters of distribu-tions were estimated by EasyFit tool. For both test traffics, we chose the suitably heavy (Pareto or Weibull) and also light-tailed (exponential) distributions.
In OPNET, we generated self-similar traffic with two differ-ent station types – RPG and IP stations. We created six different scenarios for each test traffic, where we used dif-ferent combinations of estimated distributions. We intend-ed to show the differences between heavy and light-tailintend-ed distributions. In the first two scenarios, the network traffic was generated by an RPG station, where self-similarity is described by Hurst parameter. During the first scenario we used heavy-tailed distribution for the packet size process, while in the second we used light-tailed distribution (expo-nential). In the next four scenarios, we generated network traffic using the IP station, where we used different combi-nations of used distributions for the packet size process and inter-arrival time.
Table 2: Estimated distributions and parameters for propose of modeling test traffic 1 in OPNET.
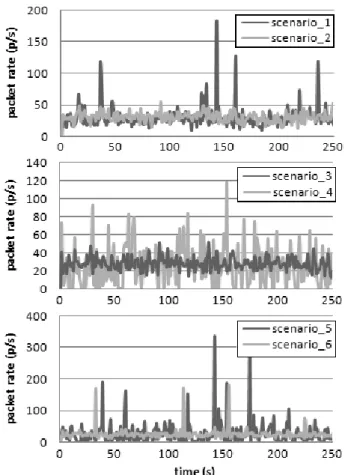
models and simulation results using these models. Figure 6 shows all six modeled traffic traffics produced by OP-NET, with estimated parameters from Table 2. The traffics differ in the sense of burst intensities, packet and bit-rates. One of the criterions, for modeling successfully, was the differences between bit and packet-rates of the test traffic and modeled traffics in OPNET. Besides the average val-ues of bit and packet-rates, the more important criteria is also bursts’ intensity within the network traffic. For each test traffic, we chose from the six modeled traffics, the traffic which best represented the measured test traffic.
Test traffic 1 poses the property of long-range depend-ence, so there are a lot of bursts in the traffic. We mod-eled this measured-test traffic over six different scenarios. The results are shown in Figure 6 and Table 2. The best approximation for test traffic 1 is modeled traffic 5 from Table 2. The described is by Pareto distribution for packet-size process and Weibull distribution for inter-arrival time. Figure 8 shows a comparison between the second test traffic and the modeled traffic for bit rates. We also com-pared histograms of processes for packet-size and the in-ter-arrival time of measured and simulated network traffic. Here we saw that the processes for modeled traffic are very close to those of measured traffic. We can also com-pare Hurst parameters from Table 2 between them. In the case of modeled traffic 5, the Hurst parameter of the
mod-Fig. 6: Modeling measured test traffic 1 in OPNET with six modeling traffics (scenario 1 in 2 with RPG station, scenario 3, 4, 5, 6 with IP station)
Table 2 shows modeling results for test traffic 1 over six different scenarios. There are estimated statistical param-eters such as Hurst paramparam-eters and distributions used in
eled traffic is the closest to the estimated values of the measured network for all of simulated-traffic cases.
Fig. 7: Comparison between modeling and measuring of test traffic 2 in packets per second (p/s).
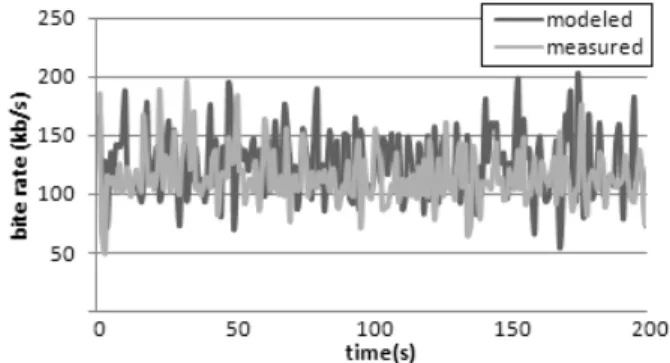
Test traffic 2 was also modeled over six different scenar-ios, such as in the first case. As the best modeled traffic of test traffic 2 from all six cases, we chose the case where simulated traffic was described by the exponential distri-bution for packet sizes and Weibull heavy-tailed distribu-tion for inter-arrival time. The bit-rate of this traffic was 32.95 (p/s) and packet-rate was 118998 (b/s), which are very close to the measured values. The Hurst parameter of the simulated traffic was 0.521, which is also close to the es-timated values of the measured traffic. In this case, we also compare the variances of packet and bit rates. The measured traffic variances are 9.81 (p/s) for packet-rate and 22177 (b/s) for bit-rate. In the case of measured traf-fic, the variances of the modeled traffic for packet-rate are 11.32 (p/s) and 29280 (b/s) for bite-rate. Figure 7 shows the comparison between measured and best-modeled traf-fic for bit rates. From all critera after comparison we can say that the simulated traffic is a good approximation of measured traffic 2.
Fig. 8: Comparison between modeling and measuring of test traffic 1 for bit rates.
7.
Conclusion
In this paper we presented novel method for estimating the distribution parameters of measured network traffic. We also validated this method in simulation and also made comparisons, between the developed method and the
method where parameters are estimated directly form cap-tured packets. During the analysis phase we paid atten-tion to the self-similar property, which has become the basic model for describing today’s network traffic.
In network traffic theory, the properties of short and long-range dependence are direct prescribed by the values of estimated parameter H. Using our analysis of network traf-fic, we proved that network traffic can exist where Hurst parameter is bigger than 0.5, but this process does not have the property of long-range dependence.
From our simulations, we could also see that, in the case of modeling self-similar traffic, short-range dependence is more appropriate for choosing exponential distribution to describe a packet-size process. The exponential distribu-tion does not impact on the extreme peaks in the modeled traffic. Pareto distribution is unsuitable for these reasons. Heavy-tailed distributions, especially Pareto, are suitable for modeling packet-size process of measured network traf-fic, which are self-similar and also have the property of long-range dependence (test traffic 1).
There are discrepancies between measured and modeled traffics are discrepancy in the sense of packet-rate, bit-rate, bursts intensity, and variances. With this developed method, we obtain good approximation of measured net-work traffic. We cannot claim that this is the optimal meth-od but it shows gometh-od results through OPNET. We noticed that estimating the shape-parameter of Pareto is very deli-cate, because the small deviation in the parameter causes large discrepancies regarding of network traffics average values, which is one of the chosen criteria for traffic mod-eling.
Acknowledment
This work is part of the target research programme “Sci-ence for Peace and Security”: M2-0140 - Modeling of Command and Control information systems, financed by the Slovenian Ministry of Defence.
References
/1/ W. E. Leland, M. S. Taqqu, W. Willinger and D. V. Wilson, On the self-similar nature of Ethernet traffic (Extended version), IEEE/ ACM Transactions on Networking, Vol. 2, pp. 1-15, 1994. /2/ V. Paxon, and S. Floyd, Wide area traffic: the failure of Poisson
modeling, IEEE/ACM Transactions on Networking, 3(3): 226– 244, 1995.
/3/ K. Park, and W. Willinger, Self-Similar Network Traffic and Per-formance Evaluation, John Wiley & Sons, 2000.
/4/ K. Park, G. Kim and M. E. Crovella, On the Relationship Be-tween File Sizes Transport Protocols, and Self-Similar Network Traffic, International Conference on Network Protocols, pp.171– 180, 1996.
/5/ W. Willinger, M. S. Taqqu, R. Sherman and D. V. Wilson, Self-similarity through high-variability: statistical analysis of Ethernet LAN traffic at the source level, IEEE/ACM Transactions on Net-working, 5(1): 71–86, 1997.
/6/ M. E. Crovella, and A. Bestavros, Self-Similarity in World Wide Web Traffic Evidence and Possible Causes, IEEE/ACM Trans-actions on Networking, 1997.
/7/ O.Rose, Estimation of the Hurst Parameter of Long Range De-pendent Time Series, Research Report, 1996.
/8/ F. Xue, and S. J. Ben You, The effect of aggregation on self-similar traffic, Department of Electrical and computing engineer-ing, University of California, 2004.
/9/ T. Karagiannis, M. Molle and M. Faloutos, Long-range depend-ence: Ten years of Internet traffic modeling, IEEE Internet Com-puting, 8 (5), pp. 57-64, 2004.
/10/ T. Karagiannis and M. Faloutos, A Tool For Self-Similarity and Long-Range Dependence Analysis, 1st Workshop on Fractals and Self-Similarity in Data Mining: Issues and Approaches (in KDD), Edmonton, Canada, July 23, 2002.
/11/ P. Sagger, Does Circuit Emulation in Metropolitan Gigabit Eth-ernets require Service Priority?, Post Diploma Thesis NA-2005-02, Swiss Federal Institute of Technology, Zurich, 2005. /12/ H. Yőlmaz, IP over DVB: Management of self-similarity, Master
of Science, Bođaziçi University, 2002.
/13/ M. Z. Jiang, Analysis of wireless data network traffic, Master of Applied Science, Simon Fraser University, Vancouver, Cana-da, 2000.
/14/ C. Groth, Modellierung und Simulation von Ethernet-Netzwerkverkehr, Master of Science, Universität Rostock, 2004. /15/ B. Vujičić, Modeling and Characterization of Traffic in Public Safety Wireless Networks, Master of Applied science, Simon Fraser University, Vancouver, 2004.
/16/ E. Casilari, F. J. Gonzalez and F. Sandoval, Modeling of HTTP traffic, IEEE Communication Letters 5(6): 272–274, 2001. /17/ J. Beran, R. Sherman, M. S. Taqqu, and W. Willinger (1995),
Long-range dependence in variable bit rate video traffic, IEEE Transactions on Communications, vol. 43, 1566–1579, 1995.
/18/ M. Fras, J. Mohorko and Ž. Čučej, Žarko. A new approach to the modeling of network traffic in simulations, Inf. MIDEM, 39(1), pp. 41-45, 2009.
/19/ J. Potemans, B. Van den Broeck, Y. Guan, J. Theunis, E. Van Lil and A. Van de Capelle, Implementation of an Advanced Traffic Model in OPNET Modeler, OPNETWORK 2003, Washington D.C., USA, 2003.
/20/ P. Leys, J. Potemans, B. Van den Broeck, J. Theunis, E. Van Lil and A. Van de Capelle, Use of the Raw Packet Generator in OPNET, OPNETWORK 2002, Washington D.C., USA, 2002.
/21/ M. Jiang, S. Hardy and Lj. Trajkovic, Simulating CDPD networks using OPNET, OPNETWORK 2000, Washington D.C, 2000. /22/ K. B. Ryu, and S. Lowen, Fractal Traffic Model for Internet
Sim-ulation, Proceedings of the Fifth IEEE Symposium on Computers and Communications (ISCC 2000), 2000. /23/ B. K. Ryu, and M. Nandikesan, Real Time Generation of Fractal
ATM Traffic: Model, Algorithm, and Implementation, Department of Electrical Engineering and Center for Telecommunications Research, New York, 1996.
/24/ H. Yőlmaz, IP over DVB: Management of self-similarity, Master of Science IP over DVB: Management of self-similarity, Master of Science, Bođaziçi University, 2002.
/25/ M. Gospodinov, and E. Gospodinova, The graphical methods for estimating Hurst parameter of self similar network traffic, In-ternational conference on computing systems and tehnolo-gy – CompSysTech’ 2005.
/26/ M. Fras, J. Mohorko and Ž. Čučej, Estimating the parameters of measured self similar traffic for modeling in OPNET, IWSSIP Conference, Maribor, Slovenia, 2007.
/27/ O. Sheluhin, S. Smolskiy and A. Osin, Self-Similar Processes in Telecommunications, John Wiley & Sons, 2007.
/28/ J. Mohorko, M. Fras and Ž. Čučej, Modeling of IRIS replication mechanism in tactical communication network with OPNET, IWS-SIP Conference, Maribor, Slovenia, 2007.
/29/ M. Fras, J. Mohorko and Ž. Čučej, Žarko. Analysis, modeling and simulation of P2P file sharing traffic impact on networks’ performances. Inf. MIDEM, 38(2), str. pp. 117-123, 2009.
M. Fras, Margento R&D, Maribor, Slovenia J. Mohorko, Ž. Čučej University of Maribor, Faculty of Electrical Engineering and Computer Science, Maribor, Slovenia