Performance of supply chain collaboration - A simulation study
AbstractIn the past few decades several supply chain management initiatives such as Vendor Managed Inventory, Continuous Replenishment and Collaborative Planning Forecasting and Replenishment (CPFR) have been proposed in literature to improve the performance of supply chains. But, identifying the benefits of collaboration is still a big challenge for many supply chains. Confusion around the optimum number of partners, investment in collaboration and duration of partnership are some of the barriers of healthy collaborative arrangements. To evolve competitive supply chain collaboration (SCC), all SC processes need to be assessed from time to time for evaluating the performance. In a growing field, performance measurement is highly indispensable in order to make continuous improvement; in a new field, it is equally important to check the performance to test conduciveness of SCC. In this research, collaborative performance measurement will act as a testing tool to identify conducive environment to collaborate, by the way of pinpointing areas requiring improvements before initializing collaboration. We use actual industrial data and simulation to help managerial decision-making on the number of collaborating partners, the level of investments and the involvement in supply chain processes. This approach will help the supply chains to obtain maximum benefit of collaborative relationships. The use of simulation for understanding the performance of SCC is relatively a new approach and this can be used by companies that are interested in collaboration without having to invest a huge sum of money in establishing the actual collaboration.
Key words: supply chain collaboration, simulation, performance measurement, CPFR
1. Introduction
Supply chain management (SCM) organizes and manages the whole process of activities of supply network from suppliers through manufacturers, retailers/wholesales till end users (Christopher, 1998). Traditionally, supply chain (SC) was designed with more focus on movement of materials rather than information flow. Due to ever increasing competition in businesses, many SCs have taken some twists from traditional way of functioning, from time to time, to adapt to the situation. Existing literature describes the SCM of the 21st century as an integrative value adding process of planning and controlling
of materials and information between the supplier and the end user in order to increase customer satisfaction by reduced cost and improved services (Cooper et al., 1997).
In today’s competitive unpredicted business world, cost reduction and good customer services are not stand-alone effort of any single SC member. As success of any product lies in customers' response to that product, it is important for businesses to achieve customer satisfaction by having efficient and
effective SCs. This may be possible through collaboration among SC partners. Hence, it is important to coordinate SC activities to streamline planning, production and replenishment (Ramanathan, 2012a). Market demand and changing nature of end-users can create more opportunities for SC players. At the same time, to be viable in a competitive market, all SC members need to be innovative and productive (Lee, 2002). As operating alone in a tight competition seem to be no longer beneficial for SCs, the importance of partnership has been adopted in various stages of many SCs (Samros, 2007).
In the past, several SCM practices such as Vendor Managed Inventory (VMI), Efficient Consumer Response (ECR), Continuous Replenishment (CR), and Electronic Data Interchange (EDI) have been suggested in the literature to increase benefits of SCs. VMI technique was developed in the mid 1980’s, in which customer’s inventory policy and replenishment process were managed by the manufacturer or supplier. However, SC visibility was not predominately powerful in VMI to avoid bullwhip effect (Barratt and Oliveira, 2001). Forecast driven VMI and integration of CR with EDI was used to reduce the information distortion in VMI. ECR developed in 1992, was based on the concept of value adding by all partners in the supply chain. Both VMI and EDI together with ECR tried to create more responsive supply chain with broader visibility of information across the whole SC. Ever increasing SC demands have led to the invention of Collaborative Planning Forecasting and Replenishment (CPFR), another supply chain management tool incorporating planning, forecasting and replenishment under a single framework (Fliedner, 2003). CPFR, a second generation ECR (Seifert, 2003) aims to be responsive to consumer demand. It was introduced as a pilot project between Wal-Mart and Warner-Lambert in mid-nineties. According to VICS (2002), CPFR is a new collaborative business perspective that combines the intelligence of multiple trading partners in the planning and fulfilment of customers demand by linking sales and marketing best practices.
Collaboration among SC members is a topic of interest for many researchers and practitioners (Barratt and Oliveira, 2001; Danese, 2007; Nyaga et al., 2011; Ramanathan, 2012a). Simatupang and Sridharan (2004) evolved four profiles for supply chain collaboration (SCC), namely efficient, synergistic, underrating and prospective collaboration. They proposed decision synchronization, incentive alignment and information sharing as three performance indices. In an attempt to maximize benefits of SCs, all SC members share information (data sharing) and collectively forecast the demand for products to have effective replenishment process (Aviv, 2007; Gavirneni et al, 1999). SCC activities help to improve the performance of involved members in a structured framework with the aim of maximizing profit through improved logistical services (Stank et al., 2001). However, majority of the articles in the literature have not highlighted important factors of good SCC practice. In this paper, we will be analysing the environments conducive to initiate SCC such as CPFR. The focus of this research is to identify the
suitable environments to collaborate in SCs. Revealing the actual benefits of SC collaboration with certain number of partners with specific level of investments for a specified period will help to make decision on implementing SCC at various levels. This is further explained through evidence from the existing literature in the next section.
The rest of the paper is organised as follows: Section 2 will briefly explain the existing literature on SCC. Section 3 will describe research methodology used in this research. Section 4 explains the development of performance measurement of supply chain collaboration. Section 5 will discuss the results and analysis of simulation. Finally, Section 6 will conclude the paper with key findings, managerial implications, limitations and future work.
2. Supply chain collaboration for performance improvement: A Literature review
SCM is being practiced by many businesses around the globe and hence it has a great wealth of literature from time of evolution of business processes. But, SCC is a relatively new research area and the literature is growing at a tremendous pace. Various advantages and disadvantages have been revealed by academics and practitioners. This section discusses some of the advantages and barriers of SCC. On realizing the importance of collaborative efforts in SCs, many researchers have developed theoretical and mathematical models to improve the structure and functionality of SCs.
2.1. Advantages of SC collaboration
In the field of SCM, there is an overlap in the meaning of cooperation, coordination, collaboration, joint action plan and partnership, representing more or less the same concept (Yu et al., 2001; Corsten and Felde 2005). However, CPFR is specifically defined as a web-based attempt (Fliedner, 2003) or internet tool to coordinate the various supply chain activities such as forecasting, production and purchasing in SCs to improve the visibility of consumer demand (Barratt and Oliveira, 2001), to reduce any variance between supply and demand (Steermann, 2003). Caridi et al. (2005) viewed CPFR as a process of correcting, adjusting, proposing prices and quantities to reach an agreement on common unique forecast that can be used by buyers and sellers. VICS (2002) claimed that CPFR would help cost savings and gain competitive advantage. Several case studies have been reported in literatures that have examined the impact of collaboration (see www.ecch.com and ECR Europe, 2002).
In SCCs, through joint planning and decision making, the understanding of the replenishment process is becoming clearer (Barratt and Oliveira, 2001). For example, Wal-Mart’s initiative of creating profile on purchase pattern of customers, namely ‘personality traits’, has helped to increase visibility of demand throughout the value chain (Mclvor et al., 2003). Information exchange and demand forecast
based on sales data helped ‘Sport Obermeyer’ to improve forecast accuracy during demand uncertainty (Fisher 1997).
In recent years, many academics and practitioners have suggested using collaborative arrangement to improve SC performance. Ramanathan and Muyldermans (2011) used structural equation models to identify underlying demand factors of soft drink sales in collaborative supply chains. They suggested using those factors for demand forecasting. Cheung et al. (2012) used actionable quantitative information from a number of upstream and downstream partners in developing knowledge-based system in supply chains. They have used simulation experiments to test SC models. Ramanathan and Gunasekaran (2013), Nyaga et al., (2011) and several other researchers insisted the importance of transparent information sharing, joint efforts and investments to improve trust and commitments in SCCs. Any SC can improve visibility using five important factors namely responsiveness, planning, shared targets, trust and common forecast (Barratt and Oliveira 2001). Real benefit of information sharing among SC partners lies in its effective and efficient use (Lee et al., 2000; Raghunathan, 2001) and it is also supported by proper use of Information Technology (IT) (Sanders and Premus, 2005; Cachon and Fisher, 2000). From the cases of Wal-mart and P&G, it is understandable that the use of various IT platforms is based on the scale of operations.
2.2. Barriers of SC collaboration
Barriers of SC collaboration can be broadly classified under two categories: organisational and operational. Smaros (2007) argued that lack of internal integration (organisational barrier) would be a great obstacle for manufacturers to efficiently use demand and forecast information (operational barrier). Sometimes behavioural issues within organisation may also lead to failure of collaborative relationships. Fliedner (2003) considered lack of trust, lack of internal forecast, and fear of collusion as three main obstacles to implement collaboration. Boddy et al. (1998) identified six underlying barriers for partnering: insufficient focus on the long term, improper definition of cost and benefit, over reliance on relations, conflicts on priority, underestimating the scale of change and turbulence surrounding partnering.
Use of technology and levels of information exchange in SCs have been discussed in the literature as both the advantage and the disadvantage (Cadilhon and Fearne, 2005; Sanders and Premus 2005; Samros, 2007). Occasionally, even a basic level of information exchange will yield potential benefits to businesses. For example, Metro Cash & Carry Vietnam is a German-owned business to business grocery wholesaler successfully engaged in collaboration with a disarming degree of simplicity. The company shares information among SC partners using telephone calls and fax machine without much sophisticated IT (Cadilhon and Fearne, 2005). The case of Metro Cash & Carry clarifies that free access
to available data is imminent in SCCs for planning and forecasting. But technology may not be a barrier for the success of collaboration (Cadilhon and Fearne, 2005; Smaros, 2007). This argument on technology totally disagrees with the basic concept of CPFR, which is a web-based attempt to coordinate the various activities among supply chain partners (Fliedner, 2003). Though information sharing and the role of IT were commonly accepted as significant phenomena in SCC (Sanders and Premus 2005), the use of technology is not argued widely as a necessary condition for collaboration; this is mainly because the technology used in CPFR varies widely across different CPFR cases (Danese, 2007). Also, due to availability of wider variety of technology and tools, proper technology selection becomes a complicated task for collaborating partners. To handle this issue, Caridi et al., (2005) proposed a new ‘learning model’ to incorporate intelligent agents to CPFR to measure performance of SCs at different collaborative environments. Barriers of partnering could be avoided through supplier training programme (Smith, 2006) and identifying opportunities to increase scope (Boddy et al., 1998). Continuous efforts of academics and practitioners to improve SCC have helped creating many models of SCs.
2.3. Models in SC collaboration
In general, the nature of complexity is instrumental in the development of models at various levels of SCCs. Also due to increase in SC dependencies, SCC requires different combination of tasks and resources (Simatupang and Sridharan, 2004). For instance, CPFR business model is based on experiences of practitioners and strategies of their business development process (Ireland and Crum, 2005). Though, the basic structure of CPFR model has been accepted by many practitioners, it is also commonly agreed by many that some value addition to the existing model, depending on the industry implementing CPFR, will make SCCs responsive to market changes (Smith 2006; Chung and Leung 2005).
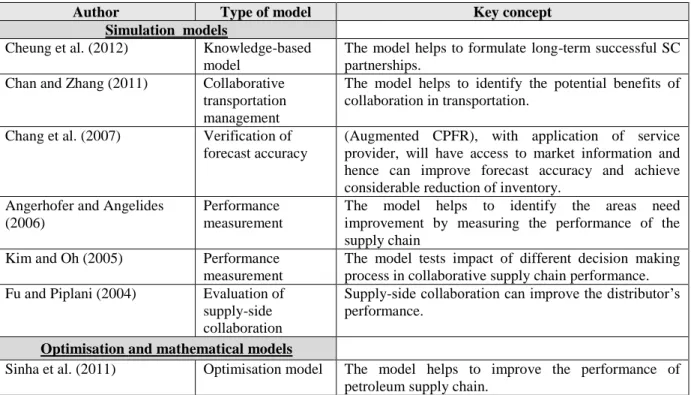
Theoretical model developed by Corsten and Felde (2005) is related to the impact of trust (Humphreys et al., 2001), dependence, supplier collaboration on innovation, purchase cost reduction and financial performance. They established that supplier collaboration and the level of trust have positive impact on innovation and success of SCs. In literature, many conceptual frameworks are designed to explain the organizational and functional aspects of SCC whereas mathematical or simulation models are focussing mainly on the performance evaluation. Examples of SC models, suggested in the literature after the development of CPFR framework (mid-nineties), are given in Table 1.
Aviv (2001) compared the effect of collaboration in two different set-up: one with centralized information and another with decentralized information. Based on uncertainty measure he concluded that diversified forecasting capabilities can improve the benefits of collaborative forecasting; in other words forecasting accuracy is strongly dependent on the collaborative strength.
Lee et al., (2000) developed a model to verify value of demand information sharing especially when demands are correlated significantly over a period of time. In a counter argument, Ragunathan (2001) emphasised the importance on effective use of available internal information for forecasting in comparison to investing on inter-organizational information system for information sharing in the case of non-stationary demand.
Only a few studies exist in the literature on the performance analysis of SCC using simulation. Kim and Oh (2005) used system dynamics model to identify the performance of collaborative SCs in three different scenarios: manufacturer dominated SCs, supplier dominated SCs and balanced decision making. The authors identified that the balanced SCC will yield high benefits. Angerhofer and Angelides (2006) created a system dynamics model to evaluate the performance of supply chain management. The impact of six constituents - stakeholders, topology, levels of collaboration, enabling technology, business strategy and processes, were tested on SCs to measure the performance. Chang, et al., (2007) introduced an idea of augmented CPFR (A-CPFR) as an improvement to existing CPFR model with access to market information through application service provider. The authors tested its forecast accuracy through a simulation model. In a recent paper, Ramanathan (2012a) used AHP model to compare performance of two companies based on use of SC information. The author concluded that the companies using frequent information exchange among SCs can be benefited with continuous improvement in planning and forecasting.
Table 1: Some existing models in SCC
Author Type of model Key concept
Simulation models
Cheung et al. (2012) Knowledge-based model
The model helps to formulate long-term successful SC partnerships.
Chan and Zhang (2011) Collaborative transportation management
The model helps to identify the potential benefits of collaboration in transportation.
Chang et al. (2007) Verification of forecast accuracy
(Augmented CPFR), with application of service provider, will have access to market information and hence can improve forecast accuracy and achieve considerable reduction of inventory.
Angerhofer and Angelides (2006)
Performance measurement
The model helps to identify the areas need improvement by measuring the performance of the supply chain
Kim and Oh (2005) Performance measurement
The model tests impact of different decision making process in collaborative supply chain performance. Fu and Piplani (2004) Evaluation of
supply-side collaboration
Supply-side collaboration can improve the distributor’s performance.
Optimisation and mathematical models
Sinha et al. (2011) Optimisation model The model helps to improve the performance of petroleum supply chain.
Author Type of model Key concept
Aviv (2001) Mathematical model for forecasting
Products with shorter lead time have more benefit from supply chain collaboration.
Aviv (2007) Mathematical model for forecasting
Dominance or power of partnership, agility of the supply chain and internal service rate affect the benefits of collaborative forecasting.
Aviv (2002) Mathematical model for joint forecasting and replenishment
Auto-regressive demand process can decrease the demand uncertainty in VMI and CFAR (Collaborative Forecasting and Replenishment) programmes.
Chen and Chen, (2005) Mathematical model for joint
replenishment
Developed four decision making models to determine optimal inventory replenishment and production policies in a supply chain considering three-level inventory system in a two echelon supply chain; Model also included major and minor set-up cost for manufacturers, and major transportation and minor processing cost for the retailer.
Raghunathan, (2001); Lee et al. (2000)
Mathematical model Inventory reduction and cost reduction can be achieved with efficient use of information sharing (Lee et al, 2000) and there is no need to invest in inter-organizational systems for information sharing if order history is available (Raghunathan, 2001).
Mishra and Shah (2009) Structural equation model
New product development will benefit from collaborative effort of supplier and customer, and cross functional involvement.
Nagya et al. (2011) Structural equation model
Impact of collaborative efforts in overall satisfaction Ramanathan and
Muyldermans (2010;2011)
Structural equation model
Impact of demand information in collaborative forecasting
Ramanathan and Gunasekaran (2013)
Structural equation model
Impact of SC collaboration in success of long term partnership
Ramanathan (2012a) AHP model Role of SC information in company’s decision making
Other models
Shafiei et al (2012) Multi-enterprise collaborative decision support system
The model helps decision makers to explore various options of solutions under what-if scenarios.
Singh and Power (2009) Structural Equation Model
Firm performance will increase if both supplier and customer are involved in collaborative relationship. Kwon et al. (2007) Multi-agent model The model helps to provide flexible solutions to
address SC uncertainties.
Caridi et al. (2005) Multi-agent model Mutli-agent system can be used to automate and optimise supply chain collaboration.
Chung and Leung (2005) An improvement to CPFR model
Inclusion of ‘Engineering change management’ increases the responsiveness to market changes. Simatupang and Sridharan
( 2004)
Collaborative performance system
Collaborative enablers are directly linked with collaborative performance metrics. Four types of collaboration identified: Efficient, underrating, prospective and synergistic.
Stank et al. (2001) Logistical service performance model
Collaboration with external supply chain partners along with internal support will improve logistical services. McCarthy and Golicic (2002) Collaborative Increased revenues and earnings are possible with
Author Type of model Key concept
forecasting model SCCs.
Lambert and Pohlen (2001) Conceptual model Developed a framework with following seven steps: supply chain mapping, identifying value addition process, identifying the effect of relationship on profitability, realign supply chain processes accordingly, measure individual performance, compare value with supply chain objectives, replicate steps at each link in the supply chain
2.4. Performance measurement of SC collaborations
Models in SC collaborations are mainly classified under two categories: performance measurement models and decision making frameworks. Some models are supported with mathematical/empirical evidence (Angerhofer and Angelides, 2006; Kim and Oh 2005; Forslund and Jonsson 2007), and other models are purely conceptual in nature (Chen and Paulraj, 2004; Simatupang and Sridharan, 2004). In general, these two types of models are interrelated to each other in their way of functioning with respect to cause and effect. For example, performance measurement will lead to decision making process and decisions will lead to improve future performance. The main purpose of measuring the performance of SC network is to identify the problems in order to improve the SC efficiency and also to identify the conduciveness of collaboration.
Many researchers conducted a detailed study on performance measurement of SC network based on cost and service level (Lee and Padmanabhan, 1997). But in SCCs, communication technologies such as information exchange and proper use of data are of high importance to the success of collaboration (Danese, 2007). Hence, measuring the proper use of technology and information are also becoming important in SCCs.
Some researchers developed theoretical frameworks to measure the performance using balanced score card with many performance perspective measures (Chen and Paulraj, 2004). But a very few researchers initiated benchmarking of SCs (Simatupang and Sridharan, 2004; Ramanathan el al., 2011). Evidences from the literature confirm that key measures for evaluating SC performance include cost, quality and responsiveness. In recent literature, forecast accuracy is also used as an indicator of proper use of information in SCCs (Ramanathan and Muyldermans, 2010). Meanwhile, lack of information exchange will result in greater variability of demand forecast for upstream SC members (Yu etal., 2001), which is the clear indication of SC problem. Chen and Paulraj (2004) tried to create a conceptual framework to understand problems and opportunities associated with SC management.
As there are many dimensions for SCCs, the performance measurement is also becoming a complicated process. Verifying whether the environment is conducive to SCC will help the companies to
identify the areas to be modified before implementation. This was partly answered from the findings of Aviv (2001) and Smaros (2007). Aviv’s (2001) confirmed that the products with short lead time could achieve better forecast accuracy compared to the products with long lead time (Smaors, 2006). Danese (2007) through several case studies across SC networks such as manufacturers, customers and suppliers, identified that different levels of collaboration exist in SCs and the benefits attached to each level will differ. Based on the analysis of these case studies, Danese (2007) classified the degree of collaboration as low, medium or high. Ramanathan (2012a) compared two case companies performance on demand planning and forecasting and suggested three different levels of collaborations in SCs, namely preparatory level, progressive level and futuristic level. However, not many articles have discussed the benefits of SCC in terms of the number of partners, investment and duration of partnerships. Most of the studies discussed above have confirmed the role of supply chain partners and their involvement in SC performance and profit. However, there is no specific study that discusses in detail the role of investment, the number of partners or the duration in collaborative partnerships. To fill this gap, in this paper we use the combination of all these three elements in SC collaboration.
In order to find environment conducive for SCC, based on the literature and the actual practices in SCs, we propose in this study that the degree of collaboration will depend on factors namely the investment on collaborating technology and partnerships, the number of collaborating partners and the duration of collaboration. We attempt to develop a performance model for SCC using a well-known methodology called simulation in the following sections.
3. Research methodology
Performance evaluation of SCC is a complex task and research on this topic is still in its infancy. We make an attempt to quantify the benefits of SCCs through the factors discussed above. The choice of methodology is most important to identify the correct solution to a particular research problem (Yin, 1989). Case study based simulation is being used in this research. Case study research will be beneficial to understand the role of above specified five factors in performance of SCC. Basic information such as duration of collaboration, the level of investments and the number of partners from the case companies will be simulated to create similar scenario. For this purpose, we have chosen two case companies from the packaging industry.
In this paper, we have used simulation to identify the performance of SC collaboration based on the factors of SCC. To initialize the process of simulation, basic mathematical approach is used as outlined above in Section 3. All the measures are converted in terms of ratio to avoid using mixed units. Generally, rhw ratio of input to output is described as a performance indicator. Simulation will support analysing collaborative performance on supply chains for changing degrees over the collaborating period.
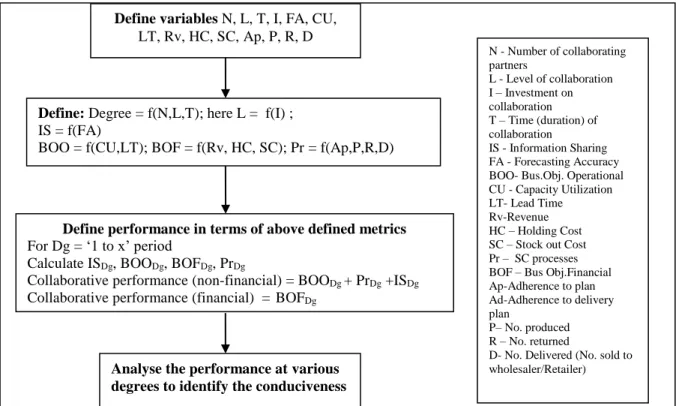
This what-if analysis will be instrumental in decision making on implementation of collaborative supply chain (Angerhofer and Angelides, 2006). The advantage of using simulation is that an existing or proposed system can be designed using what if analysis in order to optimize the benefits by identifying the pitfalls in the system. Some researchers attempted to use system dynamics simulation for what-if analysis (Kim and Oh, 2005; Angerhofer and Angelides, 2006; Chang et al., 2007). In this research the purpose of what-if analysis is to identify the conducive environment to implement SCCs. Schematic projection (see Figure 2) of research methodology can further simplify the understanding of SC performance.
This research intends to establish links among all the coordinating factors of collaboration. Creating links with different modules will in turn be powerful to identify a weaker node which needs improvement. Traditionally, performance of supply chain is measured through demand amplification (Angerhofer and Angelides, 2006) and value additions in each node of supply chain. But in case of collaborative SCs, the value addition is not an independent activity and hence composite performance indicator is used to measure performance of collaborative supply chain. If SC handles product returns then the performance should include inventory management and disposition of the returned goods. We have considered five important factors of SC collaboration for our further analysis; namely, degree of SC collaboration, business objectives – operational and financial, information sharing and SC processes. We have categorised the SC performance as financial and non-financial. Non-financial performance of SC is measured through operational business objectives, SC processes and information sharing (see Figure 2).
Figure 2: Schematic projection of methodology
4. Development of performance measures for supply chain collaboration
Though SC is a widely researched area, it needs a strong framework (Chen and Paulraj, 2004) for development of more systematic principles that will help SCs to develop against all odds and barriers. In recent business world, many companies collaborate for different purposes such as logistics, cost reduction and business expansion. Such SCC necessitates some value addition to business objectives along with the original SC operations models (ECR Europe, 2002). Also information sharing is critical in modern SCs to meet fluctuating demand (Ramanathan, 2012a & b). In the literature, degree of collaboration is not linked with performance of SCs in an effective way (Danese, 2007; Larsen et al., 2003; Ramanathan, 2012a). In this research based on the literature and actual SC practices in recent businesses, we consider five important factors of collaboration namely business objectives - financial and operational, supply chain processes, information sharing and degree of collaboration.
4.1. Business Objectives – Financial (BOF)
Now-a-days, many businesses are striving to maximize profit by improving the quality of products and services to the end users by lowering the cost. Many leading companies such as Wal-Mart and Procter & Gamble use SCC to achieve this objective. VICS (2002) claims that CPFR will help cost
Define: Degree = f(N,L,T); here L = f(I) ; IS = f(FA)
BOO = f(CU,LT); BOF = f(Rv, HC, SC); Pr = f(Ap,P,R,D)
Define performance in terms of above defined metrics
For Dg = ‘1 to x’ period
Calculate ISDg, BOODg, BOFDg, PrDg
Collaborative performance (non-financial) = BOODg + PrDg +ISDg Collaborative performance (financial) = BOFDg
N - Number of collaborating partners L - Level of collaboration I – Investment on collaboration T – Time (duration) of collaboration IS - Information Sharing FA - Forecasting Accuracy BOO- Bus.Obj. Operational CU - Capacity Utilization LT- Lead Time Rv-Revenue HC – Holding Cost SC – Stock out Cost Pr – SC processes BOF – Bus Obj.Financial Ap-Adherence to plan Ad-Adherence to delivery plan
P– No. produced R – No. returned
D- No. Delivered (No. sold to wholesaler/Retailer) Analyse the performance at various
degrees to identify the conduciveness Define variables N, L, T, I, FA, CU,
savings and gain competitive advantage. Commonly SC collaboration is initiated among various SC members to meet customers’ needs, to improve product availability, to increase business performance, to increase sales, to achieve reduced cost, to increase revenues and earnings, to improve forecast accuracy, to increase visibility of demand (McCarthy and Golicic, 2002; Cooke, 2002; Ireland and Crum, 2005; Ramanathan et al., 2012b). Cost savings such as minimizing the logistics cost can possibly be one of the most important drivers of collaborations (Corsten and Felde, 2005; Chen and Chen 2005). Chen and Chen (2005) developed a mathematical model for joint replenishment in the process of reducing cost. For example, Ace Hardware’s CPFR pilot project earned a positive result in forecast accuracy from 80 to 90 percent and product costs dropped from 7 to 2.5 percent (Cooke 2002). In many cases the SC collaboration proved to be a promising tool to increase business performance, sales, revenues and earnings (McCarthy and Golicic, 2002; Cooke, 2002).
In our research, sales revenue and costs involved in production will be used to quantify financial business objectives. In general, cost involves fixed cost and variable costs such as production cost, stock out or holding cost. Other hidden variable costs are not included for the purpose of calculations.
T jBOF
0
Fixed
cost
Variable
cost
cost
holding
or
Stockout
-cost)
production
Unit
produced
(No.
price
sales
Unit
returns)
No.of
sales
of
(No.
T j 0 j j j jcost
Total
OC
PC]
P
[
SP]
)
R
[(D
Here D – No. delivered (i.e., sold to retailer)R- No. returned I – Current inventory SP- Selling Price PC- Production Cost P-No. Produced
OC- Other Cost (Holding cost or stock-out cost)
Variable cost = Production cost + Holding cost or stock-out cost
D
I
SC,
R)
I
(D
SC
D
I
HC,
D)
-R
(I
HC
OC
HC- holding cost SC- stock-out costStock-out cost or penalty cost is usually calculated for retailers but not for manufacturers (Aviv, 2007). Based on our interview with the case companies, we assume that manufacturers will also incur
penalty cost for not completing production on time to facilitate on time delivery; this is similar to stock-out cost of retailer.
4.2. Business Objectives – Operational (BOO)
Customer retention is becoming a great challenge in current competitive business market. Improved business performance through SCC can help to attract and retain customers (Matchette and Seikel, 2004). Customer loyalty can also be built by effective SC activities. For example, making stock of right products available at right time in proper location of retail stores will help to attract and retain customers. This can be achieved through a wider cooperation from all SC members. For instance, efficient capacity utilization can help reducing production time (Aviv, 2007). Customer loyalty can also be achieved if SC activities include customer service such as accepting and handling product returns (Dowlatshahi, 2000).
From the literature, we have considered three important factors namely number of product returns, product lead time, and capacity utilization (production capacity) to measure the business objectives (Aviv, 2007; Dowlatshahi, 2000). Capacity utilization P μ P μ P CU n,n n,n 2 2 ) ( P PC ) PC.(
where
P
n,n≠μ
(Aviv, 2007) assumedcapacity utilization as the product of cost of production and square of the difference between production batch size for period n and average production size)
Assume if
P
n,n=μ
, Capacity utilization is 100% PC—Product costP-Number of items produced
n n
P
, - Production batch size suggested for the next n periods at the beginning of period n.μ
-Average production size Reduced Return rate,D
R
RR
1
R- Number of returnsD – Number delivered
Adherence to production plan will reflect in the reduction of product lead time or production time (Aviv, 2007).
j n n j n
P
PP
AP
, ,1
Here, Production plan
T
j
T
j
0
, , 1 , ,
T n n j n n j n n j nP
P
P
PP
n - Current period and
1
n
T
; PPn,j- production plan at period ‘n’ for period ‘j’ Hence, operational business objectives can be quantified as follows:BOO =
CU
RR
AP
100
%
=
j n n j n n,nP
PP
D
R
P
μ
P
, , 21
1
)
(
4.3. Supply chain processes
Supply chain operations reference model (SCOR) classified processes as plan, source, make, deliver and return. Based on type of products and market value, length or degree of collaboration will differ (Ramanathan, 2012b). Products with long production cycle time takes more time to reach the market, while product with short production cycle time takes less time. Though collaboration in SCs can help to sell all products with variable lead time, products with shorter lead time have more benefit in SC collaboration (Aviv, 2001). In this research, we assume that the availability of raw material (source) is not difficult and accordingly, we consider four processes namely plan, produce, replenish and return. In SCCs planning stage will include forecasting as its integral part and hence forecasting is not treated as a separate process. SCs with activities of product returns need to check the inventory level and to arrange a proper disposition for the product returns (Dowlatshahi, 2000). In this case, performance of collaborative processes is a collective measure of cost function of adherence to plan and cost of inventory.
Production plan
T
j
T
j
0
, , 1 , ,
T n n j n n j n n j nP
P
P
PP
Adherence to plan cost function
cost Production ) .( ) ( 2 , 0 , nj T j j AP n AP PP C PP C
(based on Aviv, 2007).Product returns will increase the level of current inventory. In SCs with product returns, inventory holding cost can be quantified as follows:
D
I
HC,
D)
-R
(I
HC
Here D – No. delivered (i.e., sold to retailer) R- No. returned
I – Current inventory HC- Unit holding Cost
Performance of collaborative SC processes can be calculated as
4.4. Degree of collaboration
Previous case study research by Danese (2007) identified different levels of collaboration such as basic communication, limited collaboration and full collaboration. Larsen et al., (2003) and ECR Europe (2002) categorized the depth and level of collaboration into three different forms such as basic collaboration, developing collaboration and advanced collaboration. Whereas, Simatupang and Sridharan, (2004) categorized the level of collaborative practices into low and high collaborations. In general it is agreed that various levels and practice of collaboration can yield benefits across the whole SC. In our research, degree of collaboration is measured in terms of number of collaborating partners (can be two echelon or multi-echelon SC), duration of collaboration and level of involvement. In this research, level of involvement is defined as the involvement of top management in terms of investment on technology and people in SCC activities.
In every SCC, active participation of each SC partner can help to enhance the overall performance (Lambert and Pohlen, 2001). Cooke (2002) identified the need to change corporate culture as a pre-requirement of collaboration. Long-term SCCs can change attitude of workers. Normally, level of involvement of top management in SCC will be reflected in their investment on collaborating technology and training (Ramanathan et al., 2011). Based on the literature, we define the degree of SCC in terms of number of collaborating partners, total number of years, and investment on collaborative effort.
t Involvemen of Level business in Duration years ing Collaborat members chain supply of Number partners SCC of Number Degree
Here ‘level’ will be identified from the case company and percentage value will be assumed based on the collaborative operations (activities) in proportion to total activities.
Level of Involvement =
year
per
y
technolog
and
g
on trainin
investment
Total
year
per
y)
technolog
and
ng
(on traini
investment
ive
Collaborat
4.5. Information sharing
cost
Variable
cost
Production
)
.(
0 2 , 0 ,PP
(I
R-D)
HC
C
Average
T j j j n T j j APIn recent competitive market, a great deal of business is relying on SC information and proper use of data. SCC can contribute to improve information sharing among SC partners (Yu et al, 2001). According to VICS (2002) accelerated information sharing among SC partners will increase the reliability of the order generation. Li and Wang (2007) asserted that the benefit of information sharing is depending on two factors: one is the context and the other is the proper use of information. Optimizing the supply chain will be possible through collaboration (Horvath, 2001) and information sharing (Horvath 2001, Yu
et al. 2001). Information sharing among SC partners will help improve forecast accuracy and hence will help potential cost savings (Aviv, 2007;Byrne and Heavey, 2006). An exceptional level of service can also be achieved through integrated data and information (Kim 2006).
Critical information sharing among SC partners varies widely depending on the industries involved (Smaros, 2007). Ovalle and Marquez (2003) summarized the types of information under three headings: product information, customer demand and transaction information, and inventory information. Yu et al. (2001) revealed that the centralized information sharing benefits manufacturers more than the retailers. Though information sharing and the role of IT were accepted as significant phenomenon in collaboration (Sanders and Premus 2005), the use of technology is not argued widely as a necessary condition for collaboration. This argument is evident from Smaros’ (2007) statement ‘collaboration technology is not a key obstacle for large scale collaborative forecasting’.
In SCCs, product replenishment is a sub-process of forecasting (CPFR, 2002). Internal forecasting is the one which is generated by each collaborating partner based on the time series data and other exceptional factors (such as sales promotions) and market criteria. Collective forecasting is based on all the individual internal forecast figures which in turn facilitate order generation. Internal forecast accuracy will reflect in the collective forecast figure and help to reduce bullwhip effect (Aviv, 2001). In SCCs, the forecasting accuracy and forecast information quality can improve the profit proportion (Forslund and Jonsson, 2007).
From the above literature, we understand that effectiveness of information sharing in SCC will be reflected in forecasting accuracy (FA) of product demands (Ramanathan and Muyldermans, 2010) and returns. Accordingly, we calculate FA as follows:
Forecasting Accuracy (Sales) =
AD FD AD abs( ) 1
Forecasting Accuracy (Returns) =
AR FR AR abs( ) 1
100 2 ) ( ) ( 1 0
T j j j j j j j AR FR AR abs AD FD AD absWe assume that the demand follows the normal distribution.
FD—Expected Demand; AD- Actual Demand; FR- Expected Returns; AR- Actual Returns; j- SCC period (here, 0 < j < 6)
The underlying assumption is that the use of technology and information system helps to exchange real time information without any delay in information sharing. Hence, the point of sale data is available to manufacturer without any delay, i.e. accessibility is 100%. Standard Deviation (SD) of Forecast Error (FE) describes the spread of errors or uncertainty about an error which can be used for setting safety stock.
Forecasting Error is calculated as follows:
Absolute percentage of error (Sales) % = 100%
AD FD) abs(AD
Absolute percentage of error (Returns) % = 100%
AR FR) abs(AR
In this paper, we measure the degree of collaboration based on the level of involvement; the length of collaboration (period) and the number of partners. The impact of change in the degree of collaboration will be identified in forecast accuracy, business objectives and processes. The overall performance of SCC is calculated as the sum of individual performance in terms of BOO, BOF, forecasting accuracy, and processes at various degrees of collaboration.
5. Analysis and discussion of simulation results
Improving overall performance, in terms of both quality and service, of SCs along with other business objectives such as maximising profit and minimising costs are the common underlying features of CPFR. But not many researchers have considered the impact of other underlying factors such as degree of collaboration, involvement of top management, information sharing, customer support, business objectives and SC processes. Magnitude of benefits on implementation of SCC often varies widely across different industries as substantial amount of investment and time are involved (Ramanathan et al., 2011). For example, products that are mainly manufactured to stock (such as detergents and shampoo) will have longer shelf life (Fisher, 1997) and hence SCs may not require high degree of collaboration. At the same time, fast moving technology products such as laptops and software need to be sold in a short span of
time in order to avoid obsolescence which requires higher degree of collaborative support from other SC members.
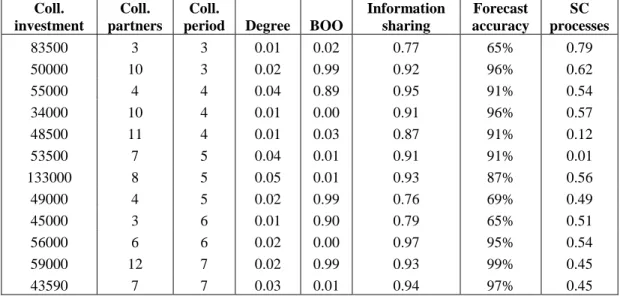
For the purpose of this research we have contacted five different global companies from the packaging industry, who practice SCC. Three of them have collaboration with either upstream or downstream SC partners but not with both. Finally, we have considered two manufacturing companies who have been involved in collaboration for over six years with both upstream and downstream customers. SCC information selected for further analyses were mainly focussed on five factors as explained before. For each company, we have collected data of 10 collaborating partners and simulated the data using excel. Table 2 describes the sample data of one of the companies collaborating with different supply chain partners at various degrees. The first three columns of the table represent SC investment in collaboration (in US dollars), number of partners and length of collaboration. All the remaining columns have used the formula as described in Section 4.
Table 2: Analysis of sample data
Coll. investment
Coll. partners
Coll.
period Degree BOO
Information sharing Forecast accuracy SC processes 83500 3 3 0.01 0.02 0.77 65% 0.79 50000 10 3 0.02 0.99 0.92 96% 0.62 55000 4 4 0.04 0.89 0.95 91% 0.54 34000 10 4 0.01 0.00 0.91 96% 0.57 48500 11 4 0.01 0.03 0.87 91% 0.12 53500 7 5 0.04 0.01 0.91 91% 0.01 133000 8 5 0.05 0.01 0.93 87% 0.56 49000 4 5 0.02 0.99 0.76 69% 0.49 45000 3 6 0.01 0.90 0.79 65% 0.51 56000 6 6 0.02 0.00 0.97 95% 0.54 59000 12 7 0.02 0.99 0.93 99% 0.45 43590 7 7 0.03 0.01 0.94 97% 0.45
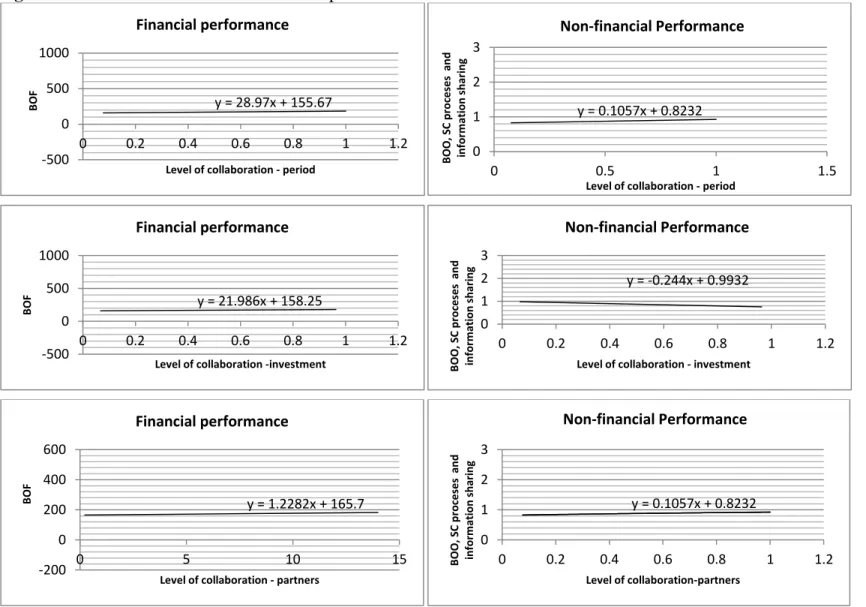
We have simulated 1000 instances of SCC based on the company’s data. The results indicate that the forecasts accuracy becomes stable over a period of time with the same number of collaborating partners. Figure 3 indicates the effect of the levels of collaboration on the performance of the company in terms of financial and non-financial objectives (SC processes and information sharing). SC partners collaborating for longer period of time have achieved increasing performance both financially and operationally. But it is not guaranteed that the company individual financial business objectives will be achieved consistently in case of high investments on collaboration. Also, the higher the number of collaborating partners does not mean proportionately the higher the level of performance. The
performance of the company shows a very slow but incremental effect against the level of collaboration in terms of number of partners (see Figure 3).
Our interview with the case companies revealed that collaborating partners who are in the same business for a long term will bring success for all SC collaborating partners. This is possible mainly due to the sharing of knowledge and well established SC network. But “new members need to wait to reveal the actual benefit of collaboration. Huge investment in SCCs will not always help to reap the benefit quickly. Time is the key success factor in collaboration. Committed SC partners make our SCs really profitable and successful in terms of performance”.
The results of the analysis suggest that companies do not need to investment on collaboration every year in order to yield high profit. Companies that believe in high investment on collaborative relationship without having effective SC operations will be difficult to survive in the competitive market. Even though new partnership is encouraged in competitive business scenario, it is vital for companies to continue the existing profitable partnership for a longer period of time to obtain consistent performance.
Figure 3: Effect of levels of collaboration on performance
y = 28.97x + 155.67 -500 0 500 1000 0 0.2 0.4 0.6 0.8 1 1.2 B O FLevel of collaboration - period
Financial performance y = 0.1057x + 0.8232 0 1 2 3 0 0.5 1 1.5 B O O , SC proce se s a nd inform at ion shari ng
Level of collaboration - period
Non-financial Performance y = 21.986x + 158.25 -500 0 500 1000 0 0.2 0.4 0.6 0.8 1 1.2 B O F
Level of collaboration -investment
Financial performance y = -0.244x + 0.9932 0 1 2 3 0 0.2 0.4 0.6 0.8 1 1.2 B O O , SC proce se s a nd inform at ion shari ng
Level of collaboration - investment
Non-financial Performance y = 1.2282x + 165.7 -200 0 200 400 600 0 5 10 15 B O F
Level of collaboration - partners
Financial performance y = 0.1057x + 0.8232 0 1 2 3 0 0.2 0.4 0.6 0.8 1 1.2 B O O , SC proce se s a nd inform at ion shari ng Level of collaboration-partners Non-financial Performance
6. Managerial implications, conclusions and future research
This paper addresses a recent relevant practical approach of SC collaboration in performance improvement. Understanding the important factors of SC collaboration and their impact on the potential benefits of SC can help the top management to understand the required degree of collaboration with upstream and downstream partners. One of the interesting managerial insights on fundamental principal of collaboration is that neither investment nor number of partners nor duration of collaboration, will independently contribute to improve the performance of SCs. This result helps to understand the importance of involvement of each SC partner. Increasing the number of partners in SCs will complicate the decision making and hence slow down the performance. However, human interactions in SCs can assist appropriate investment decisions in IT and collaborations to improve SC processes. Long-term collaborating partners can help yielding sustainable benefits to SCs.
In general, the financial performance of a company is an indicator of success of operational performance. From the data analysis, we identified that the less involvement of top management in SC collaboration results in poorer overall performance. By measuring the performance, the top management of the company can decide whether to improve its investments in collaborative activities. Measuring the forecast accuracy can alert the managers the usefulness of available information and also can point out the need for accessible information and technology (Ramanathan and Muyldermans, 2010). Different supply chain partners collaborating for various purposes will have individual business objectives. Successful collaboration will help the businesses to be successful in achieving those set objectives. By measuring both financial and operational objectives any company can understand the current accomplishment of expected achievements. For example, in the given case company, the higher investment in collaboration has not shown more substantial benefit in terms of revenue. Hence, the company can try to improve other aspects of the current collaborative arrangement instead of investing further in the collaboration. On knowing the potential benefits of SC collaboration, SC partners can extend their partnership further to increase profit, to reduce lead time and to improve customers’ satisfaction. In this research, we have tested the SC collaboration with different levels of involvement and partnerships for certain period of time using simulation techniques. For different degrees of collaboration, the benefits of SC are found different. In real businesses, it is risky to experiment various degrees of collaboration as it can involve a huge amount of investment.
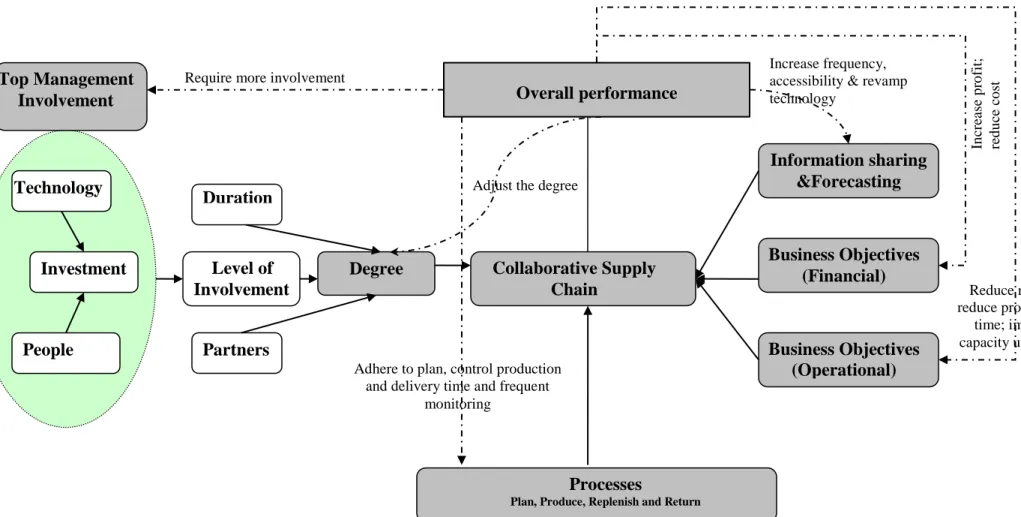
Findings of this research suggest that the degree of collaboration should be revised on analysing the performance of the company (see Figure 4). The conduciveness of collaboration for any company depends on its flexibility in changing the degree of collaboration to achieve the business objectives. For example, if too many SC partners are involved in the collaboration, the partners with the highest
investment may have the power of dominance in planning and decision making; this may affect the smaller players in SCC arrangements (Aviv, 2007). In this case, the top management of the focal company can alter the degree of collaboration such as duration of collaboration, level of involvement and number of participating members to achieve required performance. Irrespective of the degree of collaboration, another performance measure namely, ‘forecast accuracy of the company’ will explicitly indicate the role of information exchange in the collaborative SC (Ramanathan and Muyldermans, 2010). Since the products with shorter lead time can normally benefit more from collaborative forecasting (Aviv, 2001), in this research we suggest extending the use of collaborative forecasting for products with medium or longer lead time. In poor forecast accuracy, top management can increase accessibility of information exchange. The company can also think of revamping the IT technology in order to improve the efficiency of information sharing.
Achieving the predefined business objectives in terms of financial and operational activities will help the SC partners to sustain in the competitive business market. Performance measurement, in terms of financial and operational business objectives, indicates the conduciveness of the current SC collaboration. The collaborating company can adjust the degree of collaboration to match its business objectives. For example, SCC can be strengthened to increase profit by reducing the cost of operations. Similarly, SC collaboration can help reducing the product returns or help selling the returned products in secondary markets. Our research confirms that production lead time and capacity utilisation can also be improved with SC collaboration of suppliers’ for on-time delivery of raw materials for timely planned production (see Figure 4).
To evolve efficient and effective competitive supply chain collaboration, all SC processes need to be assessed from time to time for evaluating the performance. In a growing field, performance measurement is highly indispensable in order to improve further. In a new field, it is equally important to monitor the performance to test the conduciveness. Our research has indicated the importance of identifying conducive environments for successful supply chain collaborations. We have based our simulation study using data from two companies from packaging industry. The same research can be extended further for different industries that have SC collaboration with many partners involving huge investment for long duration. This can help to draw a general conclusion on suggested level of investment and supply chain partnership, specific to each business sector.
Collaborative Supply
Chain
Processes
Plan, Produce, Replenish and Return
Overall performance
Degree
Information sharing
&Forecasting
Business Objectives
(Financial)
Duration
Partners
Level of
Involvement
Investment
Technology
People
Top Management
Involvement
Business Objectives
(Operational)
Adjust the degreeIncrease frequency, accessibility & revamp technology In cr ea se p ro fit; red u ce co st
Require more involvement
Adhere to plan, control production and delivery time and frequent
monitoring
Reduce returns; reduce product lead
time; improve capacity utilization
Figure 4: Areas of improvement in SC collaboration
References
Angerhofer, B.J. and Angelides, M.C. (2006). A model and a performance measurement system for collaborative supply chains. Decision Support Systems 42, 283-301.
Aviv, Y. (2001). The effect of collaborative forecasting on supply chain performance. Management Science 47 (10), 1326-1343.
Aviv, Y. (2002). Gaining benefits from joint forecasting and replenishment process: The Case of Auto-Correlated demand. Manufacturing & Service Operations Management 4 (1), 55-74. Aviv, Y. (2007). On the benefits of collaborative forecasting partnerships between retailers and
manufacturers. Management Science 53 (5), 777-794.
Barratt, M. and Oliveira, A. (2001). Exploring the experiences of collaborative planning initiatives. International Journal of Physical Distribution & Logistics Management 31 (4), 266-289.
Boddy, D., Cahill, C., Charles, M, Fraser-Kraus. M and MacBeth, D. (1998) Success and failure in implementing supply chain partnering: an empirical study. European Journal of Purchasing and Supply Management 2(2-3), 143-151.
Byrne, P.J. and Heavey, C. (2006). The impact of information sharing and forecasting in capacitated industrial supply chains: A case study. International Journal of Production Economics 103 (1), 420-437.
Cachon, G.P. and Fisher, M. (2000). Supply chain inventory management and the value of shared information. Management Science 46 (8), 1032-1048.
Cadilhon, J. and Fearne, A. P. (2005). Lessons in Collaboration: A case study from Vietnam. Supply Chain Management Review 9 (4), 11-12.
Caridi, M., Cigolini, R. and Marco, D.D. (2005). Improving supply-chain collaboration by linking intelligent agents to CPFR. International Journal of Production Research 43(20), 4191-4218. Chang, T., Fu, H., Lee, W., Lin, Y. and Hsueh, H. (2007). A study of an augmented CPFR model
for the 3C retail industry. Supply chain management: An International Journal 12, 200-209. Chan, Felix.T.S. and Zhang, T. (2011). The impact of collaborative transportation management
on supply chain performance: A simulation approach. Expert Systmes with Applications, 38 (3), 2319-2329.
Chen, I.J. and Paulraj, A. (2004). Towards a theory of supply chain management: the constructs and measurements. Journal of Operations Management 22, 119-150.
Chen, T. H. and Chen, J. M. (2005). Optimizing supply chain collaboration based on joint replenishment and channel coordination. Transportation Research Part E: Logistics and Transportation Review 41, 261-285.
Cheung, C.F., Cheung, C.M. and Kwok, S.K. (2012). A knowledge-based customization system for supply chain integration. Expert Systems with Applications. 39 (4), 3906-3924.
Christopher, M. (1998). Logistics and Supply Chain Management, second ed. Financial Times Press, Prentice Hall, Englewood Cliffs, NJ.
Chung, W.C. and Leung, W.F. (2005). Collaborative planning, forecasting and replenishment: a case study in copper clad laminate industry. Production Planning & Control 16 (6), 563-574. Cooke, 2002;
Cooper, M.C., Lamber, P.M. and Pagh, J.D. (1997). Supply chain management: more than just a new name for logistics. International Journal of Logistics Management 8(1), 1-14.
Corsten, D. and Felde, J. (2005). Exploring the performance effects of key supplier collaboration. International Journal of Physical Distribution & Logistics Management 35 (6), 445-461. Danese, P. (2007). Designing CPFR collaborations: insights from seven case studies.
International Journal of Operations and Production Management 27 (2), 181-204.
Dowlatshahi, S. (2000). Developing a theory of Reverse Logistics, Interfaces 30 (3), 143-155. ECR, Europe (2002). European CPFR Insights, ECR European facilitated by Accenture, Brussels. Fisher, M.L. (1997). What is the right supply chain for your product? Harvard Business Review,
75 (2), 105-116.
Fliedner, G. (2003). CPFR: An emerging supply chain tool. Industrial Management + Data Systems 103 (1/2), 14-21.
Forslund, H. and Jonsson, P. (2007). The impact of forecast information quality on supply chain performance. International Journal of Operations & Production Management 27 (1), 90-107. Fu, Y. and Piplani, R. (2004). Supply-side collaboration and its value in supply chains. European
Journal of Operational Research 152, 281-288.
Gavirneni, S., Kapuscinski, R. and Tayur, S. (1999). Value of information in capacitated supply chains. Management Science 45 (1), 16-24.
Horvath, L. (2001). Collaboration: The key to value creation in supply chain management. Supply Chain Management 6 (5), 205.
Humphreys, P. K., Shiu, W. K. and Chan, F. T. S. (2001). Collaborative buyer-supplier relationships in Hong Kong manufacturing firms. Supply Chain Management 6 (3/4), 152-162. Ireland, R.K. and Crum, C. (2005). Supply chain collaboration: How to implement CPFR and
other best collaborative practices. J. Ross Publishing Inc.: Florida.
Kim, B. and Oh, H. (2005). The impact of decision-making sharing between supplier and manufacturer on their collaboration performance. Supply Chain Management 10 (3/4), 223-236.
Kwon, O., Im, G.P. and Lee, K.C. (2007). MACE-SCM: A mult-agent and case based reasoning collaboration mechanism for supply chain managment under supply and demand uncertainties. Expert Systems with Applications, 33 (3), 690-705.
Lambert, D.M. and Pohlen, T.L. (2001). Supply chain metrics. International Journal of Logistics Management 12 (1), 1-19.
Larsen, T.S., Thenoe, C. and Andresen, C. (2003). Supply chain collaboration: Theoretical perspectives and empirical evidence. International Journal of Physical Distribution & Logistics Management 33 (6), 531-549.
Lee, H. and Whang, S. (2001). Demand chain excellence: A tail of two retailers. Supply Chain Management Review 5 (2), 40-46
Lee, H. L. (2002). Aligning Supply Chain Strategies with Product Uncertainties. California Management Review 44 (3), 105-119.
Lee, H.L., So, K.C. and Tang, C.S. (2000). The value of information sharing in a two-level supply chain. Management Science 46 (5), 626-643.
Lee., H.L. and Padmanabhan.,V. (1997). Information distortion in a supply chain: The bullwhip effect. Management Science 43, 546.
Li, X. and Wang, Q. (2007). Coordination mechanisms of supply chain systems. European Journal of Operational Research 179 (1), 1-16.
Matchette, J. and Seikel, A. (2004). How to win friends and influence supply chain partners. Logistics Today 45 (12), 40-42.
McCarthy, T.M. and Golicic, S. L. (2002). Implementing collaborative forecasting to improve supply chain performance. International Journal of Physical Distribution & Logistics Management 32 (6), 431-454.
Mishra, A.A. and Shah, R. (2009). In union lies strength: Collaborative competence in new product development and its performance effects. Journal of Operations Management 27 (4), 324-338.
Nyaga, G.N., Whipple, J.M. and Lynch,D.F. (2010). Examiningsupplychainrelation-ships:do buyer andsupplier perspectives on collaborative relationships differ? Journal of Operations Management 28,101–114.
Ovalle, O.R., Marquez, A.C. (2003). The effectiveness of using e-collaboration tools in the supply chain: An assessment study with system dynamics. Journal of Purchasing & Supply Management 9 (4), 151-163.
Raghunathan, S. (2001). Information sharing in a supply chain: A note on its value when demand is non stationary. Management Science 47 (4), 605-610.
Raghunathan, S. (2001). Information sharing in a supply chain: A note on its value when demand is non stationary. Management Science 47 (4), 605-610.
Ramanathan, U and Muyldermans, L. (2011). Identifying the underlying structure of demand during promotions: A structural equation modelling approach. Expert Systems with Applications 38(5), 5544-5552.
Ramanathan, U. (2012a). Aligning supply chain collaboration using Analytic Hierarchy Process.
Omega - The International Journal of Management Science
(forthcoming.doi:10.1016/j.omega.2012.03.001).
Ramanathan, U. (2012b). Supply chain collaboration for improved forecast accuracy of promotional sales, International Journal of Operations and Production Management, 32 (6) (forthcoming).
Ramanathan, U. and Muyldermans, L. (2010). Identifying demand factors for promotional planning and forecasting: A case of a soft drink company in the UK. International Journal of Production Economics, 128 (2), 538-545.
Ramanathan, U., Gunasekaran, A. and Subramanian, N. (2011), Performance metrics for collaborative supply chain: A conceptual framework from case studies, Benchmarking: An International Journal, 18 (6), 856-872.
Ramanathan. U. and Gunasekaran, A., (2013). Supply chain collaboration: Impact of success in long-term partnerships. International Journal of Production Economics. (forthcoming.http://dx.doi.org/10.1016/j.ijpe.2012.06.002).
Sanders, N. R. and Premus, R. (2005). Modelling the relationship between firm IT capability collaboration and performance. Journal of Business Logistics 26 (1), 1-23.